Vancomycin and meropenem in paediatric ECMO (Zylbersztajn 2021)
Source:vignettes/articles/Zylbersztajn_2021_vancomycin_meropenem.Rmd
Zylbersztajn_2021_vancomycin_meropenem.RmdModel and source
Zylbersztajn 2021 fitted two independent two-compartment models, one for vancomycin and one for meropenem, to the same nine children on extracorporeal membrane oxygenation (ECMO). Each is shipped as its own model file:
-
Zylbersztajn_2021_vancomycin: Two-compartment IV population PK model for vancomycin in 9 paediatric patients (2 months to 11 years) on extracorporeal membrane oxygenation (Zylbersztajn 2021). Pmetrics NPAG non-parametric fit parameterised by clearance, central volume and the rate constants Kcp / Kpc. Total body weight scales clearance and central volume linearly (reference 15.5 kg) and clearance is inversely proportional to serum creatinine (reference 0.34 mg/dL), as CLw = CL(WT/15.5)(0.56*(0.34/CREAT)). Typical values are the medians of the per-kg individual-parameter summary (Table 6) anchored at the reference patient. -
Zylbersztajn_2021_meropenem: Two-compartment IV population PK model for unbound meropenem in 9 paediatric patients (2 months to 13 years) on extracorporeal membrane oxygenation (Zylbersztajn 2021). Pmetrics NPAG non-parametric fit parameterised by clearance, central volume and the rate constants Kcp / Kpc. Total body weight scales the central volume linearly (reference 20.4 kg); clearance carries no covariate. Typical values are the medians of the per-kg individual-parameter summary (Table 5) anchored at the 20.4 kg reference weight. - Citation: Zylbersztajn B, Parker S, Navea D, Izquierdo G, Ortiz P, Torres JP, Fajardo C, Diaz R, Valverde C, Roberts J. Population Pharmacokinetics of Vancomycin and Meropenem in Pediatric Extracorporeal Membrane Oxygenation Support. Front Pharmacol. 2021;12:709332. doi:10.3389/fphar.2021.709332
- Article: https://doi.org/10.3389/fphar.2021.709332 (open access)
Population
The study was prospective and ran in two paediatric intensive care units in Santiago, Chile, between July 2017 and November 2019. It enrolled children under 15 years of age (neonates excluded) who needed ECMO and received vancomycin and/or meropenem for suspected or confirmed infection. Nine patients contributed 11 PK profiles per drug: one patient was sampled on three occasions, two received only vancomycin and two received only meropenem. All circuits used a polymethylpentene oxygenator with a phosphorylcholine coating. Five patients were on veno-arterial and four on veno-venous ECMO.
| Characteristic (Tables 1-2) | Vancomycin | Meropenem |
|---|---|---|
| Female / male (n) | 6 / 3 | 5 / 4 |
| Age, months: mean, median (range) | 50.4, 24 (2-132) | 68.3, 48 (2-165) |
| Weight, kg: mean, median (range) | 15.5, 10 (3.5-37) | 20.4, 16 (3.5-45) |
| Serum creatinine, mg/dL: mean, median (range) | 0.34, 0.22 (0.08-1.23) | 0.41, 0.3 (0.08-1.27) |
| CRRT (n) | 2 | 4 |
| Regimen | 10-15 mg/kg as a 2-h infusion q6h or q12h | 20-40 mg/kg as a 3-h infusion q8h or q12h |
| Median daily dose | 54 (20-60) mg/kg/day | 120 (60-120) mg/kg/day |
| Samples | 44 (0.5, 1, 2 h post-infusion and pre-dose) | 33 (1, 3 h post-infusion and pre-dose) |
Unbound concentrations were measured: vancomycin by immunoassay (LLOQ
1.7 mg/L) and meropenem by HPLC-UV (LLOQ 0.16 mg/L). Both models were
fitted with the non-parametric NPAG algorithm in Pmetrics 1.5.0. The
same information is available programmatically via
readModelDb("Zylbersztajn_2021_vancomycin")$population.
How the parameter values were read
The paper prints each final model as a Pmetrics model file (Tables 3
and 4). The #Primary variables lines of those files are the
NPAG search ranges, not estimates. The only numeric
results are Tables 5 and 6, which summarise the individual parameters
per kilogram (mean, SD, median, CV%, shrinkage). These
tables cannot be a rescaling of the printed primaries. For meropenem,
for example, a V confined to the printed 2-3.5 L range cannot have the
72% CV that Table 5 reports, and the Table 5 mean of 0.289 L/kg x 20.4
kg = 5.9 L lies outside that range. The maintainers therefore anchored
the Table 5/6 medians at each model’s reference
patient:
-
Central volume scales linearly with weight in both
models (
Vw = V*(WGT/ref)), so a per-kg Vc is exactly the model’s own structure: Vc = 0.289 L/kg x 20.4 kg (meropenem) and 0.397 L/kg x 15.5 kg (vancomycin). -
Meropenem clearance has no weight term
(
Ke = CL/Vw) but is reported per kg. It is held flat at its value for the reference weight: 0.144 L/h/kg x 20.4 kg = 2.94 L/h. -
Vancomycin clearance is printed as
CLw = CL*(wgt/15.5)*(0.56*(0.34/crea)). The Table 6 median of 0.061 L/h/kg is read as CLw per kg at the reference patient (15.5 kg, creatinine 0.34 mg/dL), so CLw = 0.9455 L/h there. The literal 0.56 multiplier is kept as printed, which makes the primary CL 0.9455 / 0.56 = 1.688 L/h. - Kcp and Kpc are not weight-scaled and are the Table 5/6 medians.
The typical-value checks below pin these anchors.
mod_v <- readModelDb("Zylbersztajn_2021_vancomycin")
mod_m <- readModelDb("Zylbersztajn_2021_meropenem")

typ_ev <- function(wt, creat) {
  data.frame(
    id = seq_along(wt), time = 0, evid = 0L, cmt = "central",
    WT = wt, CREAT = creat
  )
}
wts <- c(3.5, 10, 15.5, 20.4, 45)
typ_v <- rxode2::rxSolve(rxode2::zeroRe(mod_v), typ_ev(wts, 0.34)) |> as.data.frame()
#> ℹ parameter labels from comments will be replaced by 'label()'
#> ℹ omega/sigma items treated as zero: 'etalcl', 'etalvc', 'etalk12', 'etalk21'
#> Warning: multi-subject simulation without without 'omega'
typ_m <- rxode2::rxSolve(rxode2::zeroRe(mod_m), typ_ev(wts, 0.34)) |> as.data.frame()
#> ℹ parameter labels from comments will be replaced by 'label()'
#> ℹ omega/sigma items treated as zero: 'etalcl', 'etalvc', 'etalk12', 'etalk21'
#> Warning: multi-subject simulation without without 'omega'

typ_tab <- data.frame(
  WT = wts,
  vanco_cl_per_kg = typ_v$cl / wts,
  vanco_vc_per_kg = typ_v$vc / wts,
  mero_cl = typ_m$cl,
  mero_vc_per_kg = typ_m$vc / wts
)
typ_tab |>
  dplyr::rename(
    "Weight (kg)" = WT,
    "Vancomycin CL (L/h/kg), creatinine 0.34" = vanco_cl_per_kg,
    "Vancomycin Vc (L/kg)" = vanco_vc_per_kg,
    "Meropenem CL (L/h)" = mero_cl,
    "Meropenem Vc (L/kg)" = mero_vc_per_kg
  ) |>
knitr::kable(digits = 4)| Weight (kg) | Vancomycin CL (L/h/kg), creatinine 0.34 | Vancomycin Vc (L/kg) | Meropenem CL (L/h) | Meropenem Vc (L/kg) |
|---|---|---|---|---|
| 3.5 | 0.061 | 0.397 | 2.9376 | 0.289 |
| 10.0 | 0.061 | 0.397 | 2.9376 | 0.289 |
| 15.5 | 0.061 | 0.397 | 2.9376 | 0.289 |
| 20.4 | 0.061 | 0.397 | 2.9376 | 0.289 |
| 45.0 | 0.061 | 0.397 | 2.9376 | 0.289 |
stopifnot(
  # Table 6 medians at the vancomycin reference patient.
  abs(typ_v$cl[wts == 15.5] / 15.5 / 0.061 - 1) < 1e-6,
  all(abs(typ_v$vc / wts / 0.397 - 1) < 1e-6),
  # Vancomycin CL per kg is weight-independent at a fixed creatinine.
  all(abs(typ_v$cl / wts / 0.061 - 1) < 1e-6),
  # Table 5 medians for meropenem; CL flat in weight.
  all(abs(typ_m$cl / (0.144 * 20.4) - 1) < 1e-6),
  all(abs(typ_m$vc / wts / 0.289 - 1) < 1e-6)
)
Under the literal creatinine term, vancomycin clearance is inversely proportional to creatinine. Halving creatinine from the reference doubles clearance:
typ_c <- rxode2::rxSolve(
  rxode2::zeroRe(mod_v),
  typ_ev(rep(15.5, 3), c(0.17, 0.34, 0.68))
) |> as.data.frame()
#> ℹ parameter labels from comments will be replaced by 'label()'
#> ℹ omega/sigma items treated as zero: 'etalcl', 'etalvc', 'etalk12', 'etalk21'
#> Warning: multi-subject simulation without without 'omega'
typ_c$cl / typ_c$cl[2]
#> [1] 2.0 1.0 0.5
stopifnot(all(abs(typ_c$cl / typ_c$cl[2] - c(2, 1, 0.5)) < 1e-6))
Source trace
Per-parameter origins are also recorded inline in
inst/modeldb/specificDrugs/Zylbersztajn_2021_vancomycin.R
and
inst/modeldb/specificDrugs/Zylbersztajn_2021_meropenem.R.
| Equation / parameter | Vancomycin | Meropenem | Source location |
|---|---|---|---|
| Two compartments; first-order elimination and distribution (Kcp, Kpc) | – | – | Methods, Model Development; Results |
Vw = V*(WGT/ref) |
ref 15.5 kg | ref 20.4 kg | Tables 3, 4 |
CLw = CL*(wgt/15.5)*(0.56*(0.34/crea)) |
as printed | – | Table 4 |
Ke = CL/Vw (no covariate on CL) |
– | as printed | Table 3 |
Vp = Vc*Kcp/Kpc (derived, not estimated) |
– | – | Methods |
lcl |
log(0.061 x 15.5 / 0.56) = log(1.688 L/h) | log(0.144 x 20.4) = log(2.94 L/h) | Tables 6, 5: CL median |
lvc |
log(0.397 x 15.5) = log(6.15 L) | log(0.289 x 20.4) = log(5.90 L) | Tables 6, 5: Vc median |
lk12 (Kcp) |
log(0.481 1/h) | log(1.30 1/h) | Tables 6, 5: Kcp median |
lk21 (Kpc) |
log(0.286 1/h) | log(1.34 1/h) | Tables 6, 5: Kpc median |
etalcl |
log(0.922^2 + 1) = 0.6152 | log(0.733^2 + 1) = 0.4300 | Tables 6, 5: CL CV% |
etalvc |
log(0.610^2 + 1) = 0.3163 | log(0.720^2 + 1) = 0.4177 | Tables 6, 5: Vc CV% |
etalk12 |
log(0.630^2 + 1) = 0.3343 | log(0.726^2 + 1) = 0.4234 | Tables 6, 5: Kcp CV% |
etalk21 |
log(0.458^2 + 1) = 0.1904 | log(0.790^2 + 1) = 0.4850 | Tables 6, 5: Kpc CV% |
addSd |
3 x 2 = 6 mg/L | 1 x 0.2 = 0.2 mg/L | Tables 4, 3: G x C0 |
propSd |
3 x 1 = 3 | 1 x 0.1 = 0.1 | Tables 4, 3: G x C1 |
The Table 5/6 derived rows (Vp, Vd) are means of individual ratios and are not used by the model. Under the medians, the typical Vp is 0.289 x 1.30 / 1.34 = 0.280 L/kg for meropenem (Table 5 mean 0.317) and 0.397 x 0.481 / 0.286 = 0.668 L/kg for vancomycin (Table 6 mean 0.816; Table 6 prints its unit as L/h, a misprint for L/kg).
Two-compartment disposition is real
The models declare vp and q, so rxode2
integrates the explicit two-compartment ODEs rather than collapsing
cl / vc to a one-compartment kernel. The check
below solves a single typical infusion at the reference patient and
compares it with the closed-form biexponential infusion solution. Both
sides use the same parameters, so the difference is numerical error
only.
biexp_infusion <- function(t, dose, dur, cl, vc, k12, k21) {
  k10 <- cl / vc
  s <- k10 + k12 + k21
  alpha <- (s + sqrt(s^2 - 4 * k10 * k21)) / 2
  beta <- (s - sqrt(s^2 - 4 * k10 * k21)) / 2
  a <- (alpha - k21) / (alpha - beta)
  b <- (k21 - beta) / (alpha - beta)
  r <- dose / dur
  tin <- pmin(t, dur)
  amt <- r * (a / alpha * (exp(-alpha * (t - tin)) - exp(-alpha * t)) +
    b / beta * (exp(-beta * (t - tin)) - exp(-beta * t)))
  amt / vc
}

closed_check <- function(mod, wt, creat, dose, dur) {
  ev <- dplyr::bind_rows(
    data.frame(id = 1L, time = 0, amt = dose, rate = dose / dur, evid = 1L, cmt = "central"),
    data.frame(id = 1L, time = seq(0.25, 24, by = 0.25), amt = NA, rate = NA, evid = 0L, cmt = "central")
  ) |>
    dplyr::mutate(WT = wt, CREAT = creat)
  s <- rxode2::rxSolve(rxode2::zeroRe(mod), ev, rtol = 1e-10, atol = 1e-12) |>
    as.data.frame()
  ref <- biexp_infusion(s$time, dose, dur, s$cl[1], s$vc[1], s$k12[1], s$k21[1])
  list(sim = s, rel = s$Cc / ref - 1)
}

chk_v <- closed_check(mod_v, 15.5, 0.34, 13.5 * 15.5, 2)
#> ℹ parameter labels from comments will be replaced by 'label()'
#> ℹ omega/sigma items treated as zero: 'etalcl', 'etalvc', 'etalk12', 'etalk21'
chk_m <- closed_check(mod_m, 20.4, 0.34, 40 * 20.4, 3)
#> ℹ parameter labels from comments will be replaced by 'label()'
#> ℹ omega/sigma items treated as zero: 'etalcl', 'etalvc', 'etalk12', 'etalk21'
c(vancomycin = max(abs(chk_v$rel)), meropenem = max(abs(chk_m$rel)))
#>   vancomycin    meropenem
#> 6.572232e-11 3.036975e-10
stopifnot(max(abs(chk_v$rel)) < 1e-6, max(abs(chk_m$rel)) < 1e-6)
Virtual cohorts
Each drug gets a cohort of 200 children dosed at the paper’s median regimen:
- vancomycin 13.5 mg/kg as a 2-h infusion every 6 h (54 mg/kg/day);
- meropenem 40 mg/kg as a 3-h infusion every 8 h (120 mg/kg/day).
Weight and creatinine are drawn from log-normal distributions with
each cohort’s Table 2 median and mean, truncated to the Table 2 range.
The individual covariate values and their correlation are not published,
so the draws are independent. Meropenem does not use creatinine, which
is set to the cohort median. Sampling is at steady state
(ss = 1), matching the paper’s sampling after 24 h
(meropenem) and 48 h (vancomycin) of treatment.
rxode2::rxSetSeed(20210813)
n_per_arm <- 200

rtrunc_lnorm <- function(n, med, mean, lo, hi) {
  s <- sqrt(2 * log(mean / med))
  u <- stats::runif(n, stats::plnorm(lo, log(med), s), stats::plnorm(hi, log(med), s))
  stats::qlnorm(u, log(med), s)
}

make_events <- function(covs, mg_per_kg, tau, dur) {
  dose <- covs |>
    dplyr::mutate(
      time = 0, amt = mg_per_kg * WT, rate = amt / dur, ii = tau,
      addl = 24 / tau, ss = 1L, evid = 1L, cmt = "central"
    )
  obs <- tidyr::expand_grid(id = covs$id, time = seq(0, 24, by = 0.25)) |>
    dplyr::left_join(covs, by = "id") |>
    dplyr::mutate(evid = 0L, cmt = "central")
  dplyr::bind_rows(dose, obs) |>
    dplyr::arrange(id, time, dplyr::desc(evid))
}

cov_v <- data.frame(
  id = seq_len(n_per_arm),
  treatment = "Vancomycin 13.5 mg/kg q6h",
  WT = rtrunc_lnorm(n_per_arm, 10, 15.5, 3.5, 37),
  CREAT = rtrunc_lnorm(n_per_arm, 0.22, 0.34, 0.08, 1.23)
)
cov_m <- data.frame(
  id = seq_len(n_per_arm),
  treatment = "Meropenem 40 mg/kg q8h",
  WT = rtrunc_lnorm(n_per_arm, 16, 20.4, 3.5, 45),
  CREAT = 0.3
)
tau_v <- 6
tau_m <- 8
ev_v <- make_events(cov_v, 13.5, tau_v, 2)
ev_m <- make_events(cov_m, 40, tau_m, 3)
Simulation
sim_v <- rxode2::rxSolve(mod_v, ev_v, maxsteps = 1e6, keep = c("treatment", "WT", "CREAT")) |>
  as.data.frame()
#> ℹ parameter labels from comments will be replaced by 'label()'
sim_m <- rxode2::rxSolve(mod_m, ev_m, maxsteps = 1e6, keep = c("treatment", "WT")) |>
  as.data.frame()
#> ℹ parameter labels from comments will be replaced by 'label()'
stopifnot(!anyNA(sim_v$Cc), !anyNA(sim_m$Cc))
dplyr::bind_rows(sim_v, sim_m) |>
  dplyr::group_by(treatment, time) |>
  dplyr::summarise(
    med = stats::median(Cc),
    lo = stats::quantile(Cc, 0.05),
    hi = stats::quantile(Cc, 0.95),
    .groups = "drop"
  ) |>
  ggplot(aes(time, med)) +
  geom_ribbon(aes(ymin = lo, ymax = hi), alpha = 0.25) +
  geom_line() +
  facet_wrap(~treatment, scales = "free_y") +
  labs(x = "Time after a steady-state dose (h)", y = "Unbound concentration (mg/L)")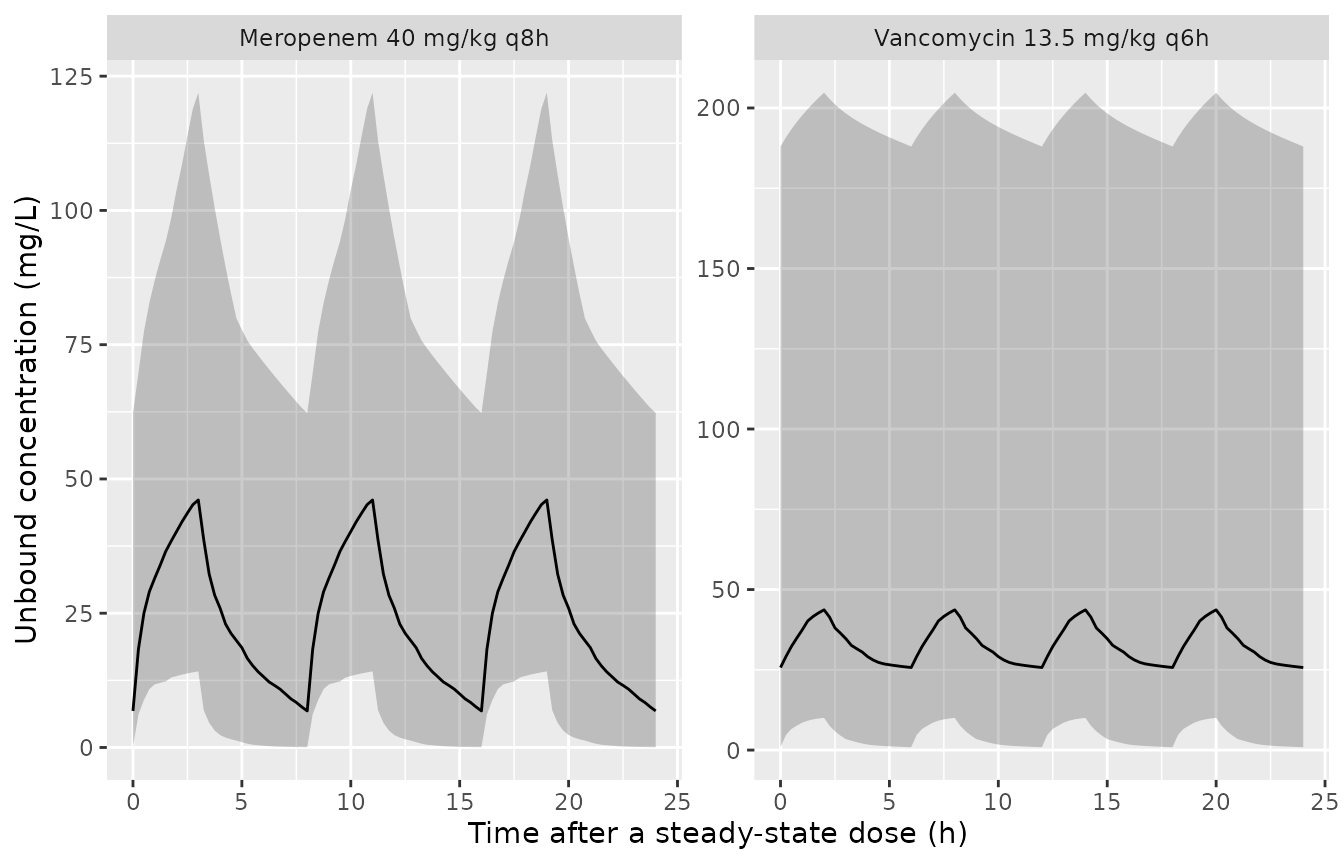
Simulated steady-state unbound concentrations (median and 5th-95th percentiles of the individual predictions) over 24 h at the median regimens. Analogue of Figures 2 (meropenem) and 4 (vancomycin) of Zylbersztajn 2021; the observed data are not published, so no observations are overlaid.
PKNCA validation
PKNCA summarises the steady-state 24-h window for vancomycin (four doses) and one 8-h interval for meropenem.
nca_run <- function(sim, tau, mg_per_kg, end) {
  conc <- sim |>
    dplyr::filter(!is.na(Cc), time <= end) |>
    dplyr::select(id, time, Cc, treatment)
  dose <- sim |>
    dplyr::distinct(id, treatment, WT) |>
    tidyr::expand_grid(time = seq(0, end - tau, by = tau)) |>
    dplyr::mutate(amt = mg_per_kg * WT)
  intervals <- data.frame(
    start = 0, end = end, auclast = TRUE, cmax = TRUE, cmin = TRUE, cav = TRUE
  )
  # Linear trapezoids: the default log-down rule under-integrates the steep
  # distribution phase of fast-clearing subjects on a 0.25-h grid (up to
  # about 1%), which would blur the AUC identity check below.
  PKNCA::pk.nca(PKNCA::PKNCAdata(
    PKNCA::PKNCAconc(conc, Cc ~ time | treatment + id),
    PKNCA::PKNCAdose(dose, amt ~ time | treatment + id),
    intervals = intervals,
    options = list(auc.method = "linear")
  ))
}
nca_v <- nca_run(sim_v, tau_v, 13.5, 24)
nca_m <- nca_run(sim_m, tau_m, 40, tau_m)
summary(nca_v)
#>  start end                 treatment   N   auclast       cmax       cmin
#>      0  24 Vancomycin 13.5 mg/kg q6h 200 779 [159] 45.6 [113] 20.5 [330]
#>         cav
#>  32.5 [159]
#>
#> Caption: auclast, cmax, cmin, cav: geometric mean and geometric coefficient of variation; N: number of subjects
summary(nca_m)
#>  start end              treatment   N   auclast        cmax        cmin
#>      0   8 Meropenem 40 mg/kg q8h 200 193 [102] 44.5 [74.6] 4.40 [1910]
#>         cav
#>  24.2 [102]
#>
#> Caption: auclast, cmax, cmin, cav: geometric mean and geometric coefficient of variation; N: number of subjects
At steady state the AUC over 24 h equals the daily dose divided by each subject’s clearance. Both sides use the same drawn parameters, so this checks the solve and the NCA integration, not the model.
auc_v <- as.data.frame(nca_v) |>
  dplyr::filter(PPTESTCD == "auclast") |>
  dplyr::left_join(dplyr::distinct(sim_v, id, WT, cl), by = "id") |>
  dplyr::mutate(rel = PPORRES / (4 * 13.5 * WT / cl) - 1)
auc_m <- as.data.frame(nca_m) |>
  dplyr::filter(PPTESTCD == "auclast") |>
  dplyr::left_join(dplyr::distinct(sim_m, id, WT, cl), by = "id") |>
  dplyr::mutate(rel = PPORRES / (40 * WT / cl) - 1)
c(vancomycin = max(abs(auc_v$rel)), meropenem = max(abs(auc_m$rel)))
#>   vancomycin    meropenem
#> 1.537568e-04 8.639086e-06
stopifnot(
  nrow(auc_v) == n_per_arm, nrow(auc_m) == n_per_arm,
  max(abs(auc_v$rel)) < 5e-3, max(abs(auc_m$rel)) < 5e-3
)
Comparison with the published exposures (Table 7)
Table 7 reports the individual-posterior exposure of each of the 11
PK profiles. For vancomycin these are the trough and the AUC/MIC at an
MIC of 1 mg/L, which equals AUC24 in mg.h/L. For meropenem the table
gives the concentration at half the dosing interval, Cp,t50, which is 1
h after the end of the 3-h infusion, 4 h after the start of a q8h dose.
The medians of the 11 published values are compared with the cohort
medians below. ncaComparisonTable() pools by median.
tab7 <- data.frame(
  trough = c(17.8, 12.7, 18.0, 16.1, 10.7, 13.3, 16.4, 15.3, 23.6, 14.0, 15.9),
  auc_mic = c(558.3, 306.8, 543.0, 492.8, 239.1, 339.6, 547.4, 419.7, 599.2, 394.0, 440.9),
  cp_t50 = c(20.56, 35.00, 64.50, 40.90, 18.70, 101.00, 73.00, 11.20, 28.40, 43.20, 7.30)
)
reference_v <- data.frame(
  treatment = unique(sim_v$treatment),
  auclast = stats::median(tab7$auc_mic),
  cmin = stats::median(tab7$trough)
)
cmp_v <- nlmixr2lib::ncaComparisonTable(
  nca_v, reference_v,
  by = "treatment", params = c("auclast", "cmin"),
  units = c(auclast = "mg*h/L", cmin = "mg/L")
)
knitr::kable(cmp_v)| NCA parameter | treatment | Reference | Simulated | % diff |
|---|---|---|---|---|
| Cmin (mg/L) | Vancomycin 13.5 mg/kg q6h | 15.9 | 25.7 | +61.7%* |
| AUClast (mg*h/L) | Vancomycin 13.5 mg/kg q6h | 441 | 788 | +78.7%* |
cp_t50_sim <- sim_m |>
  dplyr::filter(time == 4)
auc24_sim <- auc_v$PPORRES
target <- data.frame(
  quantity = c(
    "Meropenem Cp,t50 median (mg/L)",
    "Meropenem profiles with Cp,t50 > 8 mg/L (%)",
    "Vancomycin profiles with AUC24/MIC > 400 (%)"
  ),
  simulated = c(
    stats::median(cp_t50_sim$Cc),
    100 * mean(cp_t50_sim$Cc > 8),
    100 * mean(auc24_sim > 400)
  ),
  table7 = c(stats::median(tab7$cp_t50), 100 * 10 / 11, 100 * 7 / 11)
)
target |>
  dplyr::rename("Quantity" = quantity, "Simulated" = simulated, "Table 7" = table7) |>
knitr::kable(digits = 1)| Quantity | Simulated | Table 7 |
|---|---|---|
| Meropenem Cp,t50 median (mg/L) | 25.9 | 35.0 |
| Meropenem profiles with Cp,t50 > 8 mg/L (%) | 83.5 | 90.9 |
| Vancomycin profiles with AUC24/MIC > 400 (%) | 71.0 | 63.6 |
The deterministic typical patient at the cohort medians isolates the covariate anchoring from the cohort draw. For vancomycin, weight cancels from AUC24 because both dose and clearance are per kg, so only creatinine matters. For meropenem, clearance is flat while the dose is per kg, so weight matters.
typ_v_med <- rxode2::rxSolve(rxode2::zeroRe(mod_v), typ_ev(10, 0.22)) |>
  as.data.frame()
#> ℹ parameter labels from comments will be replaced by 'label()'
#> ℹ omega/sigma items treated as zero: 'etalcl', 'etalvc', 'etalk12', 'etalk21'
typ_auc_v <- 54 * 10 / typ_v_med$cl
typ_m_ev <- ev_m |>
  dplyr::filter(id == 1) |>
  dplyr::mutate(WT = 16, amt = ifelse(evid == 1L, 40 * 16, NA_real_), rate = amt / 3)
typ_m_sim <- rxode2::rxSolve(rxode2::zeroRe(mod_m), typ_m_ev, maxsteps = 1e6) |>
  as.data.frame()
#> ℹ parameter labels from comments will be replaced by 'label()'
#> ℹ omega/sigma items treated as zero: 'etalcl', 'etalvc', 'etalk12', 'etalk21'
typ_cp_t50 <- typ_m_sim$Cc[typ_m_sim$time == 4]
c(vanco_auc24_typical = typ_auc_v, mero_cp_t50_typical = typ_cp_t50)
#> vanco_auc24_typical mero_cp_t50_typical
#>            572.8061             30.9020

stopifnot(
  # Centre of the cohort against the published medians, as a factor. A
  # mis-transcribed clearance, volume, dose or unit (x10, or a per-kg value
  # left unscaled) moves these far outside the band. The cohort also
  # inherits the anchoring offset discussed below, so the band is a factor
  # of 2.5 rather than tight. Realised ratios at 1 / 2 / 4 / 16 threads:
  # AUC24 1.60 / 1.82 / 1.54 / 1.87, Cp,t50 0.82 / 0.78 / 0.73 / 0.80
  # (0.61 in one further render).
  abs(log(stats::median(auc24_sim) / stats::median(tab7$auc_mic))) < log(2.5),
  abs(log(stats::median(cp_t50_sim$Cc) / stats::median(tab7$cp_t50))) < log(2.5),
  # Typical patient, deterministic: 54 mg/kg/day over
  # 0.061 L/h/kg x (0.34 / 0.22) = 572.8 mg.h/L.
  abs(typ_auc_v / (54 * 0.22 / (0.061 * 0.34)) - 1) < 1e-6
)
Meropenem. The typical patient at the median weight
of 16 kg has Cp,t50 30.9 mg/L, against a published median of 35.0 mg/L.
The cohort median is 25.9 mg/L, and 84% of the cohort reach Cp,t50 >
8 mg/L against 91% in Table 7. Clearance is flat in weight while the
dose is per kg, so the lighter children in the cohort get much less drug
per unit clearance and make up the low tail; the large variability on
all four parameters (CV 72-79%) widens the spread further. Reading the
Table 5 clearance as linear in weight (0.144 L/h/kg x WT) would raise
the light children’s exposure, but it contradicts the printed
Ke = CL/Vw.
Vancomycin. The typical patient at median creatinine has AUC24 573 mg.h/L, against a published median of 441 mg.h/L, and the cohort median is 788 mg.h/L. The simulated trough is high for the same reason. Most of this offset comes from reading the Table 6 per-kg median as the reference-patient clearance (see the next section); the assumed creatinine distribution and the large clearance variability (CV 92%) move the cohort further.
The model parameters were not adjusted to match Table 7.
Assumptions and deviations
- Final-model primaries unreported. Tables 3/4 print only the NPAG search ranges of the primary variables, and Tables 5/6 provably do not rescale them (the CV% exceeds what the ranges allow). The typical values are the Table 5/6 per-kg medians anchored at each model’s reference patient, as described above.
- Meropenem clearance held flat. Table 3 has no weight term on clearance, so CL = 0.144 L/h/kg x 20.4 kg = 2.94 L/h for every weight. A child far from 20.4 kg therefore has a per-kg clearance very different from the Table 5 median (0.84 L/h/kg at 3.5 kg, 0.065 L/h/kg at 45 kg). That spread is what the printed structure implies; the per-kg reporting suggests the individual clearances did not in fact vary this widely with weight.
-
Vancomycin
0.56term taken literally. The printedCLw = CL*(wgt/15.5)*(0.56*(0.34/crea))is encoded as written, with the Table 6 median read as CLw at the reference patient. This fixes the typical clearance at the reference, and the creatinine effect is linear (exponent 1). If the 0.56 were instead an exponent lost in typesetting, (0.34/crea)^0.56, the creatinine effect would be weaker and the predicted AUC24 at median creatinine would be about 693 rather than 573 mg.h/L. -
Residual error as printed. Pmetrics gives SD = G x
(C0 + C1 x Y), combined linearly (
combined1()). The vancomycin values (G = 3, C0 = 2, C1 = 1) give an additive 6 mg/L plus a 300% proportional error, which is implausibly wide for a validated immunoassay; it is shipped as printed. The Pmetrics polynomial is in the observed concentration Y, whereas nlmixr2 evaluates it at the prediction. - Non-parametric to parametric. NPAG estimates a discrete joint density. It is represented by independent log-normal random effects whose variances reproduce the Table 5/6 CV% (omega^2 = log(CV^2 + 1)). Correlations are not reported.
- Unbound concentrations. The paper reports unbound concentrations for both drugs. Vancomycin was measured by a standard immunoassay, which ordinarily measures total drug; the paper’s description is followed.
- Virtual cohort. Weight and creatinine are drawn independently from truncated log-normal distributions matching the Table 2 median, mean and range. All subjects receive the median regimen, whereas the observed profiles came from regimens adjusted to renal function (vancomycin 10-15 mg/kg q6-12h, meropenem 20-40 mg/kg q8-12h).
- ECMO and CRRT not covariates. The ECMO mode (VA/VV) and CRRT (vancomycin 2, meropenem 4 patients) were not tested or retained; their effect is absorbed into the between-subject variability.
- Table 2 units. Serum albumin is labelled g/L but its values (median 3.5-3.55) are g/dL. Albumin was screened and not retained.