PBP7/8 adjuvant effect on beta-lactam activity against CRAB (Ho 2025)
Source:vignettes/articles/Ho_2025_betalactam_pbp78_CRAB.Rmd
Ho_2025_betalactam_pbp78_CRAB.RmdModel and source
- Citation: Ho BM, Jin J, Sanborn J, Nguyen TD, Singh N, Cheng C, Nasief NN, Carlino-MacDonald U, Russo TA, Smith NM (2025). Pharmacodynamic Evaluation of Adjuvant Targets: Low Molecular Weight PBP7/8 Effects on beta-Lactam Activity Against Carbapenem-Resistant Acinetobacter baumannii. Pharmaceuticals (Basel) 18(6):918.
- Article: https://doi.org/10.3390/ph18060918
This vignette validates the packaged in-vitro mechanism-based
pharmacodynamic model (Ho_2025_betalactam_pbp78_CRAB)
against the structural equations (supplementary Figure S5) and the final
parameter estimates (Table 1) of the paper. The model has no human
pharmacokinetic component: drug exposure is a static broth concentration
placed into each drug state at time zero, matching the
static-concentration time-kill (SCTK) data the parameters were fit to.
PKNCA-style noncompartmental validation therefore does not apply;
instead the vignette uses the checks appropriate to a mechanistic
bacterial-kill model (growth-control approach to carrying capacity,
concentration-dependent killing, a known-answer check of the PBP7/8
covariate on KC50, and combination-therapy behaviour).
The central scientific question of the paper is whether inactivating
the low-molecular-weight penicillin-binding protein PBP7/8 (the
pbpG knockout) acts as a beta-lactam adjuvant. In the model
this is a covariate on KC50: the strain indicator BACT (0 =
HUMC1 wild type, 1 = HUMC1 delta-PBP7/8 knockout) lowers the effective
KC50 of every drug.
Population
The model was fit simultaneously to SCTK data from two isogenic
clinical isolates of Acinetobacter baumannii HUMC1: the
carbapenem-resistant wild type (meropenem MIC 32 mg/L, polymyxin B MIC 2
mg/L) and its delta-PBP7/8 (pbpG) knockout. Experiments
used cation-adjusted Mueller-Hinton broth at 37 C with a starting
inoculum near 10^7 CFU/mL; viable counts were taken at 0, 1, 2, 4, 6, 8
and 24 h, with a limit of detection of 10^2 CFU/mL. Sixteen monotherapy
arms and 48 beta-lactam-plus-polymyxin-B combination arms per isolate
were modelled. The full record is available via
readModelDb(...)$population.
mod_meta <- rxode2::rxode(readModelDb("Ho_2025_betalactam_pbp78_CRAB"))
mod_meta$population[c("species", "organism", "system", "temperature",
                      "starting_inoculum", "mic_values", "duration")]
#> $species
#> [1] "in vitro (Acinetobacter baumannii HUMC1 wild type and isogenic delta-PBP7/8 knockout)"
#>
#> $organism
#> [1] "Acinetobacter baumannii HUMC1 (carbapenem-resistant clinical isolate) and its isogenic HUMC1 delta-PBP7/8 (pbpG) knockout"
#>
#> $system
#> [1] "24 h static-concentration time-kill (SCTK) assay in cation-adjusted Mueller-Hinton broth (25 mg/L Ca2+, 12.5 mg/L Mg2+), 37 C under constant shaking; viable counts at 0, 1, 2, 4, 6, 8 and 24 h"
#>
#> $temperature
#> [1] "37 C"
#>
#> $starting_inoculum
#> [1] "~10^7 CFU/mL target; the model estimated 10^6.71 CFU/mL"
#>
#> $mic_values
#> HUMC1 wild type, polymyxin B   HUMC1 wild type, meropenem
#>                     "2 mg/L"                    "32 mg/L"
#>
#> $duration
#> [1] "24 h"
Source trace
Every ini() parameter carries an in-file comment
pointing to its source in Ho 2025 Table 1; the ODE structure comes from
supplementary Figure S5 (equations 1-21). The table below collects the
provenance.
| Equation / parameter | Value | Units | Source |
|---|---|---|---|
LOGCFUmax (log10cfumax) |
8.20 | log10 CFU/mL | Table 1 |
LOGINOC (log10inoc) |
6.71 | log10 CFU/mL | Table 1 |
LOGMUTR (log10mutr) |
5.03 | – | Table 1 (MUTR = 10^-LOGMUTR, eq S5-5) |
MGTS (mgts) |
75.3 | min | Table 1 |
MGTR (mgtr) |
46.4 | min | Table 1 |
KDiv (lkdiv, FIXED) |
50 | 1/h | Bulitta 2009 framework (ref 29); not reported in Ho 2025 |
| Kmax,S (MER/IMI/ATM/CEF/PMB) | 2.09 / 1.56 / 1.12 / 1.52 / 2.98 | 1/h | Table 1 |
| Kmax,R (MER/IMI/ATM/CEF/PMB) | 1.13 / 0.83 / 0.76 / 0.89 / 1.12 | 1/h | Table 1 |
| KC50 (MER/IMI/ATM/CEF/PMB) | 47.6 / 16.8 / 78.6 / 76.0 / 1.00 | mg/L | Table 1 |
| betaKC50 (MER/IMI/ATM/CEF/PMB) | -0.80 / -1.10 / -1.02 / -0.89 / -0.50 | – | Table 1 (PBP7/8-knockout effect) |
| Hill (MER/IMI/ATM/CEF/PMB) | 0.91 / 0.88 / 0.51 / 0.90 / 0.93 | – | Table 1 |
| Residual error | additive on log10 | log10 CFU/mL | Methods (magnitude not reported) |
| Life cycle (S1/S2 + R1/R2), RepF | n/a | – | Eqs S5-12,13,14,16,18,20 |
| Hill killing, KC50 covariate | n/a | – | Eqs S5-10,11 |
Setup
mod <- rxode2::rxode(readModelDb("Ho_2025_betalactam_pbp78_CRAB"))
mod <- rxode2::zeroRe(mod) # paper reports no estimated IIV; simulate at typical value
#> Warning: No omega parameters in the model
The fast division rate KDiv (fixed at 50 /h) makes the
life-cycle system a fast transient at the start of each solve. The
default LSODA solver can fail on it; dop853 is accurate and
robust here, so every solve below passes method = "dop853".
Because the paper reports no estimated between-subject variability
(interexperimental variability was fixed at a 5% CV on each parameter),
the model is simulated at typical value.
1. Growth control: approach to carrying capacity
With no antibiotic, the total viable count grows from the inoculum (10^6.71 CFU/mL) toward the carrying capacity CFUmax = 10^8.20 CFU/mL. At 24 h the population should sit essentially at CFUmax.
g_wt <- solve_tk(0)
cat(sprintf("log10 inoculum (t=0)   = %.2f  (LOGINOC = 6.71)\n", g_wt$log_cfu[1]))
#> log10 inoculum (t=0)   = 6.71  (LOGINOC = 6.71)
cat(sprintf("log10 CFU at 24 h      = %.2f  (LOGCFUmax = 8.20)\n", tail(g_wt$log_cfu, 1)))
#> log10 CFU at 24 h      = 8.20  (LOGCFUmax = 8.20)
stopifnot(
  abs(g_wt$log_cfu[1] - 6.71) < 0.02,
  abs(tail(g_wt$log_cfu, 1) - 8.20) < 0.05
)

ggplot(g_wt, aes(time, log_cfu)) +
  geom_line(linewidth = 1) +
  geom_hline(yintercept = 8.20, linetype = "dashed", colour = "grey50") +
  annotate("text", x = 22, y = 8.20, label = "CFUmax = 8.20",
           vjust = -0.4, hjust = 1, colour = "grey30", size = 3.2) +
  scale_x_continuous(breaks = seq(0, 24, by = 4)) +
  labs(x = "Time (h)", y = expression(log[10] ~ "CFU/mL"),
       title = "Growth control (no antibiotic): approach to carrying capacity")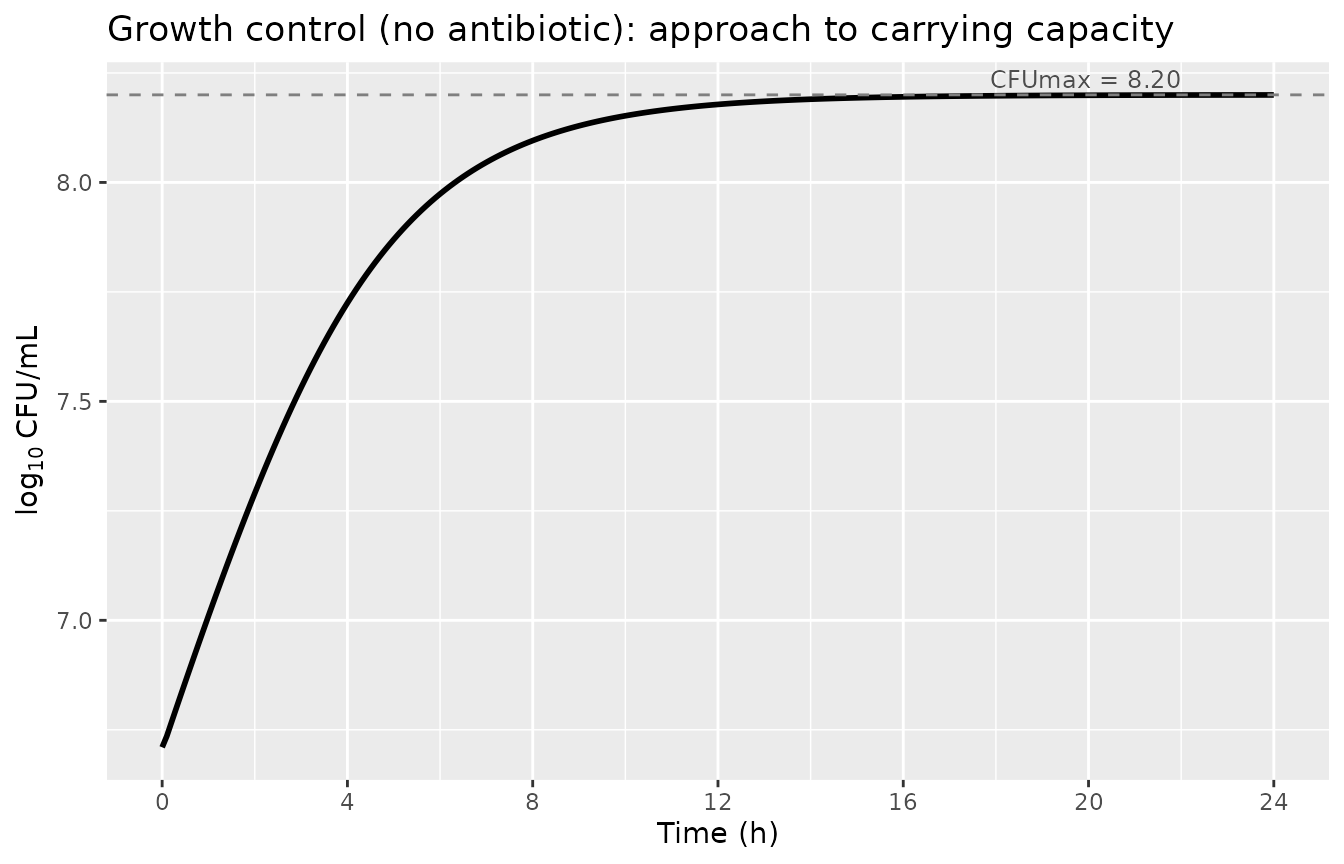
2. Concentration-dependent monotherapy killing
The paper reports concentration-dependent killing for both isolates (Results, Figure 1A). The chunk below reproduces meropenem monotherapy against the wild type at the three studied concentrations (0.5x / 1x / 2x the predicted free Cmax: 25 / 50 / 100 mg/L). Higher concentrations produce a deeper nadir.
mer_conc <- c(0, 25, 50, 100)
sim_mer <- do.call(rbind, lapply(mer_conc, function(d) {
  o <- solve_tk(0, cmt = "cmem", conc = d)
  o$conc <- d
  as.data.frame(o)[, c("time", "log_cfu", "conc")]
}))
sim_mer$conc_lab <- factor(sim_mer$conc, levels = mer_conc,
                           labels = paste0(mer_conc, " mg/L"))

# Deeper nadir with higher concentration (monotonic in dose).
nadir_by_conc <- tapply(sim_mer$log_cfu, sim_mer$conc, min)
cat("Meropenem nadir log10 CFU/mL by concentration (WT):\n")
#> Meropenem nadir log10 CFU/mL by concentration (WT):
print(round(nadir_by_conc, 2))
#>    0   25   50  100
#> 6.71 6.64 5.33 4.14
stopifnot(all(diff(nadir_by_conc) < 0)) # strictly deeper killing as dose rises

ggplot(sim_mer, aes(time, log_cfu, colour = conc_lab)) +
  geom_line(linewidth = 0.8) +
  scale_x_continuous(breaks = seq(0, 24, by = 4)) +
  labs(x = "Time (h)", y = expression(log[10] ~ "CFU/mL"), colour = "Meropenem",
       title = "Meropenem monotherapy, HUMC1 wild type",
       caption = "Concentration-dependent killing; 24 h regrowth is driven by the resistant subpopulation.")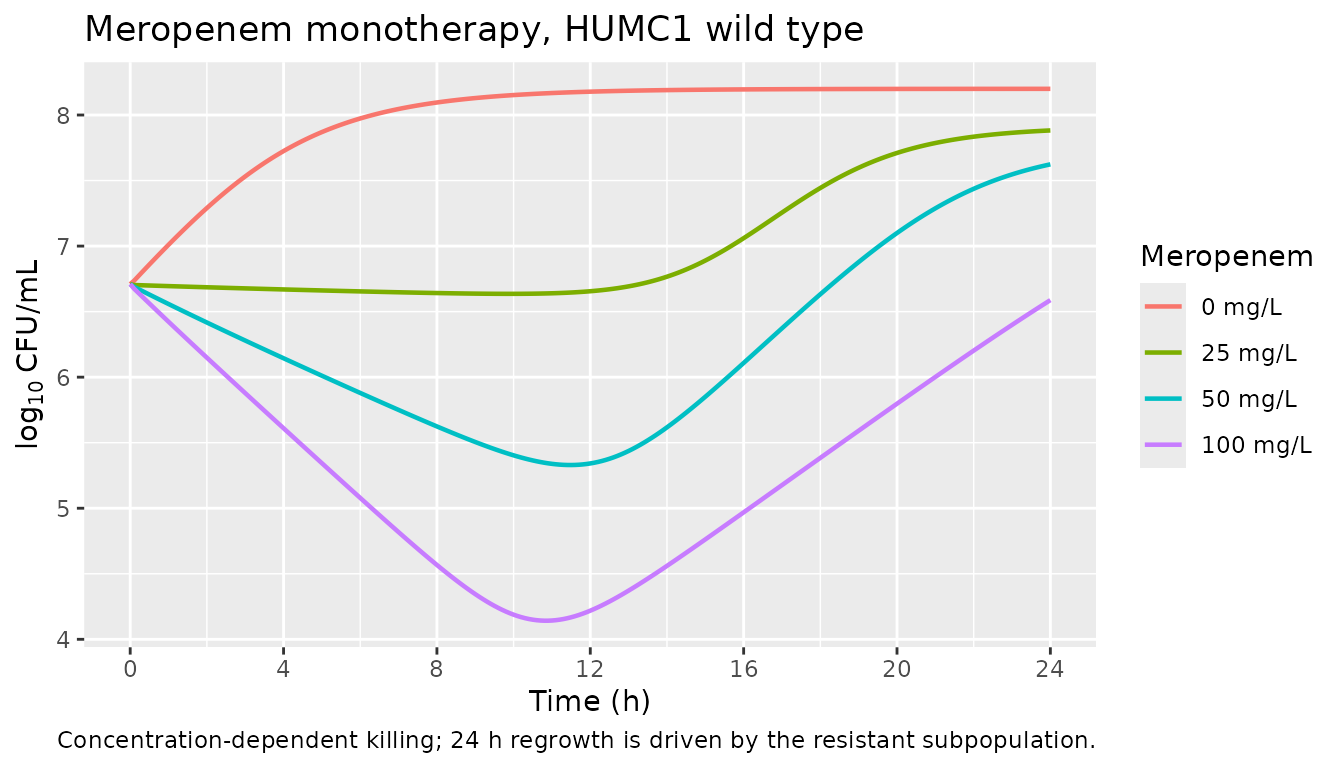
3. PBP7/8 knockout lowers KC50 (the adjuvant effect)
This is the paper’s central result. The knockout enters each drug’s
effective KC50 as kc50_eff = kc50 * exp(betaKC50 * BACT).
The chunk below reproduces the “calculated KC50 in PBP7/8 knockout”
column of Table 1 as a known-answer check.
kc50 <- c(MER = 47.6, IMI = 16.8, ATM = 78.6, CEF = 76.0, PMB = 1.00)
beta <- c(MER = -0.80, IMI = -1.10, ATM = -1.02, CEF = -0.89, PMB = -0.50)
paper_ko <- c(MER = 21.4, IMI = 6.6, ATM = 28.3, CEF = 31.2, PMB = 0.61)

pred_ko <- kc50 * exp(beta)
kc50_tab <- data.frame(
  Drug = names(kc50), KC50_WT = kc50, betaKC50 = beta,
  KC50_KO_model = round(pred_ko, 2), KC50_KO_paper = paper_ko
)
knitr::kable(kc50_tab, row.names = FALSE,
caption = "Effective KC50 under PBP7/8 knockout vs Table 1 of Ho 2025.")| Drug | KC50_WT | betaKC50 | KC50_KO_model | KC50_KO_paper |
|---|---|---|---|---|
| MER | 47.6 | -0.80 | 21.39 | 21.40 |
| IMI | 16.8 | -1.10 | 5.59 | 6.60 |
| ATM | 78.6 | -1.02 | 28.34 | 28.30 |
| CEF | 76.0 | -0.89 | 31.21 | 31.20 |
| PMB | 1.0 | -0.50 | 0.61 | 0.61 |
# Four of five drugs reproduce the paper's calculated KO KC50 exactly; imipenem
# differs (see Errata). Assert the matching four.
ok <- c("MER", "ATM", "CEF", "PMB")
stopifnot(all(abs(pred_ko[ok] - paper_ko[ok]) < 0.1))

# Average KC50 decline (mechanistic exp(beta) form).
bl <- c("MER", "IMI", "ATM", "CEF")
cat(sprintf("Average beta-lactam KC50 decline: %.1f%% (paper reports 59.7%%, using its KO column)\n",
            100 * mean(1 - exp(beta[bl]))))
#> Average beta-lactam KC50 decline: 61.2% (paper reports 59.7%, using its KO column)
cat(sprintf("Polymyxin B KC50 decline:         %.1f%% (paper reports 39.0%%)\n",
            100 * (1 - exp(beta["PMB"]))))
#> Polymyxin B KC50 decline:         39.3% (paper reports 39.0%)
The lower KC50 translates to deeper killing. Comparing wild type with knockout at the highest studied monotherapy concentration of each drug, the knockout reaches a lower nadir for every antibiotic.
drugs <- list(
  MER = c(cmt = "cmem", conc = 100),
  IMI = c(cmt = "cipm", conc = 30.6),
  ATM = c(cmt = "catm", conc = 132),
  CEF = c(cmt = "ccef", conc = 146),
  PMB = c(cmt = "cpmb", conc = 6)
)
nadir_cmp <- do.call(rbind, lapply(names(drugs), function(nm) {
  d <- drugs[[nm]]
  wt <- min(solve_tk(0, cmt = d["cmt"], conc = as.numeric(d["conc"]))$log_cfu)
  ko <- min(solve_tk(1, cmt = d["cmt"], conc = as.numeric(d["conc"]))$log_cfu)
  data.frame(Drug = nm, WT_nadir = round(wt, 2), KO_nadir = round(ko, 2),
             Extra_kill = round(wt - ko, 2))
}))
knitr::kable(nadir_cmp, row.names = FALSE,
caption = "Nadir log10 CFU/mL: PBP7/8 knockout vs wild type (deeper kill = adjuvant effect).")| Drug | WT_nadir | KO_nadir | Extra_kill |
|---|---|---|---|
| MER | 4.14 | 3.22 | 0.93 |
| IMI | 5.70 | 4.56 | 1.14 |
| ATM | 6.71 | 6.54 | 0.17 |
| CEF | 5.65 | 4.63 | 1.03 |
| PMB | 2.55 | 2.35 | 0.20 |
mer_cmp <- rbind(
  transform(as.data.frame(solve_tk(0, cmt = "cmem", conc = 100))[, c("time", "log_cfu")], Strain = "Wild type"),
  transform(as.data.frame(solve_tk(1, cmt = "cmem", conc = 100))[, c("time", "log_cfu")], Strain = "delta-PBP7/8")
)
ggplot(mer_cmp, aes(time, log_cfu, colour = Strain)) +
  geom_line(linewidth = 0.9) +
  scale_x_continuous(breaks = seq(0, 24, by = 4)) +
  labs(x = "Time (h)", y = expression(log[10] ~ "CFU/mL"), colour = NULL,
       title = "Meropenem 100 mg/L: PBP7/8 knockout deepens killing",
       caption = "The knockout lowers meropenem KC50 from 47.6 to 21.4 mg/L (Table 1).")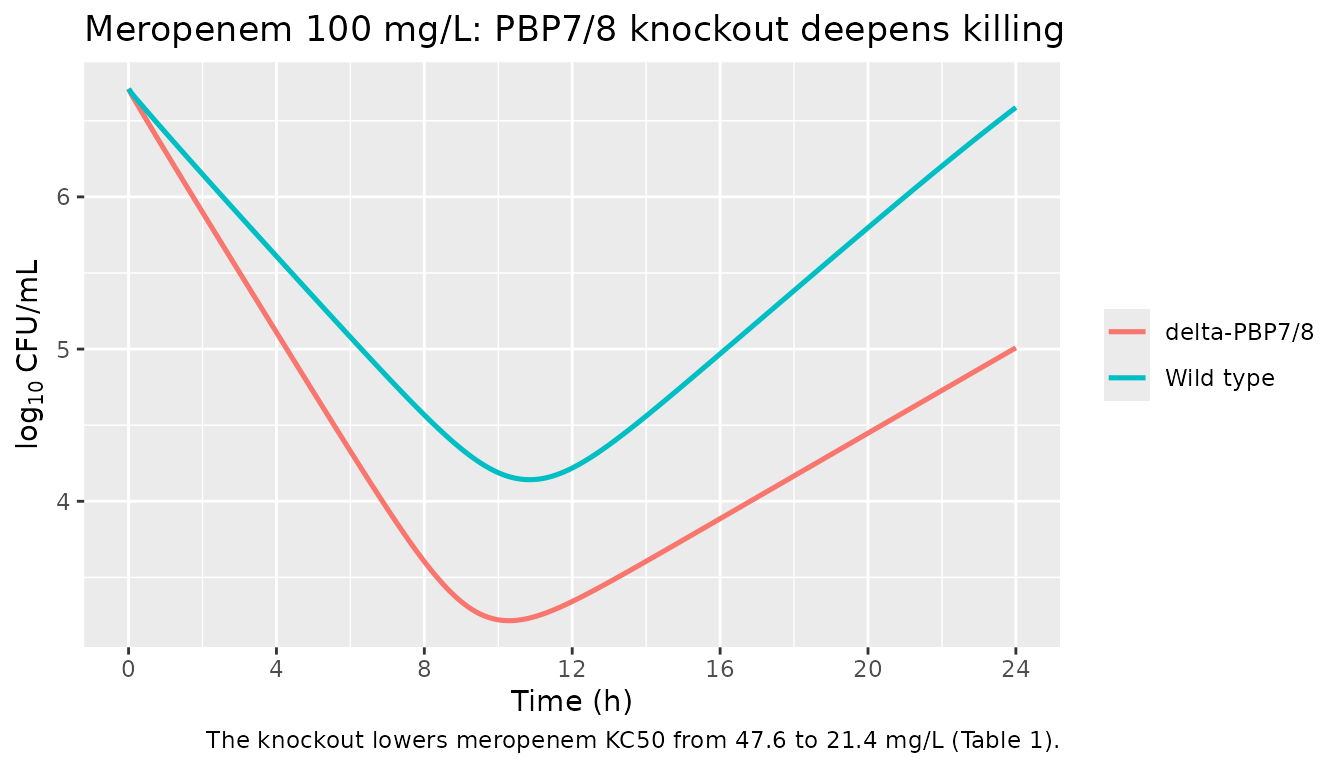
4. Combination therapy drives the population below the limit of detection
The paper reports that many beta-lactam-plus-polymyxin-B combination arms declined below the limit of quantification. Combining meropenem with polymyxin B against the knockout drives the modelled population far below the 10^2 CFU/mL limit of detection at the nadir.
ev_combo <- rxode2::et(amt = 100, cmt = "cmem", time = 0) |>
  rxode2::et(amt = 6, cmt = "cpmb", time = 0) |>
  rxode2::et(seq(0, 24, by = 0.1))
combo <- rxode2::rxSolve(mod, events = ev_combo, params = c(BACT = 1), method = "dop853")
mer_only <- solve_tk(1, cmt = "cmem", conc = 100)
cat(sprintf("KO meropenem 100 alone, nadir     = %.2f log10 CFU/mL\n", min(mer_only$log_cfu)))
#> KO meropenem 100 alone, nadir     = 3.22 log10 CFU/mL
cat(sprintf("KO meropenem 100 + polymyxin B 6  = %.2f log10 CFU/mL (nadir)\n", min(combo$log_cfu)))
#> KO meropenem 100 + polymyxin B 6  = -5.30 log10 CFU/mL (nadir)
stopifnot(min(combo$log_cfu) < min(mer_only$log_cfu)) # combination kills more
stopifnot(min(combo$log_cfu) < 2)                     # below 10^2 CFU/mL LOD
Assumptions and deviations
-
Fast division rate
KDiv(not reported). The ODEs (supplementary equations S5-14/16/18/20) use a fast state-2 -> state-1 division rateKDiv, but it is not listed in Table 1. It is a fixed structural constant of the Bulitta 2009 life-cycle framework that Ho 2025 cites (reference 29), where the fast doubling step is fixed to 50 /h as not rate-limiting. The same convention is used in this package byBulitta_2009_ceftazidimeand theMahadevan_2026siblings. The model dynamics are governed by the slow generation step (60 / MGT), so the result is insensitive to the exactKDivvalue; it is encoded aslkdiv <- fixed(log(50)). -
Imipenem calculated KO KC50. Table 1 lists the
“calculated KC50 of imipenem in PBP7/8 knockout” as 6.6 mg/L, but
16.8 * exp(-1.10) = 5.59. The other four drugs reproduce their calculated KO KC50 exactly fromKC50 * exp(betaKC50), so the 6.6 appears to be a transcription slip in the table’s derived column. The model uses the estimated base KC50 (16.8) and betaKC50 (-1.10), giving an effective KO KC50 of 5.59 mg/L. The paper’s reported 59.7% average beta-lactam KC50 decline is computed from its KO column (including the 6.6); the mechanisticexp(betaKC50)form gives 61.2%. -
Residual error magnitude. The paper states an
additive residual error on the log10 scale (equivalent to proportional
error on the natural scale) but does not report its value in Table 1, so
addSdis encoded asfixed(0)and the model is intended for typical-value simulation. The reported interexperimental variability (a fixed 5% CV on every parameter) is likewise not carried as estimated IIV. -
Static-concentration scope. The packaged model
represents the SCTK fit: the drug states are held constant
(
d/dt = 0). The paper additionally used this PD model with external hollow-fiber (HFIM) pharmacokinetics to simulate dynamic regimens (Figures 2 and 3); reproducing those requires an external PK layer supplying time-varying concentrations and is outside the scope of the packaged static-concentration model. -
Solver. The fast division transient can defeat the
default LSODA solver;
dop853is used throughout this vignette. -
BACTcoding. The isogenic strain pair is carried in theBACTstrain indicator (0 = wild type, 1 = delta-PBP7/8 knockout); here it feeds a covariate-effect coefficient on KC50 rather than switching a whole parameter set, so it must be coded 0/1 with 0 as the wild-type reference.