GHB red-cell transport and blood/plasma partitioning (Morse 2012)
Source:vignettes/articles/Morse_2012_ghb_rbc_invitro.Rmd
Morse_2012_ghb_rbc_invitro.RmdModel and source
mod <- rxode2::rxode(readModelDb("Morse_2012_ghb_rbc_invitro"))- Citation: Morse BL, Felmlee MA, Morris ME. gamma-Hydroxybutyrate blood/plasma partitioning: effect of physiologic pH on transport by monocarboxylate transporters. Drug Metab Dispos. 2012;40(1):64-69. doi:10.1124/dmd.111.041285. PMID: 21976619. PMCID: PMC3250051. Structural equations: eq. 1 (saturable plus linear uptake) and eq. 2 (sigmoidal Imax inhibition by L-lactate), Materials and Methods, ‘Data and Statistical Analysis’, p. 66. Parameter values for eq. 1 at both pH values and the L-lactate IC50: Results, ‘In Vitro GHB Uptake’, p. 67. The Imax and Hill coefficient of eq. 2 are reported nowhere in the paper and were recovered by digitising the fitted curve of Figure 5; see the vignette ‘Assumptions and deviations’. No supplementary material accompanies this article and no erratum was located.
- Article: https://doi.org/10.1124/dmd.111.041285
- PubMed Central open-access copy: https://pmc.ncbi.nlm.nih.gov/articles/PMC3250051/
gamma-Hydroxybutyrate (GHB) is a drug of abuse, and also a licensed medicine (sodium oxybate) for narcolepsy with cataplexy. It shows dose-dependent kinetics that earlier work in this laboratory attributed to saturable, monocarboxylate-transporter-mediated (MCT-mediated) processes: saturable oral absorption and saturable renal reabsorption. MCT1 is also the principal monocarboxylate transporter of the red blood cell (RBC) membrane, so the obvious expectation is that GHB distribution into red cells should saturate too, and should be inhibitable by the competing MCT substrate L-lactate.
The paper reports that it does neither. In vivo, blood/plasma partitioning of GHB in rats was linear across 400-1500 mg/kg with a blood/plasma ratio of 0.75, and co-administered L-lactate left that ratio unchanged (0.76) even though the same L-lactate dose significantly raised GHB renal and total clearance. The in vitro work in this model file is what explains the dissociation, and it turns on pH.
Structure
The model is the paper’s equation 1: total unidirectional uptake into erythrocytes is the sum of two parallel arms,
uptake = vmax_rbc * C / (km_rbc + C) + kinf_rbc * Cwhere C is the extracellular (bath) GHB concentration in
mmol/L.
- The saturable arm is MCT1-mediated. It was isolated experimentally with 1 mM p-chloromercuribenzene sulfonate (pCMBS), which abolished all saturable transport.
- The linear arm is carried by the anion exchanger band 3 (AE1) together with passive diffusion. It was isolated with 10 uM 4,4’-diisothiocyanostilbene-2,2’-disulfonate (DIDS).
Both arms were fitted independently at two buffer pH values, and the
model switches the whole parameter set on PH_MEDIUM rather
than interpolating, because only pH 7.4 and pH 6.5 were studied.
The paper’s equation 2 adds a sigmoidal inhibition of uptake by the
competing substrate L-lactate, driven by the LACT
covariate:
inhib = 1 - imax_lact * LACT^hill_lact / (ic50_lact^hill_lact + LACT^hill_lact)This is an initial-rate law throughout. Uptake was
measured over 5 s (pH 6.5) and 15 s (pH 7.4) windows chosen to sit in
the linear range, so there is no efflux term, no trans-stimulation and
no approach to equilibrium. The authors say explicitly that
equilibrium-exchange km and vmax would be
higher than these unidirectional values.
Population
pop <- readModelDb("Morse_2012_ghb_rbc_invitro")Species: ****. Concentration range studied: .
Two features of the assay conditions matter when reading the parameter values:
- Experiments were run at room temperature, not 37 C,
because transport is too fast to sample at physiologic temperature.
kmandIC50for MCT substrates rise with temperature, so the in vivo values are expected to exceed these. - Erythrocytes were washed three times before use specifically to strip extracellular lactate, which would otherwise compete in the control arm.
Source trace
Every value in ini(), with the location it came
from.
| Parameter | Value | Units | Source |
|---|---|---|---|
| lvmax_rbc_ph74 | 20.9 | nmol/mg protein/min | Results, ‘In Vitro GHB Uptake’, p. 67 |
| lkm_rbc_ph74 | 17.0 | mmol/L | Results, ‘In Vitro GHB Uptake’, p. 67 |
| lkinf_rbc_ph74 | 0.24 | uL/mg protein/min | Results, ‘In Vitro GHB Uptake’, p. 67 |
| lvmax_rbc_ph65 | 5.3 | nmol/mg protein/min | Results, ‘In Vitro GHB Uptake’, p. 67 |
| lkm_rbc_ph65 | 2.2 | mmol/L | Results, ‘In Vitro GHB Uptake’, p. 67 |
| lkinf_rbc_ph65 | 0.11 | uL/mg protein/min | Results, ‘In Vitro GHB Uptake’, p. 67 |
| lic50_lact | 19.1 | mmol/L | Results, ‘In Vitro GHB Uptake’, p. 67 |
| limax_lact | 0.613 | unitless | FIGURE-DERIVED: digitised from the Figure 5 fitted curve |
| lhill_lact | 1.53 | unitless | FIGURE-DERIVED: digitised from the Figure 5 fitted curve |
| addSd | 0 (fixed) | nmol/mg protein | Not reported; no residual error model is given |
Structural equations: equation 1 and equation 2, Materials and Methods, ‘Data and Statistical Analysis’, p. 66.
Dimensional analysis
The state rbc_ghb is normalised per mg of red-cell
protein, which is the normalisation the assay reports, so the units
differ from the concentration units usual for the
rbc_<analyte> family. Each ODE term must still
resolve to nmol / mg protein / min.
| Term | Units | Resolves_to |
|---|---|---|
| vmax_rbc * C / (km_rbc + C) | (nmol/mg/min) * (mmol/L) / (mmol/L) | nmol/mg/min |
| kinf_rbc * C | (uL/mg/min) * (mmol/L = nmol/uL) | nmol/mg/min |
| inhib | dimensionless | - |
| d/dt(rbc_ghb) | nmol/mg protein per min | nmol/mg/min |
| d/dt(ghb) | 0 (bath held constant over the initial-rate window) | mmol/L/min |
The linear arm is the one worth checking by hand:
kinf_rbc carries volume per mass per time, and it
multiplies a concentration, so the identity
1 mmol/L = 1 nmol/uL is what makes uL/mg/min
times mmol/L come out as nmol/mg/min.
Simulation helper
The model has no between-subject variability, so each “subject” here
is one experimental condition rather than one animal. There are no etas
to drop, so zeroRe() is not used.
# One id per bath concentration; dose into `ghb` sets the bath concentration in
# mmol/L, and observations are taken on the ODE state `rbc_ghb`.
solve_uptake <- function(conc, ph, lact = 0) {
  ev <- do.call(rbind, lapply(seq_along(conc), function(i) {
    data.frame(
      id   = i,
      time = c(0, 1),
      amt  = c(conc[i], NA_real_),
      evid = c(1L, 0L),
      cmt  = c("ghb", "rbc_ghb"),
      PH_MEDIUM = ph,
      LACT = lact
    )
  }))
  s <- suppressWarnings(rxode2::rxSolve(mod, ev, returnType = "data.frame"))
  s <- s[s$time == 1, , drop = FALSE]
  # rxSolve omits the id column entirely when only one subject was solved, so
  # recover the mapping back to the input concentrations defensively.
  ids <- if (is.null(s$id)) rep(1L, nrow(s)) else as.integer(as.character(s$id))
  s$conc <- conc[ids]
  s
}
Because the bath is held constant, uptake is constant in
time and rbc_ghb(t) = uptake * t exactly. Solving to
t = 1 min therefore reads the published uptake rate
straight off the state. That identity is the first thing to confirm.
chk <- solve_uptake(c(3, 15, 75, 150), ph = 7.4)
stopifnot(isTRUE(all.equal(chk$rbc_ghb, chk$uptake, tolerance = 1e-8)))
A second identity: with LACT = 0 the inhibition factor
must be exactly 1, so equation 2 collapses to equation 1.
Validation 1: Table 2, the fraction of uptake that is MCT-mediated
This is the sharpest check the paper affords, because Table 2 is a table of observed percentages that were not used to fit equation 1. It reports the mean percentage of total GHB uptake abolished by 1 mM pCMBS at pH 7.4 – that is, the fraction carried by MCT1. Under the model that fraction is
fmct = (vmax_rbc * C / (km_rbc + C)) / (vmax_rbc * C / (km_rbc + C) + kinf_rbc * C)which the model exposes as the output fmct.
tab2 <- solve_uptake(c(3, 15, 75, 150), ph = 7.4)
cmp <- data.frame(
  ghb_mM     = tab2$conc,
  model_pct  = round(100 * tab2$fmct, 1),
  paper_pct  = c(76.5, 70.2, 52.1, 27.8)
)
cmp$diff_pp <- round(cmp$model_pct - cmp$paper_pct, 1)

cmp %>%
  dplyr::rename(
    "GHB (mM)"                = ghb_mM,
    "Model % MCT-mediated"    = model_pct,
    "Paper Table 2 (%)"       = paper_pct,
    "Difference (pp)"         = diff_pp
  ) %>%
knitr::kable(caption = "Percentage of total GHB uptake that is MCT-mediated at pH 7.4, model versus the observed values of Table 2.")| GHB (mM) | Model % MCT-mediated | Paper Table 2 (%) | Difference (pp) |
|---|---|---|---|
| 3 | 81.3 | 76.5 | 4.8 |
| 15 | 73.1 | 70.2 | 2.9 |
| 75 | 48.6 | 52.1 | -3.5 |
| 150 | 34.3 | 27.8 | 6.5 |
The model reproduces the direction, the magnitude and the strong monotone decline of the MCT-mediated fraction with concentration: MCT1 carries roughly three quarters of red-cell GHB transport at 3 mM and only about a third at 150 mM, because the saturable arm plateaus while the band 3 arm keeps growing. Agreement is within 7 percentage points at every concentration.
stopifnot(
  # Model versus OBSERVED means, so this is a genuine out-of-sample check on a
  # three-parameter fit, not an identity. Headroom over the observed worst case
  # of 6.5 pp.
  max(abs(cmp$diff_pp)) < 10,
  # The scientific claim of the table is the monotone decline; that must hold
  # exactly.
  all(diff(cmp$model_pct) < 0),
  # Results text: at concentrations relevant in vivo, pCMBS inhibited "~75%"
  # of total transport.
  abs(cmp$model_pct[1] - 76.5) < 6
)
Validation 2: Figure 4, concentration-dependent uptake at both pH values
Figure 4 plots total transport (solid line), transport under pCMBS (dashed, the linear band 3 arm alone) and simulated MCT-mediated transport (dotted) for panel A at pH 7.4 and panel B at pH 6.5.
grid <- c(seq(0, 20, by = 0.5), seq(22, 150, by = 2))
fig4 <- dplyr::bind_rows(
  solve_uptake(grid, ph = 7.4) %>% dplyr::mutate(panel = "A: pH 7.4"),
  solve_uptake(grid, ph = 6.5) %>% dplyr::mutate(panel = "B: pH 6.5")
)

fig4_long <- fig4 %>%
  dplyr::select(conc, panel, Total = uptake,
                `pCMBS (band 3 + passive)` = uptake_pcmbs,
                `MCT1-mediated` = uptake_dids) %>%
  tidyr::pivot_longer(-c(conc, panel), names_to = "Arm", values_to = "uptake")

ggplot2::ggplot(fig4_long, ggplot2::aes(conc, uptake, colour = Arm, linetype = Arm)) +
  ggplot2::geom_line(linewidth = 0.7) +
  ggplot2::facet_wrap(~panel, scales = "free_y") +
  ggplot2::labs(x = "[GHB] (mM)", y = "Uptake (nmol/mg protein/min)") +
  ggplot2::theme_bw() +
  ggplot2::theme(legend.position = "bottom")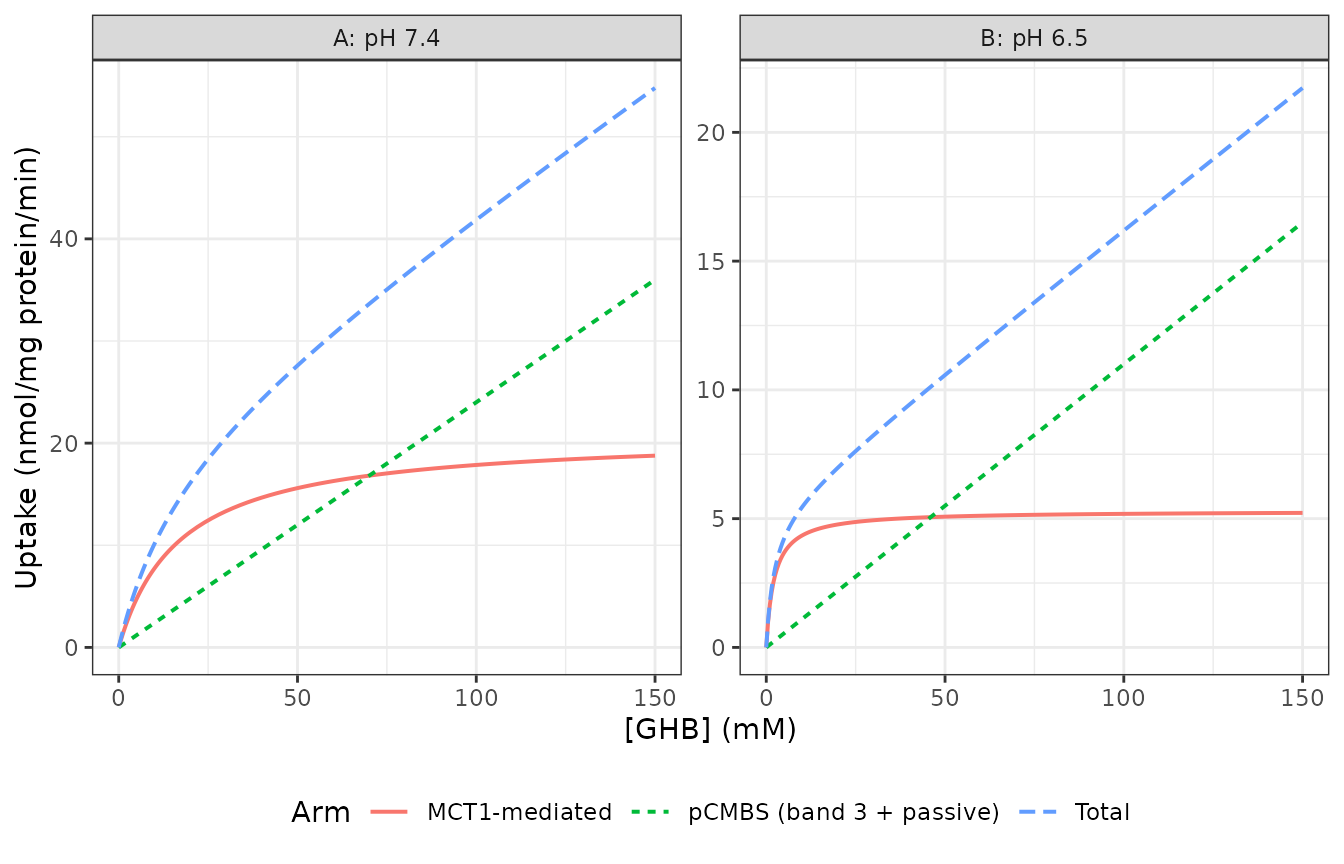
Replicates Figure 4 of Morse 2012. Panel A is pH 7.4, panel B is pH 6.5. Total transport, the pCMBS-inhibited (band 3 plus passive) arm, and the MCT1-mediated arm.
The published panels can be checked at their right-hand edge, where the three curves are well separated.
ends <- dplyr::bind_rows(
  solve_uptake(150, ph = 7.4) %>% dplyr::mutate(pH = 7.4),
  solve_uptake(150, ph = 6.5) %>% dplyr::mutate(pH = 6.5)
)
data.frame(
  pH        = ends$pH,
  Total     = round(ends$uptake, 1),
  Linear    = round(ends$uptake_pcmbs, 1),
  MCT1      = round(ends$uptake_dids, 1)
) %>%
  dplyr::rename(
    "Total (nmol/mg/min)"  = Total,
    "Band 3 arm"           = Linear,
    "MCT1 arm"             = MCT1
  ) %>%
knitr::kable(caption = "Model values at the right-hand edge of Figure 4 (150 mM GHB).")| pH | Total (nmol/mg/min) | Band 3 arm | MCT1 arm |
|---|---|---|---|
| 7.4 | 54.8 | 36.0 | 18.8 |
| 6.5 | 21.7 | 16.5 | 5.2 |
mct_plateau_74 <- solve_uptake(1e6, ph = 7.4)$uptake_dids
mct_plateau_65 <- solve_uptake(1e6, ph = 6.5)$uptake_dids
stopifnot(
  # The MCT1 arm must saturate at exactly vmax, which is the parameter the
  # dotted line of each panel is drawn from.
  abs(mct_plateau_74 - 20.9) < 0.01,
  abs(mct_plateau_65 - 5.3) < 0.01,
  # Panel B, digitised: total 21.5, band 3 arm 16.5, MCT1 plateau near 5 at
  # 150 mM. Panel B is the cleaner panel to check because its three curves are
  # widely separated.
  abs(ends$uptake[ends$pH == 6.5] - 21.7) < 1,
  abs(ends$uptake_pcmbs[ends$pH == 6.5] - 16.5) < 1,
  # Half-saturation must occur AT km in each panel: this is what the near
  # 8-fold pH shift in affinity actually means.
  abs(solve_uptake(17.0, ph = 7.4)$uptake_dids - 20.9 / 2) < 1e-8,
  abs(solve_uptake(2.2, ph = 6.5)$uptake_dids - 5.3 / 2) < 1e-8
)
The pH effect is the point of the paper, so it is worth stating numerically: at a GHB concentration of 5 mM, well inside the therapeutic range, MCT1 is running at a very different fraction of capacity at the two pH values.
p74 <- solve_uptake(5, ph = 7.4)
p65 <- solve_uptake(5, ph = 6.5)
sat <- c(`pH 7.4` = p74$uptake_dids / 20.9, `pH 6.5` = p65$uptake_dids / 5.3)
round(100 * sat, 1)
#> pH 7.4 pH 6.5
#>   22.7   69.4
stopifnot(
  # At 5 mM the transporter is only ~23% saturated at blood pH but ~69%
  # saturated at the more acidic pH: acidification raises affinity sharply.
  sat[["pH 6.5"]] > 2 * sat[["pH 7.4"]]
)
Validation 3: Figure 5, inhibition by L-lactate
Figure 5 titrates L-lactate against uptake of 10 mM GHB at pH 7.4. The model’s inhibition factor is dimensionless, so to overlay it on the published axis it is scaled to the control uptake read from the figure itself (7.34 nmol/mg/min); see ‘Assumptions and deviations’ below for why the eq. 2 control is not the eq. 1 prediction.
fig5_control <- 7.34  # digitised from the Figure 5 fitted curve at LACT = 0
lact_grid <- c(seq(0, 20, by = 0.25), seq(21, 175, by = 1))
fig5 <- do.call(rbind, lapply(lact_grid, function(L) {
  s <- solve_uptake(10, ph = 7.4, lact = L)
  data.frame(LACT = L, rel = s$uptake, stringsAsFactors = FALSE)
}))
fig5$rel <- fig5$rel / fig5$rel[fig5$LACT == 0]
fig5$scaled <- fig5$rel * fig5_control

ggplot2::ggplot(fig5, ggplot2::aes(LACT, scaled)) +
  ggplot2::annotate("rect", xmin = 2, xmax = 5, ymin = -Inf, ymax = Inf,
                    alpha = 0.15, fill = "steelblue") +
  ggplot2::geom_line(linewidth = 0.7) +
  ggplot2::geom_vline(xintercept = 19.1, linetype = "dashed", colour = "grey40") +
  ggplot2::ylim(0, 10) +
  ggplot2::labs(x = "[L-lactate] (mM)", y = "Uptake (nmol/mg/min)") +
  ggplot2::theme_bw()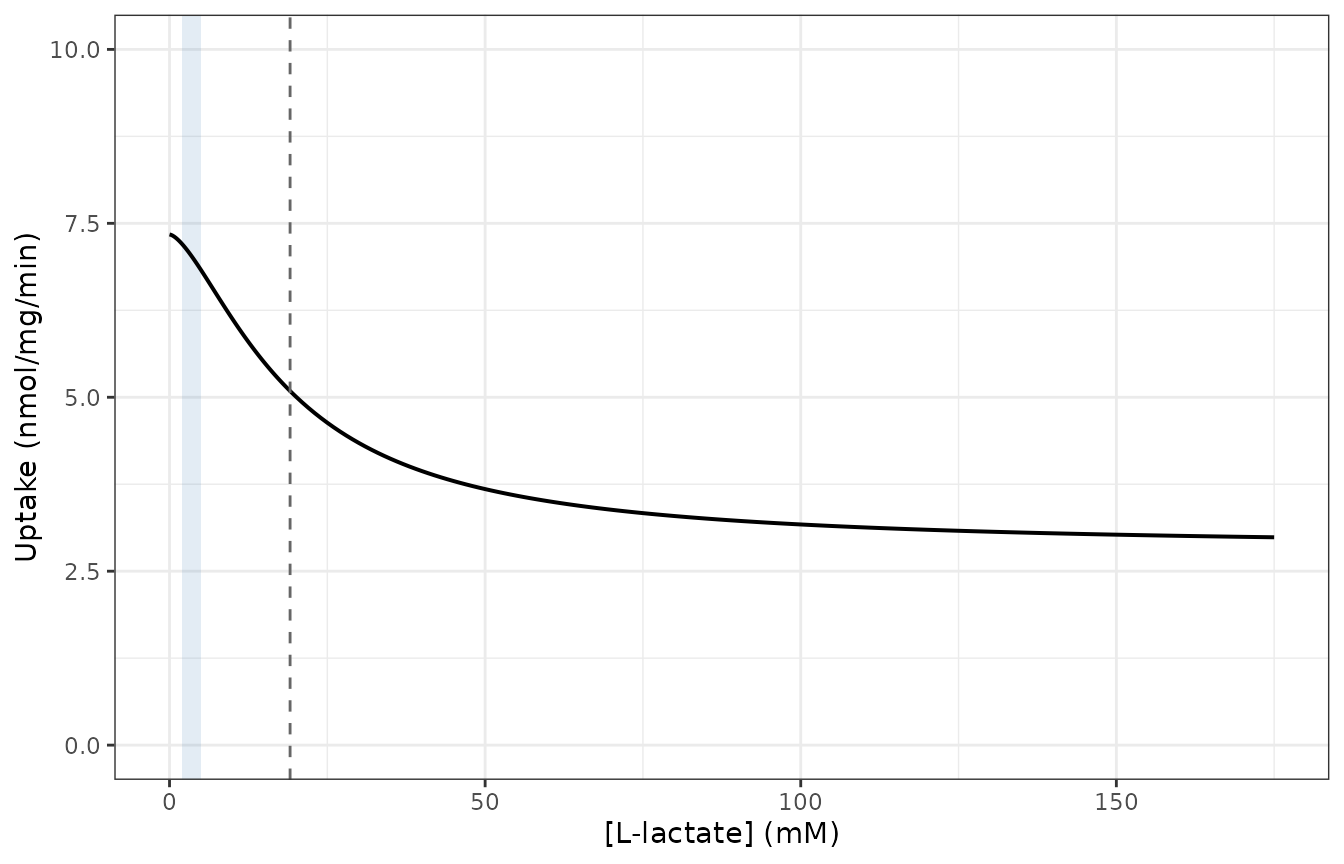
Replicates Figure 5 of Morse 2012: inhibition of 10 mM GHB uptake at pH 7.4 by L-lactate. The shaded band marks the 2-5 mM plasma L-lactate actually reached in vivo (Figure 3).
# Solve at the exact concentration asked for rather than snapping to the
# plotting grid, so the IC50 identity below is tested exactly.
rel_at <- function(L) solve_uptake(10, ph = 7.4, lact = L)$uptake / free$uptake

stopifnot(
  # Definition of IC50: at LACT = IC50 exactly half of the maximal inhibition
  # has been expressed. This is an identity, so it holds to machine precision.
  abs((1 - rel_at(19.1)) - 0.613 / 2) < 1e-10,
  # Results text: "No significant inhibition was observed at L-lactate
  # concentrations at or below 5 mM." At the top of the in vivo range the model
  # loses less than a tenth of uptake.
  rel_at(5) > 0.90,
  # The maximum attainable inhibition is imax; the curve approaches
  # 1 - imax from above and must never cross it.
  min(fig5$rel) > 1 - 0.613,
  all(diff(fig5$rel) <= 0)
)
The last assertion is the one that carries the paper’s conclusion. Across the 2-5 mM plasma L-lactate the rats actually reached (Figure 3 of the source), the model predicts that GHB red-cell uptake is inhibited by less than 10 per cent, which is why an L-lactate dose large enough to raise GHB renal clearance significantly left the blood/plasma ratio untouched.
The in vivo result this explains
The in vivo arm of the paper is a linear regression of blood against plasma GHB concentrations, not a compartmental model, so it is not part of this model file. Its numbers are the context for everything above (source Table 1):
| Regimen | B/P ratio |
|---|---|
| GHB 400-1500 mg/kg (pooled, n = 74 rats) | 0.75 |
| GHB 600 or 1500 mg/kg + L-lactate (pooled) | 0.76 |
| GHB 1500 mg/kg (serial sampling, n = 4-5) | 0.74 (SD 0.07) |
| GHB 1500 mg/kg + L-lactate (serial sampling) | 0.75 (SD 0.07) |
A blood/plasma ratio below 1 is what a red cell that takes up GHB less avidly than plasma retains it looks like. But the in vitro model does not predict that this ratio should stay constant, and it is worth being explicit about that, because it is the one place where the model and the in vivo result disagree – a disagreement the authors themselves raise in the Discussion.
Total uptake per unit concentration is the in vitro analogue of a partition ratio. Under the model it falls steadily with concentration, because the MCT1 arm plateaus while only the band 3 arm keeps scaling.
lin <- solve_uptake(c(1, 5, 10, 20, 40, 80, 150), ph = 7.4)
ratio <- lin$uptake / lin$conc
data.frame(`GHB (mM)` = lin$conc, `Uptake per mM` = round(ratio, 3),
           check.names = FALSE)
#>   GHB (mM) Uptake per mM
#> 1        1         1.401
#> 2        5         1.190
#> 3       10         1.014
#> 4       20         0.805
#> 5       40         0.607
#> 6       80         0.455
#> 7      150         0.365
stopifnot(
  # The in vitro model saturates: uptake per unit concentration falls
  # monotonically, and by more than 3-fold across 1-150 mM.
  all(diff(ratio) < 0),
  ratio[1] / ratio[length(ratio)] > 3
)
In vivo, blood/plasma partitioning was instead
linear across the whole 400-1500 mg/kg range, at plasma
concentrations the paper states exceeded the 17.0 mM km.
The model reproduces the paper’s stated puzzle rather than dissolving
it: on unidirectional initial-rate kinetics alone, red-cell uptake
should have visibly saturated in vivo and did not. Morse and colleagues
attribute the difference to bidirectional transport and
trans-stimulation – effects that by construction cannot appear in a
short unidirectional uptake assay, and which this model therefore does
not contain. See Errata.
What the in vitro parameters do explain cleanly is the other
half of the result: the absence of any L-lactate effect on the
blood/plasma ratio, because the L-lactate IC50 of 19.1 mM
sits far above the 2-5 mM the rats reached.
Assumptions and deviations
-
imax_lactandhill_lactare figure-derived, not published. Equation 2 has three parameters and the paper prints onlyIC50= 19.1 mM. Both others were recovered by digitising the fitted solid line of Figure 5 at 300 dpi, calibrating the axes on the plot frame and on the positions of the axis labels, and least-squares fitting equation 2 to 650 traced curve points withIC50held at the published value. The fit is essentially exact – RMSE 0.004 nmol/mg/min, below the 0.014-unit resolution of one pixel. Two independent checks support the recovery: re-fitting withIC50free returns 19.7 mM against the published 19.1 mM, a 3 per cent recovery of a number that was not used in the fit; and constraining the Hill coefficient to 1 degrades the fit twentyfold (RMSE 0.082), so the sigmoidicity is a real feature of the published curve rather than an artefact of tracing. -
The equation 2 “Control” is not carried as a model
parameter. As published, equation 2 multiplies a fitted
Controluptake, which the digitisation puts at 7.34 nmol/mg/min. Equation 1 predicts 10.14 nmol/mg/min for 10 mM GHB at pH 7.4. The two are different because they come from different red-cell preparations on different days – Figure 5 is from two experiments, Figure 4 from three. Rather than carry two contradictory absolute predictions in one model, the inhibition is encoded as a dimensionless multiplier on the equation 1 uptake, which reproduces the shape of Figure 5 exactly and leaves the absolute scale to equation 1. The vignette scales to 7.34 only to overlay the published axis. -
The inhibition arm is applied outside the condition it was
fitted in. L-lactate was titrated at one GHB concentration (10
mM) and one pH (7.4). The model applies the factor multiplicatively to
total uptake at any GHB concentration, which is the form of equation 2
but is an extrapolation. It is deliberately not gated
on
PH_MEDIUM, because no titration was run at pH 6.5; simulating pH 6.5 with non-zeroLACTis an extrapolation and should be reported as one. Mechanistically the factor is also applied to total uptake rather than to the MCT1 arm alone, because that is how the authors wrote and fitted equation 2; note that the maximal inhibition of 0.613 is less than the MCT-mediated fraction at 10 mM (0.76), so equation 2 does not imply complete blockade of MCT1. -
No residual error and no between-subject
variability. The in vitro data were fitted by nonlinear
regression in WinNonlin; no residual error model, sigma, standard error
or confidence interval is reported for any parameter.
addSdis held atfixed(0)rather than invented. Figures 4 and 5 plot mean plus or minus S.E.M. of triplicate determinations. -
pH is a switch, not a slope. Only two levels were
characterised, and the paper shares no parameter between them, so
PH_MEDIUMdispatches on the midpoint 6.95 rather than interpolating. -
The observation is the accumulated state, not the
rate. The assay datum is radiolabel accumulated over a fixed
short window, which the paper divides by that window to report a rate;
the model therefore attaches the error model to
rbc_ghband exposesuptakeas its derivative. Because the bath is constant the two are related exactly byrbc_ghb(t) = uptake * t, verified above. -
Units follow the assay, not the
rbc_<analyte>family default. The state holds nmol per mg of red-cell protein rather than a concentration, because that is what the assay reports and the paper supplies no protein-per-cell-volume factor with which to convert.
Errata and unresolved discrepancies
-
Figure 4A’s fitted line is not quite consistent with the
printed
P. The Results text givesP= 0.24 uL/mg/min at pH 7.4. Digitising the dashed (pCMBS) line of Figure 4A – which the caption identifies as the fitted linear arm – gives a slope through the origin of 0.216 uL/mg/min, read consistently at three well-separated points (0.2159 at 110 mM, 0.2156 at 130 mM, 0.2157 at 140 mM), about 11 per cent below the printed value. The same digitisation method recovered the published Figure 5IC50to within 3 per cent, so the gap is larger than the method’s demonstrated error. The printed value 0.24 is what this model carries, for two reasons: the text states it as the fitted result, and the printed Table 2 percentages – which are observed data, not a redrawn line – are fitted better by 0.24 than by 0.216 (sum of squared deviations 86 versus 146 across the four rows). The discrepancy is recorded here rather than resolved; it affects only the minority transport arm, and the corresponding pH 6.5 panel shows no such problem. - No supplementary material accompanies this article, and no erratum or corrigendum was located for it.
-
kmat pH 7.4 exceeds the concentrations at which partitioning was observed to stay linear. The authors flag this themselves: plasma GHB concentrations reached in vivo were greater than the 17.0 mMkm, so saturation of red-cell uptake should have been visible and was not. They offer bidirectional transport and trans-stimulation as the likely explanation – effects a unidirectional uptake assay cannot see, and which this model therefore does not contain. Treat the model as a description of unidirectional initial-rate uptake, not as a complete account of in vivo red-cell distribution. -
Room-temperature parameters. All in vitro values
were measured below 37 C because transport is too rapid to sample
otherwise. The paper argues that the true in vivo
kmandIC50are therefore higher than the values carried here, which strengthens rather than weakens its conclusion that neither saturation nor L-lactate inhibition occurs at the red-cell membrane in vivo. -
The in vivo blood/plasma ratio is not in the model.
It is a linear regression slope between two measured concentrations,
with no ODE structure; it is recorded in the model description and
reproduced in the table above, but it is not an
ini()parameter.
Session information
sessionInfo()
#> R version 4.6.1 (2026-06-24)
#> Platform: x86_64-pc-linux-gnu
#> Running under: Ubuntu 24.04.5 LTS
#>
#> Matrix products: default
#> BLAS:   /usr/lib/x86_64-linux-gnu/openblas-pthread/libblas.so.3
#> LAPACK: /usr/lib/x86_64-linux-gnu/openblas-pthread/libopenblasp-r0.3.26.so;  LAPACK version 3.12.0
#>
#> locale:
#>  [1] LC_CTYPE=C.UTF-8       LC_NUMERIC=C           LC_TIME=C.UTF-8
#>  [4] LC_COLLATE=C.UTF-8     LC_MONETARY=C.UTF-8    LC_MESSAGES=C.UTF-8
#>  [7] LC_PAPER=C.UTF-8       LC_NAME=C              LC_ADDRESS=C
#> [10] LC_TELEPHONE=C         LC_MEASUREMENT=C.UTF-8 LC_IDENTIFICATION=C
#>
#> time zone: UTC
#> tzcode source: system (glibc)
#>
#> attached base packages:
#> [1] stats     graphics  grDevices utils     datasets  methods   base
#>
#> other attached packages:
#> [1] ggplot2_4.0.3         dplyr_1.2.1           rxode2_5.1.8
#> [4] nlmixr2lib_0.3.2.9000
#>
#> loaded via a namespace (and not attached):
#>  [1] tidyr_1.3.2         generics_0.1.4      sass_0.4.10
#>  [4] xml2_1.6.0          digest_0.6.39       magrittr_2.0.5
#>  [7] RColorBrewer_1.1-3  evaluate_1.0.5      grid_4.6.1
#> [10] fastmap_1.2.0       lotri_1.0.5         jsonlite_2.0.0
#> [13] whisker_0.4.1       rxode2ll_2.0.18     backports_1.5.1
#> [16] purrr_1.2.2         scales_1.4.0        textshaping_1.0.5
#> [19] jquerylib_0.1.4     cli_3.6.6           crayon_1.5.3
#> [22] symengine_0.2.14    rlang_1.3.0         withr_3.0.3
#> [25] cachem_1.1.0        yaml_2.3.12         otel_0.2.0
#> [28] tools_4.6.1         parallel_4.6.1      memoise_2.0.1
#> [31] checkmate_2.3.4     rxode2lincmt_0.1.0  vctrs_0.7.3
#> [34] R6_2.6.1            lifecycle_1.0.5     fs_2.1.0
#> [37] ragg_1.5.2          PreciseSums_0.7     fontawesome_0.5.3
#> [40] pkgconfig_2.0.3     desc_1.4.3          rex_1.2.2
#> [43] pkgdown_2.2.1       pillar_1.11.1       bslib_0.12.0
#> [46] gtable_0.3.6        glue_1.8.1          data.table_1.18.6.1
#> [49] Rcpp_1.1.2          systemfonts_1.3.2   tidyselect_1.2.1
#> [52] xfun_0.61           tibble_3.3.1        sys_3.4.3
#> [55] knitr_1.52          farver_2.1.2        dparser_1.3.1-14
#> [58] htmltools_0.5.9     labeling_0.4.3      rmarkdown_2.32
#> [61] compiler_4.6.1      S7_0.2.2            downlit_0.4.5
#> [64] askpass_1.2.1       openssl_2.4.2