DRL-17822 (Goulooze 2020)
Source:vignettes/articles/Goulooze_2020_DRL17822.Rmd
Goulooze_2020_DRL17822.RmdModel and source
- Citation: Goulooze SC, Kruithof AC, Alikunju S, Gautam A, Burggraaf J, Kamerling IMC, Stevens J. The effect of food and formulation on the population pharmacokinetics of cholesteryl ester transferase protein inhibitor DRL-17822 in healthy male volunteers. Br J Clin Pharmacol. 2020;86(10):2095-2101. doi:10.1111/bcp.14297
- Description: Two-compartment population PK model with a six-transit-compartment absorption chain for the oral cholesteryl ester transfer protein (CETP) inhibitor DRL-17822 in healthy male volunteers, with the food-by-formulation interaction on relative bioavailability binned into four levels (nanocrystal vs amorphous solid dispersion; fasted, low-fat, high-fat or continental breakfast), a slower absorption rate for the amorphous solid dispersion after a high-fat breakfast, BMI on central volume, and correlated inter-individual and inter-occasion variability on relative bioavailability and absorption rate
- Article: https://doi.org/10.1111/bcp.14297 (open access, PMC7495284)
DRL-17822 is an oral cholesteryl ester transfer protein (CETP)
inhibitor without an INN; the model file uses the development code. The
supporting information of the article includes the final NONMEM control
stream, which fixes several details not printed in the main text: the
BMI centring value (23.3 kg/m^2), the linear form of the BMI effect, the
transit-chain topology, which food and formulation combinations fall
into each bin, and the order of the random effects in the
$OMEGA blocks.
Population
Four phase I studies in healthy male volunteers in the Netherlands (study 4 in parts A and B; Table S1 and S2 of the supplement): a single ascending dose study (5-1000 mg nanocrystal, fasted), a single-dose food interaction study (150 mg nanocrystal, fasted vs high-fat breakfast), a two-week once-daily multiple ascending dose study (50-450 mg nanocrystal after a continental breakfast), and a four-way crossover food-by-formulation study (150 mg nanocrystal or amorphous solid dispersion, fasted or after a low-fat or high-fat breakfast). In total, 2816 plasma concentrations from 95 drug-treated subjects were analysed. Mean age by study was 25-32 years (range 18-53), mean weight 75-84 kg (range 59.4-116.7) and mean BMI 21.6-25.0 kg/m^2 (range 18.8-29.9).
The same information is available programmatically via
readModelDb("Goulooze_2020_DRL17822")()$population.
Source trace
| Equation / parameter | Value | Source location |
|---|---|---|
lka |
log(1.74) 1/h | Table 1 ‘ka’ |
lvc |
log(86.7) L | Table 1 ‘Vc’ |
lkel |
log(0.100) 1/h | Table 1 ‘kel’ |
lvp |
log(599) L | Table 1 ‘Vp’ |
lq |
log(5.11) L/h | Table 1 ‘Qc/p’ |
lfdepot |
fixed(log(1)) | Table 1 ‘F reference’ (fixed) |
e_fed_medium_fdepot |
0.532 | Table 1 ‘F medium’ |
e_fasted_asd_fdepot |
0.151 | Table 1 ‘F medium-low’ |
e_fasted_nc_fdepot |
0.056 | Table 1 ‘F low’ |
e_bmi_vc |
0.041 per kg/m^2 | Table 1 ‘COV BMI, Vc’; linear form, centre 23.3 from control stream
$PK
|
e_asd_highfat_ka |
0.599 | Table 1 ‘k a,asd,HF’ |
| IIV Vc, ka, F (variances) | 0.0689, 0.0625, 0.391 | Table 1 IIV 26.7%, 25.4%, 69.2%; omega^2 = log(1 + CV^2) per Table 1 footnote a |
| IIV Vc-ka, F-ka (covariances) | 0.0464, -0.0438 | Table 1 ‘Cor. IIV Vc-ka’ 0.707, ‘Cor. IIV F-ka’ -0.280 |
| IIV kel | 0.0551 | Table 1 IIV 23.8% |
| IOV F, ka (variances), covariance | 0.183, 0.0428, -0.00787 | Table 1 IOV 44.8%, 20.9%; ‘Cor. IOV F-ka’ -0.089;
$OMEGA BLOCK(2) SAME x3 |
propSd |
0.338 | Table 1 ‘Proportional error (sigma^2)’ 0.114; SD = sqrt(0.114) |
| Depot + 6 transit compartments, all at rate ka | n/a | Results 3.1; control stream $DES
|
| Two-compartment disposition with first-order elimination kel | n/a | Results 3.1; control stream $DES
|
| Food-by-formulation bins on F | n/a | Results 3.1; control stream $PK FM
assignments |
Cc = 1000 * central / vc (ng/mL) |
n/a | control stream S2 = V2/1000; dose in mg |
Virtual cohort
The seven food-by-formulation combinations studied are simulated as separate arms of 100 subjects each, all at the 150 mg single dose used in studies 2 and 4, plus the 450 mg once-daily arm of the multiple ascending dose study (nanocrystal after a continental breakfast). BMI is drawn from a normal distribution around the pooled mean (about 23.5 kg/m^2, SD 2.5) and redrawn when outside the observed 18.8-29.9 kg/m^2 range.
set.seed(2020)

arms <- tribble(
  ~arm,             ~FORM_DRL17822_ASD, ~FED, ~FED_LOWFAT, ~FED_HIGHFAT,
  "NC fasted",      0,                  0,    0,           0,
  "NC low-fat",     0,                  1,    1,           0,
  "NC high-fat",    0,                  1,    0,           1,
  "NC continental", 0,                  1,    0,           0,
  "ASD fasted",     1,                  0,    0,           0,
  "ASD low-fat",    1,                  1,    1,           0,
  "ASD high-fat",   1,                  1,    0,           1
)

draw_bmi <- function(n) {
  out <- rnorm(n, 23.5, 2.5)
  bad <- out < 18.8 | out > 29.9
  while (any(bad)) {
    out[bad] <- rnorm(sum(bad), 23.5, 2.5)
    bad <- out < 18.8 | out > 29.9
  }
  out
}

n_per_arm <- 100
obs_sd <- c(0, 0.5, 1, 2, 3, 4, 5, 6, 7, 8, 9, 10, 12, 16, 24, 36, 48, 72, 96, 144)

subjects_sd <- arms[rep(seq_len(nrow(arms)), each = n_per_arm), ] |>
  mutate(id = row_number(), BMI = draw_bmi(n()), OCC = 1)

events_sd <- bind_rows(
  subjects_sd |> mutate(time = 0, amt = 150, evid = 1, cmt = "depot"),
  subjects_sd |>
    tidyr::crossing(time = obs_sd) |>
    mutate(amt = 0, evid = 0, cmt = "central")
) |>
  arrange(id, time, desc(evid))

# Study 3: 450 mg once daily for 14 days after a continental breakfast
subjects_md <- tibble(
  id = nrow(subjects_sd) + seq_len(n_per_arm),
  arm = "NC continental 450 mg QD",
  FORM_DRL17822_ASD = 0, FED = 1, FED_LOWFAT = 0, FED_HIGHFAT = 0,
  BMI = draw_bmi(n_per_arm), OCC = 1
)
obs_md <- sort(unique(c(seq(0, 312, by = 24), 312 + c(1, 2, 4, 6, 8, 12, 24, 48, 72, 96, 168, 336, 504))))
events_md <- bind_rows(
  subjects_md |> tidyr::crossing(time = seq(0, 312, by = 24)) |>
    mutate(amt = 450, evid = 1, cmt = "depot"),
  subjects_md |> tidyr::crossing(time = obs_md) |>
    mutate(amt = 0, evid = 0, cmt = "central")
) |>
  arrange(id, time, desc(evid))

stopifnot(!anyDuplicated(c(unique(events_sd$id), unique(events_md$id))))
Simulation
mod <- readModelDb("Goulooze_2020_DRL17822")
keep_cols <- c("arm", "BMI")
sim_sd <- rxode2::rxSolve(mod, events = events_sd, keep = keep_cols)
#> ℹ parameter labels from comments will be replaced by 'label()'
#> Warning: some etas defaulted to non-mu referenced, possible parsing error: etaiov_lka_4, etaiov_lfdepot_4, etaiov_lka_3, etaiov_lfdepot_3, etaiov_lka_2, etaiov_lfdepot_2, etaiov_lka_1, etaiov_lfdepot_1
#> as a work-around try putting the mu-referenced expression on a simple line
sim_md <- rxode2::rxSolve(mod, events = events_md, keep = keep_cols)
Concentration-time profiles
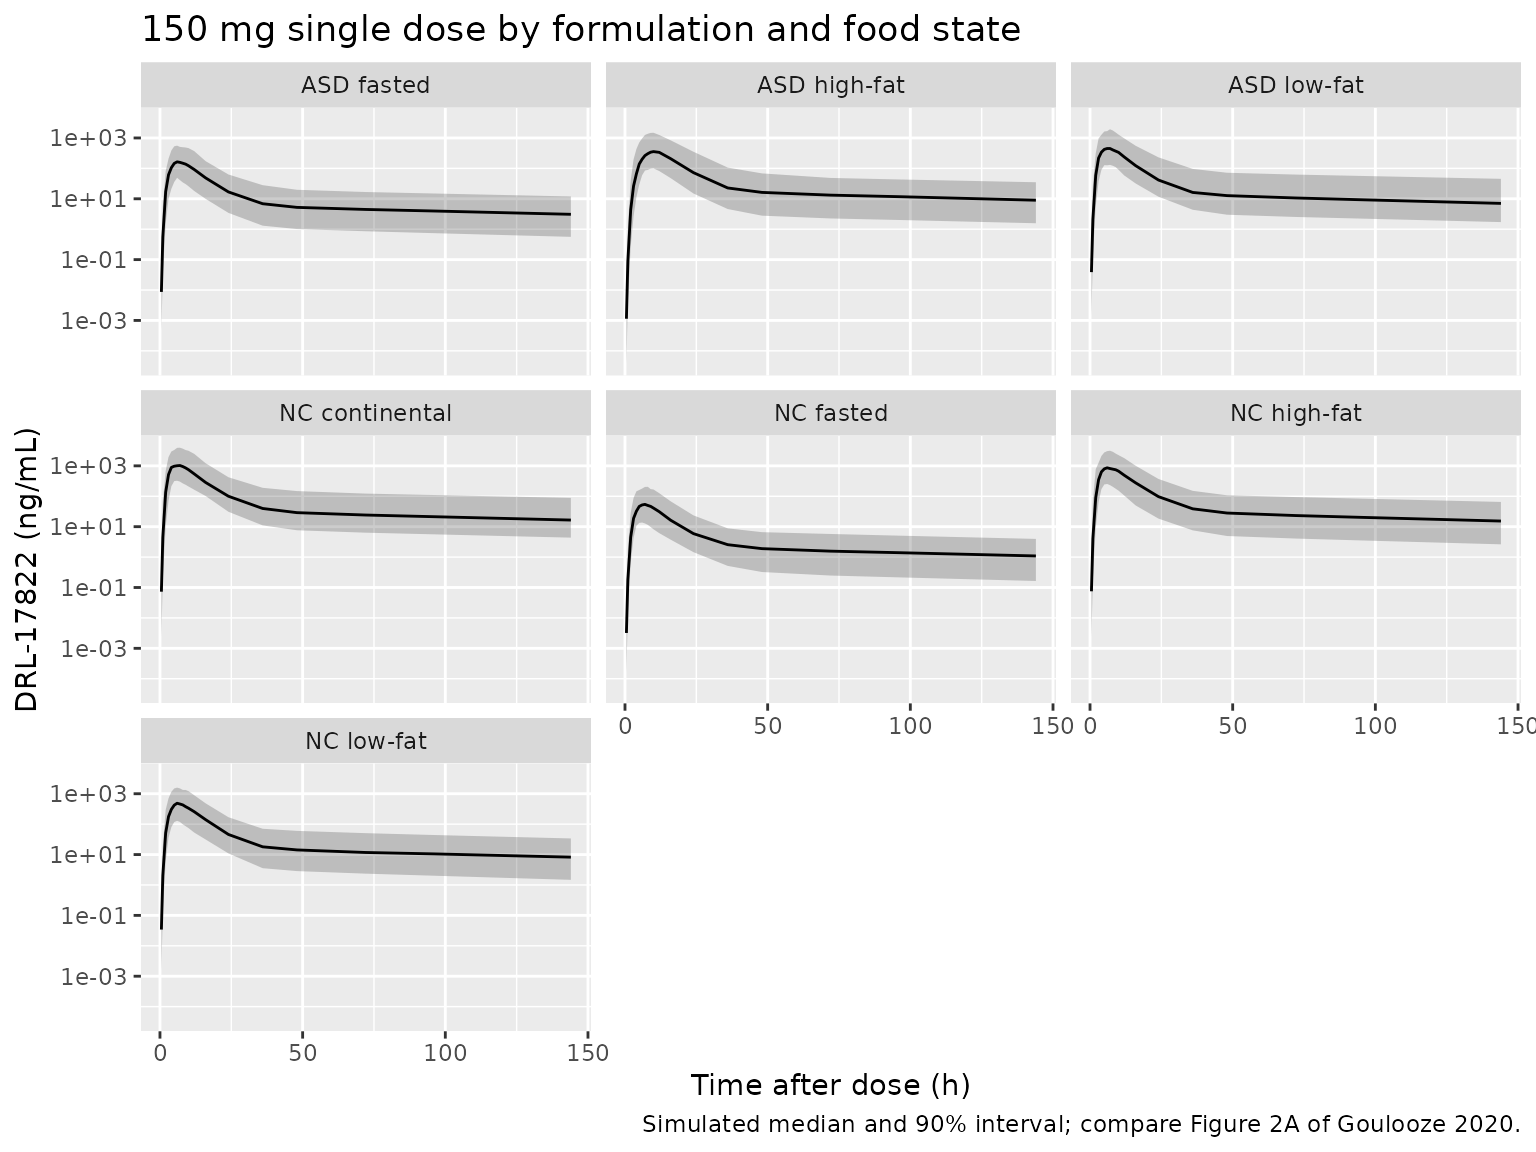
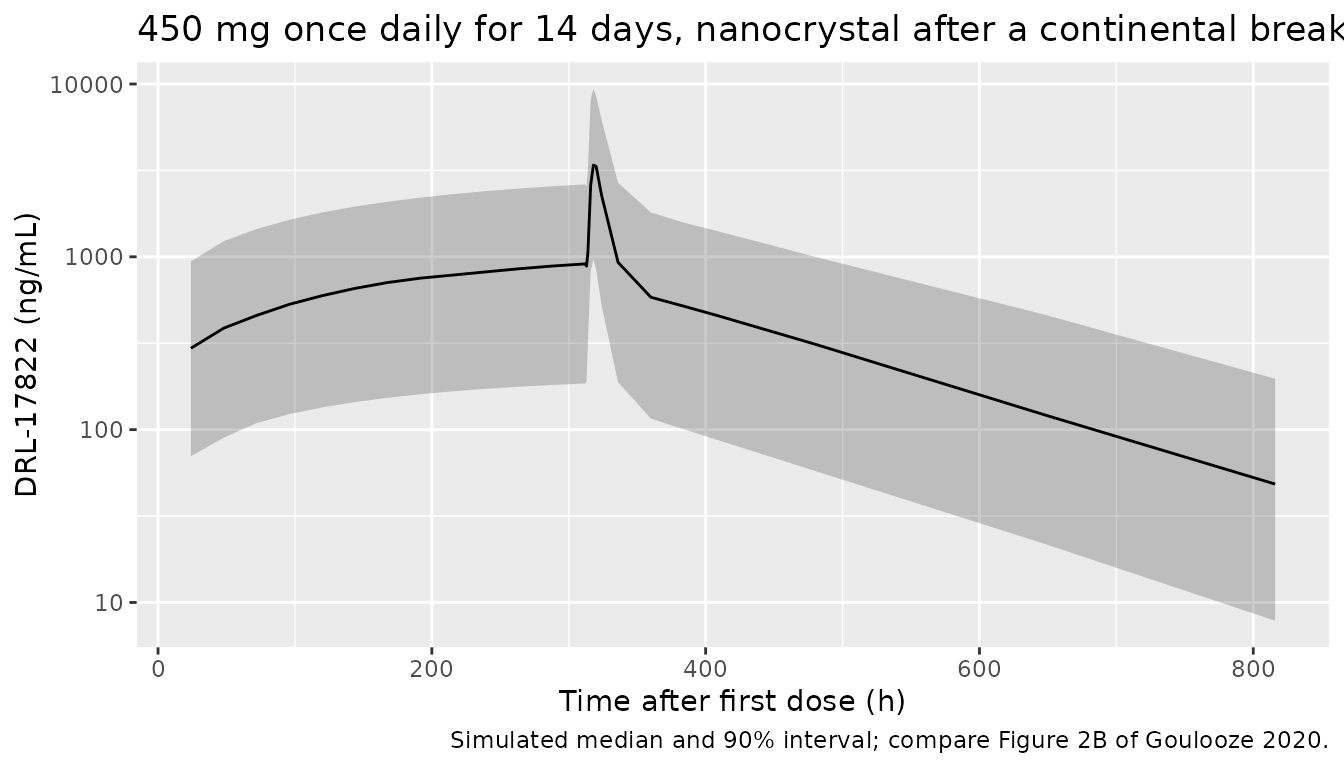
Figure 2 of the paper is a prediction-corrected VPC of the observed data, which cannot be reproduced without those data. The plots below show the simulated 5th, 50th and 95th percentiles for each arm; the order of the arms and the spacing between them reflect the four bioavailability bins and the slower absorption of the ASD after a high-fat breakfast.
sim_sd |>
  filter(time > 0) |>
  group_by(arm, time) |>
  summarise(
    Q05 = quantile(Cc, 0.05), Q50 = median(Cc), Q95 = quantile(Cc, 0.95),
    .groups = "drop"
  ) |>
  ggplot(aes(time, Q50)) +
  geom_ribbon(aes(ymin = Q05, ymax = Q95), alpha = 0.25) +
  geom_line() +
  facet_wrap(~arm) +
  scale_y_log10() +
  labs(
    x = "Time after dose (h)", y = "DRL-17822 (ng/mL)",
    title = "150 mg single dose by formulation and food state",
    caption = "Simulated median and 90% interval; compare Figure 2A of Goulooze 2020."
  )
sim_md |>
  filter(time > 0) |>
  group_by(time) |>
  summarise(
    Q05 = quantile(Cc, 0.05), Q50 = median(Cc), Q95 = quantile(Cc, 0.95),
    .groups = "drop"
  ) |>
  ggplot(aes(time, Q50)) +
  geom_ribbon(aes(ymin = Q05, ymax = Q95), alpha = 0.25) +
  geom_line() +
  scale_y_log10() +
  labs(
    x = "Time after first dose (h)", y = "DRL-17822 (ng/mL)",
    title = "450 mg once daily for 14 days, nanocrystal after a continental breakfast",
    caption = "Simulated median and 90% interval; compare Figure 2B of Goulooze 2020."
  )
Typical-value checks against the published bioavailability ratios
The paper prints no NCA table. It does state the fold differences
implied by the bioavailability bins (Results 3.1): an 18-fold increase
for the nanocrystal from fasted to a high-fat or continental breakfast,
a 2-fold lower bioavailability after a low-fat than after a high-fat
breakfast for the nanocrystal, and a 3.5-fold difference for the ASD
between fasted and high-fat dosing. Because the model is linear, these
ratios must hold for AUC(0-inf) of the typical subject, and AUC(0-inf)
times the apparent clearance kel * Vc must equal
F * Dose. Both are checked with PKNCA on a dense, long
typical-value simulation (terminal half-life is about 130 h).
mod_typical <- rxode2::zeroRe(mod)
#> ℹ parameter labels from comments will be replaced by 'label()'
#> Warning: some etas defaulted to non-mu referenced, possible parsing error: etaiov_lka_4, etaiov_lfdepot_4, etaiov_lka_3, etaiov_lfdepot_3, etaiov_lka_2, etaiov_lfdepot_2, etaiov_lka_1, etaiov_lfdepot_1
#> as a work-around try putting the mu-referenced expression on a simple line
#> Warning: some etas defaulted to non-mu referenced, possible parsing error: etaiov_lka_4, etaiov_lfdepot_4, etaiov_lka_3, etaiov_lfdepot_3, etaiov_lka_2, etaiov_lfdepot_2, etaiov_lka_1, etaiov_lfdepot_1
#> as a work-around try putting the mu-referenced expression on a simple line
obs_long <- sort(unique(c(seq(0, 24, by = 0.25), seq(25, 3000, by = 5))))
events_typ <- bind_rows(
  arms |> mutate(id = row_number(), BMI = 23.3, OCC = 1, time = 0, amt = 150, evid = 1, cmt = "depot"),
  arms |> mutate(id = row_number(), BMI = 23.3, OCC = 1) |>
    tidyr::crossing(time = obs_long) |>
    mutate(amt = 0, evid = 0, cmt = "central")
) |>
  arrange(id, time, desc(evid))
sim_typ <- rxode2::rxSolve(mod_typical, events = events_typ, keep = "arm")
#> ℹ omega/sigma items treated as zero: 'etaiov_lka_4', 'etaiov_lfdepot_4', 'etaiov_lka_3', 'etaiov_lfdepot_3', 'etaiov_lka_2', 'etaiov_lfdepot_2', 'etaiov_lka_1', 'etaiov_lfdepot_1', 'etalfdepot', 'etalka', 'etalvc', 'etalkel'
#> Warning: multi-subject simulation without without 'omega'

conc_typ <- as.data.frame(sim_typ) |>
  filter(!is.na(Cc)) |>
  select(id, time, Cc, arm) |>
  mutate(treatment = arm)
dose_typ <- events_typ |>
  filter(evid == 1) |>
  select(id, time, amt, arm) |>
  mutate(treatment = arm)

o_conc <- PKNCA::PKNCAconc(conc_typ, Cc ~ time | treatment + id)
o_dose <- PKNCA::PKNCAdose(dose_typ, amt ~ time | treatment + id)
o_data <- PKNCA::PKNCAdata(
  o_conc, o_dose,
  intervals = data.frame(
    start = 0, end = Inf, cmax = TRUE, tmax = TRUE,
    aucinf.obs = TRUE, half.life = TRUE
  )
)
nca_typ <- as.data.frame(PKNCA::pk.nca(o_data))

nca_wide <- nca_typ |>
  filter(PPTESTCD %in% c("cmax", "tmax", "aucinf.obs", "half.life")) |>
  select(treatment, PPTESTCD, PPORRES) |>
  tidyr::pivot_wider(names_from = PPTESTCD, values_from = PPORRES)

f_expected <- c(
  "NC fasted" = 0.056, "NC low-fat" = 0.532, "NC high-fat" = 1,
  "NC continental" = 1, "ASD fasted" = 0.151, "ASD low-fat" = 0.532,
  "ASD high-fat" = 0.532
)
cl_typ <- 0.100 * 86.7
nca_wide <- nca_wide |>
  mutate(
    F_expected = f_expected[treatment],
    AUC_expected = F_expected * 150 * 1000 / cl_typ,
    pct_diff = 100 * (aucinf.obs / AUC_expected - 1)
  )

nca_wide |>
  mutate(across(c(cmax, aucinf.obs, AUC_expected, half.life), ~ signif(.x, 4))) |>
  select(treatment, F_expected, cmax, tmax, aucinf.obs, AUC_expected, pct_diff, half.life) |>
  rename(
    "Arm" = treatment, "F (Table 1)" = F_expected, "Cmax (ng/mL)" = cmax,
    "Tmax (h)" = tmax, "AUC0-inf PKNCA (ng h/mL)" = aucinf.obs,
    "F x Dose / CL (ng h/mL)" = AUC_expected, "% difference" = pct_diff,
    "t1/2 (h)" = half.life
  ) |>
knitr::kable(digits = 2)| Arm | F (Table 1) | Cmax (ng/mL) | Tmax (h) | AUC0-inf PKNCA (ng h/mL) | F x Dose / CL (ng h/mL) | % difference | t1/2 (h) |
|---|---|---|---|---|---|---|---|
| ASD fasted | 0.15 | 164.40 | 6 | 2614.0 | 2612.0 | 0.06 | 131.7 |
| ASD high-fat | 0.53 | 478.60 | 9 | 9211.0 | 9204.0 | 0.08 | 131.6 |
| ASD low-fat | 0.53 | 579.40 | 6 | 9209.0 | 9204.0 | 0.06 | 131.7 |
| NC continental | 1.00 | 1089.00 | 6 | 17310.0 | 17300.0 | 0.06 | 131.7 |
| NC fasted | 0.06 | 60.98 | 6 | 969.4 | 968.9 | 0.06 | 131.7 |
| NC high-fat | 1.00 | 1089.00 | 6 | 17310.0 | 17300.0 | 0.06 | 131.7 |
| NC low-fat | 0.53 | 579.40 | 6 | 9209.0 | 9204.0 | 0.06 | 131.7 |
auc <- setNames(nca_wide$aucinf.obs, nca_wide$treatment)
ratios <- c(
  "NC high-fat / NC fasted (paper: 18-fold)" = auc[["NC high-fat"]] / auc[["NC fasted"]],
  "NC high-fat / NC low-fat (paper: 2-fold)" = auc[["NC high-fat"]] / auc[["NC low-fat"]],
  "ASD high-fat / ASD fasted (paper: 3.5-fold)" = auc[["ASD high-fat"]] / auc[["ASD fasted"]]
)
knitr::kable(data.frame(Comparison = names(ratios), `AUC ratio` = round(ratios, 2), check.names = FALSE), row.names = FALSE)| Comparison | AUC ratio |
|---|---|
| NC high-fat / NC fasted (paper: 18-fold) | 17.86 |
| NC high-fat / NC low-fat (paper: 2-fold) | 1.88 |
| ASD high-fat / ASD fasted (paper: 3.5-fold) | 3.52 |
stopifnot(
  # Typical-value solve against its own closed form: pure numerical error.
  all(abs(nca_wide$pct_diff) < 1),
  abs(ratios[[1]] - 18) / 18 < 0.02,
  abs(ratios[[2]] - 2) / 2 < 0.07,
  abs(ratios[[3]] - 3.5) / 3.5 < 0.02,
  # The ASD after a high-fat breakfast absorbs more slowly (ka * 0.599)
  nca_wide$tmax[nca_wide$treatment == "ASD high-fat"] >
    nca_wide$tmax[nca_wide$treatment == "ASD low-fat"]
)
The 2-fold statement is the rounded value of 1 / 0.532 = 1.88.
Stochastic cohort NCA
conc_sd <- as.data.frame(sim_sd) |>
  filter(!is.na(Cc)) |>
  select(id, time, Cc, arm) |>
  mutate(treatment = arm)
dose_sd <- events_sd |>
  filter(evid == 1) |>
  select(id, time, amt, arm) |>
  mutate(treatment = arm)
o_data_sd <- PKNCA::PKNCAdata(
  PKNCA::PKNCAconc(conc_sd, Cc ~ time | treatment + id),
  PKNCA::PKNCAdose(dose_sd, amt ~ time | treatment + id),
  intervals = data.frame(start = 0, end = 144, cmax = TRUE, tmax = TRUE, auclast = TRUE)
)
nca_sd <- as.data.frame(PKNCA::pk.nca(o_data_sd))
nca_sd |>
  filter(PPTESTCD %in% c("cmax", "tmax", "auclast")) |>
  group_by(treatment, PPTESTCD) |>
  summarise(median = signif(median(PPORRES), 3), .groups = "drop") |>
  tidyr::pivot_wider(names_from = PPTESTCD, values_from = median) |>
  rename(
    "Arm" = treatment, "Cmax (ng/mL)" = cmax, "Tmax (h)" = tmax,
    "AUC0-144 (ng h/mL)" = auclast
  ) |>
knitr::kable()| Arm | AUC0-144 (ng h/mL) | Cmax (ng/mL) | Tmax (h) |
|---|---|---|---|
| ASD fasted | 2310 | 168.0 | 6 |
| ASD high-fat | 6730 | 388.0 | 9 |
| ASD low-fat | 6450 | 514.0 | 6 |
| NC continental | 14300 | 1130.0 | 6 |
| NC fasted | 790 | 60.2 | 6 |
| NC high-fat | 13100 | 1010.0 | 6 |
| NC low-fat | 6460 | 534.0 | 6 |
Assumptions and deviations
- Drug name. DRL-17822 has no INN; the file name uses the development code without the hyphen.
- IIV and IOV variances. Table 1 reports CV% computed as sqrt(exp(omega^2) - 1) (footnote a); the variances were recovered as log(1 + CV^2). The footnote is attached to the IIV column; the same conversion was assumed for the IOV column.
-
Vc-F IIV covariance. The control stream’s
$OMEGA BLOCK(3)over Vc, ka and F starts the Vc-F element at 0, and the paper reports only the Vc-ka and F-ka correlations (Results 3.1 lists three correlated pairs in total, the third being IOV F-ka). The Vc-F covariance is therefore set to -
Inter-occasion variability. The control stream
applies IOV only to studies 2-4 (subjects with ID > 200); the
single-occasion study 1 subjects carry none. Here this is reproduced
with
OCC = 0(no IOV) andOCC = 1to4(occasions of the crossover studies). The simulations above useOCC = 1. How occasions were defined in the two-week multiple dose study is not stated. - Continental breakfast with the ASD. This combination was not studied. The control stream falls through to the reference bin (F = 1), and the model reproduces that, but it is an extrapolation.
-
Absorption lag. The control stream carries
ALAG1 = THETA(2)withTHETA(2)fixed to 0, so no lag is included. -
Residual error. The control stream uses
Y = F * (1 + ERR(1)) + ERR(2)with the additive$SIGMAelement fixed to 0, which is a proportional error model. - Dose range. The abstract states doses of 2-1000 mg, but Table S2 lists 5-1000 mg in the single ascending dose study; the population metadata follows Table S2.