Rifampicin (Horita 2018)
Source:vignettes/articles/Horita_2018_rifampicin.Rmd
Horita_2018_rifampicin.RmdModel and source
- Citation: Horita Y, Alsultan A, Kwara A, Antwi S, Enimil A, Ortsin A, Dompreh A, Yang H, Wiesner L, Peloquin CA. Evaluation of the Adequacy of WHO Revised Dosages of the First-Line Antituberculosis Drugs in Children with Tuberculosis Using Population Pharmacokinetic Modeling and Simulations. Antimicrob Agents Chemother. 2018;62(9):e00008-18. doi:10.1128/AAC.00008-18
- Description: One-compartment population pharmacokinetic model with sequential zero-order then first-order absorption and first-order elimination for oral rifampin (rifampicin) in Ghanaian children with active tuberculosis (Horita 2018); allometric weight scaling on CL/F (fixed 0.75) and V/F (fixed 1.0) normalised to the cohort median 14.3 kg.
- Article: https://doi.org/10.1128/AAC.00008-18
Population
The model was developed from 113 Ghanaian children with active tuberculosis enrolled at Komfo Anokye Teaching Hospital, Kumasi, Ghana between October 2012 and August 2015 (ClinicalTrials.gov NCT01687504). The cohort spans 3 months to 14 years of age (median 5.00 years, IQR 2.17 to 8.25) and 5 to 30 kg in body weight (median 14.3 kg, IQR 9.70 to 20.1). 21.2% were under 2 years old. 55.8% were male, 52.2% were HIV-positive, and 45.1% were NAT2 slow acetylators (Horita 2018 Table 1). 558 rifampin concentration-time data points were available; 115 below-LLOQ values were left-censored and analyzed via the SAEM algorithm in MonolixSuite2016R1.
Children received rifampin 10-20 mg/kg orally daily (median 15.8 mg/kg, IQR 13.6-18.8) as part of the standard four-drug anti-TB regimen with isoniazid, pyrazinamide, and ethambutol. The medications were swallowed or dispersed in water; dosing was observed by a healthcare worker during hospitalisation and by a family member at home. PK sampling was performed after at least 4 weeks of anti-TB treatment (steady state) with blood samples at 0 (pre-dose), 1, 2, 4, and 8 hours postdose. The samples were quantified by LC-MS/MS over the analytical range 0.117 to 30 ug/mL.
The same information is available programmatically via
readModelDb("Horita_2018_rifampicin")$population.
Source trace
Per-parameter origin is recorded inline next to each
ini() entry in
inst/modeldb/specificDrugs/Horita_2018_rifampicin.R. The
table below collects them in one place for review.
| Equation / parameter | Value | Source location |
|---|---|---|
| Structural model: 1-compartment with sequential zero- + first-order absorption | – | Results “RIF” paragraph 1; Table 2 |
Fr (zero-order fraction) |
0.0878 | Table 2 |
Tk0 (zero-order duration) |
0.342 h | Table 2 |
ka (first-order rate) |
0.645 1/h | Table 2 |
V/F (typical at WT = 14.3 kg) |
13.8 L | Table 2 |
CL/F (typical at WT = 14.3 kg) |
7.53 L/h | Table 2 |
| Allometric exponent on CL/F | 0.75 (fixed) | Results “RIF” paragraph 1 |
| Allometric exponent on V/F | 1.0 (fixed) | Results “RIF” paragraph 1 |
| IIV on Fr (omega) | 1.08 (148.7% CV) | Table 2 |
| IIV on Tk0 (omega) | 0.914 (114.3% CV) | Table 2 |
| IIV on ka (omega) | 0.464 (49.0% CV) | Table 2 |
| IIV on V/F (omega) | 0.217 (22.0% CV) | Table 2 |
| IIV on CL/F (omega) | 0.547 (59.1% CV) | Table 2 |
| Residual error: constant a | 0.0476 ug/mL | Table 2 |
| Residual error: slope b | 0.202 (fraction) | Table 2 |
Virtual cohort
Original observed data are not publicly available. The figures below use a virtual paediatric population reflecting the Horita 2018 Table 1 weight-band distribution (5-7 kg, 8-14 kg, 15-20 kg, 21-30 kg). The median weight within each band approximates the Table 1 values: 6.45, 12.5, 17.7, 22.4 kg respectively.
set.seed(20260526)

# Horita 2018 Table 3 dose recommendations achieving the 3.01 ug/mL Cmax
# target. The doses in each weight band match the WHO-recommended doses
# tested in Figure 3.
weight_bands <- tibble::tibble(
  band = c("5-7 kg", "8-14 kg", "15-20 kg", "21-30 kg"),
  weight_median = c(6.45, 12.5, 17.7, 22.4),
  dose_mg = c(120, 180, 240, 240),
  band_idx = seq_len(4)
)

n_per_band <- 50L
make_cohort <- function(band_idx, n, id_offset = 0L) {
  row <- weight_bands[band_idx, ]
  ids <- id_offset + seq_len(n)
  obs_times <- seq(0, 24, by = 0.5)
  rxode2::et(amt = row$dose_mg, time = 0, cmt = "depot") |>
    rxode2::et(obs_times) |>
    rxode2::et(id = ids) |>
    as.data.frame() |>
    dplyr::mutate(
      WT   = row$weight_median,
      band = row$band
    )
}

events <- dplyr::bind_rows(
  make_cohort(1L, n_per_band, id_offset =   0L),
  make_cohort(2L, n_per_band, id_offset = 100L),
  make_cohort(3L, n_per_band, id_offset = 200L),
  make_cohort(4L, n_per_band, id_offset = 300L)
)
stopifnot(!anyDuplicated(unique(events[, c("id", "time", "evid")])))
Simulation
mod <- readModelDb("Horita_2018_rifampicin")
sim <- rxode2::rxSolve(mod, events = events, keep = c("band", "WT"))
#> ℹ parameter labels from comments will be replaced by 'label()'
Replicate published figures
sim_cmax <- sim |>
  dplyr::filter(time <= 24, !is.na(Cc)) |>
  dplyr::group_by(id, band) |>
  dplyr::summarise(cmax = max(Cc), .groups = "drop")

ggplot(sim_cmax, aes(x = band, y = cmax)) +
  geom_boxplot(outlier.size = 0.5) +
  geom_hline(yintercept = 3.01, linetype = "dashed", colour = "red") +
  geom_hline(yintercept = 8.0,  linetype = "dotted", colour = "red") +
  labs(x = "Weight band",
       y = "Simulated steady-state Cmax (ug/mL)",
       title = "Rifampin steady-state Cmax by weight band",
       caption = "Replicates Horita 2018 Figure 3A. Dashed line: paediatric target 3.01 ug/mL; dotted line: lower adult-normal-range 8 ug/mL.")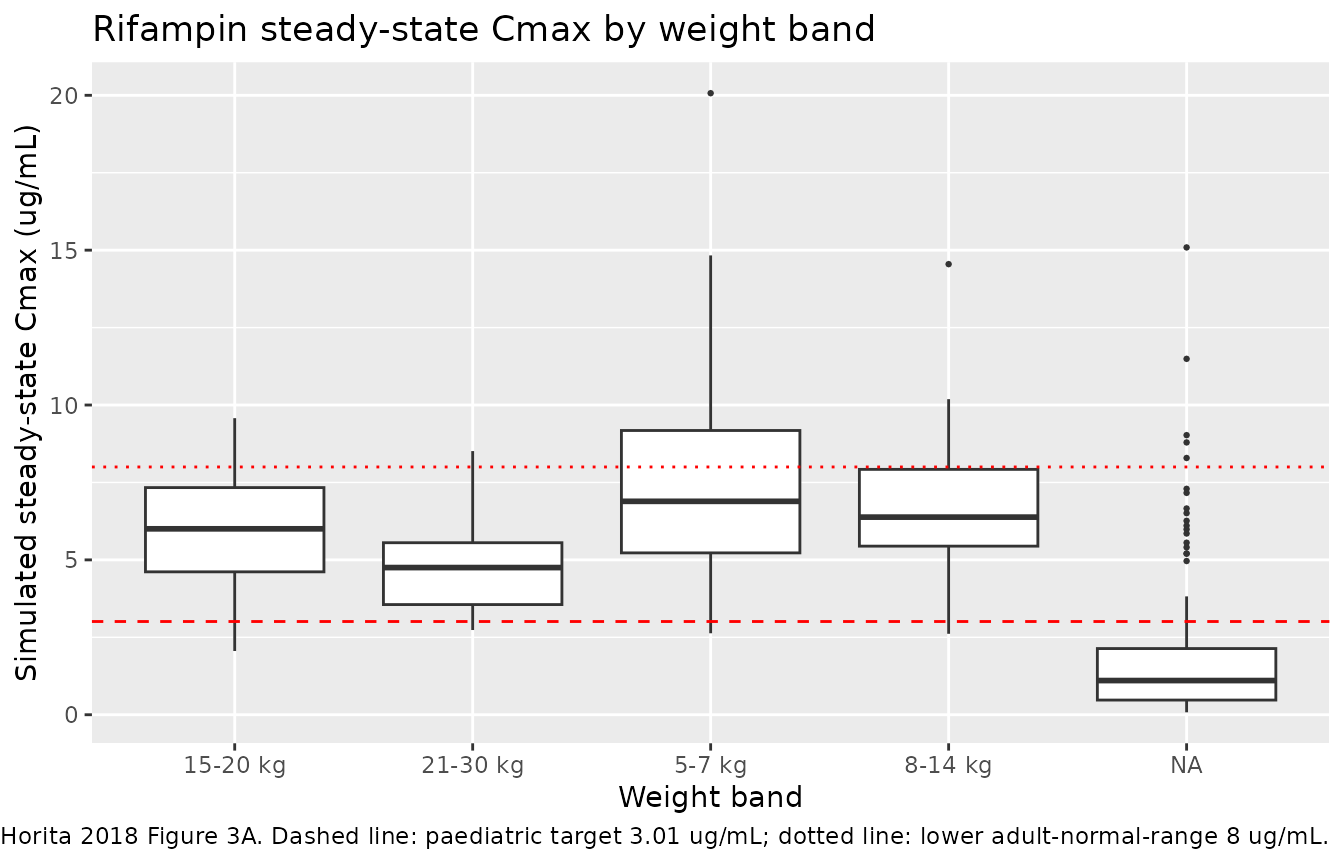
Replicates Figure 3 of Horita 2018 (rifampin Cmax by weight band).
PKNCA validation
The PKNCA package computes NCA parameters (Cmax, Tmax, AUC, half-life) from the simulated concentrations. The formula includes the weight-band grouping so per-band summaries are comparable to the source paper.
sim_nca <- sim |>
  dplyr::filter(!is.na(Cc), time <= 24) |>
  dplyr::select(id, time, Cc, band)

conc_obj <- PKNCA::PKNCAconc(sim_nca, Cc ~ time | band + id)

dose_df <- events |>
  dplyr::filter(evid == 1) |>
  dplyr::select(id, time, amt, band) |>
  dplyr::distinct()

dose_obj <- PKNCA::PKNCAdose(dose_df, amt ~ time | band + id)

intervals <- data.frame(
  start      = 0,
  end        = 24,
  cmax       = TRUE,
  tmax       = TRUE,
  auclast    = TRUE
)

nca_data <- PKNCA::PKNCAdata(conc_obj, dose_obj, intervals = intervals)
nca_res  <- PKNCA::pk.nca(nca_data)

nca_summary <- summary(nca_res)
knitr::kable(nca_summary, caption = "Simulated NCA parameters by weight band (Horita 2018 rifampicin).")| start | end | band | N | auclast | cmax | tmax |
|---|---|---|---|---|---|---|
| 0 | 24 | 15-20 kg | 50 | 25.9 [53.7] | 5.69 [34.0] | 2.00 [0.500, 4.00] |
| 0 | 24 | 21-30 kg | 50 | 23.1 [59.4] | 4.58 [30.8] | 2.00 [0.500, 6.00] |
| 0 | 24 | 5-7 kg | 50 | 27.1 [55.5] | 6.76 [43.3] | 1.50 [0.500, 5.00] |
| 0 | 24 | 8-14 kg | 50 | 27.0 [52.9] | 6.30 [32.8] | 1.50 [0.500, 11.0] |
| 0 | 24 | NA | 200 | NC | 1.07 [140] | 0.286 [0.0248, 8.67] |
Comparison against published NCA
Horita 2018 reports observed NCA for rifampin in the pooled 113-child cohort (Results “RIF” paragraph 1; supplementary Table S1): median Cmax 6.50 ug/mL (IQR 4.92-8.79), median AUC0-8 25.95 mg*h/L (IQR 19.06-34.83) on a median dose of 15.79 mg/kg. The simulated cohort above uses a weight-band-stratified dosing structure rather than the observed per-subject doses, so the simulated Cmax and AUC are by construction per-band; the pooled comparison is informational only.
Assumptions and deviations
- Reference weight 14.3 kg. The paper does not state the allometric reference weight explicitly. It was inferred from the cohort median (Table 1) by back-computation against published adult typical-value parameters (Alsultan 2017 PZA at 70 kg = 5.06 L/h scales to Horita’s PZA 1.6 L/h at 14.3 kg via the published exponent 0.735).
-
Combined residual error mapped via the Pythagorean
(combined-2) form. Horita 2018 Table 4 footnote b specifies the
Monolix combined-1 form
var(y - f) = (a + b*f)^2; nlmixr2’s defaultadd(addSd) + prop(propSd)uses the Pythagoreanvar(y - f) = a^2 + (b*f)^2. The two forms agree whena << b*f(i.e., in the high-concentration regime) and differ by up to ~10% at very low concentrations. This matches the convention used byAlsultan_2017_pyrazinamide.Rand other Monolix-source models in the package. -
Zero-order then first-order absorption
implementation. Sequential arms are encoded via
mtime(tk_switch) <- tk0andtad(depot)-gated rate terms (the same idiom used inCirincione_2017_exenatide.R). The dose entersdepot, the zero-order arm withdraws at ratefr_zo * podo(depot) / tk0during the firsttk0hours after dose, and the first-order absorption (rateka) begins thereafter. - Simulated cohort. The virtual cohort uses the WHO weight-band median weights (Table 1) and per-band doses from Horita 2018 Table 3, not the observed per-subject doses. The replicated figure compares per-band Cmax against the Figure 3A target lines.