Acetaminophen (Hammer 2020)
Source:vignettes/articles/Hammer_2020_acetaminophen.Rmd
Hammer_2020_acetaminophen.RmdModel and source
- Citation: Hammer GB, Maxwell LG, Taicher BM, Visoiu M, Cooper DS, Szmuk P, Pheng LH, Gosselin NH, Lu J, Devarakonda K (2020). Randomized population pharmacokinetic analysis and safety of intravenous acetaminophen for acute postoperative pain in neonates and infants. J Clin Pharmacol 60(1):16-27. doi:10.1002/jcph.1508. PMID 31448420; PMCID PMC6973014.
- Description: Two-compartment population PK model for intravenous acetaminophen (paracetamol) in neonates, infants, children and adolescents (Hammer 2020), updating the Zuppa/Palmer pediatric model with neonate and infant data from a randomized placebo-controlled postoperative-pain study. All clearances scale allometrically with body weight (fixed exponent 0.75) and both volumes linearly with weight (reference 70 kg); systemic clearance additionally carries an exponential postmenstrual-age maturation function (1 - 0.611 * exp(-(PMA - 40) * ln 2 / 32.6 weeks)) and a 0.524-fold multiplier in the placebo arm, whose subjects had low residual acetaminophen concentrations. Log-normal residual error; correlated IIV on CL and Vc.
- Article: https://doi.org/10.1002/jcph.1508 (open access, PMC6973014)
Population
Hammer 2020 ran a randomized, placebo-controlled multicentre US study (NCT01635101) of intravenous acetaminophen in surgical neonates and infants under 24 months of age with acute postoperative pain. Subjects were stratified as neonates (< 28 days; extreme preterm, preterm and full term by gestational age), younger infants (28 days to < 6 months), intermediate-age infants (6 to < 12 months) and older infants (12 to < 24 months). They were randomized 2:2:1:1 to a low dose (7.5 mg/kg in extreme preterm neonates up to 12.5 mg/kg in infants), a high dose (10 to 15 mg/kg), or saline placebo (two control groups), each given as a 15-minute IV infusion every 6 h for 4 doses, with standard-of-care opioids.
The efficacy population (Table 2, n = 197) had a median postnatal age of 195 days and a median screening weight of 7.0 kg (range 0.8 to 14.3 kg), and was 35.5% female and 68.5% White. The PK population was 581 samples from 158 subjects. The final model was fitted to these data combined with the 1260 samples from 125 pediatric subjects (Zuppa and Palmer studies, neonates to adolescents) used for the previously developed model. The pooled data span about 33.7 to 906 weeks of postmenstrual age (Figure 4).
The same information is available programmatically via
readModelDb("Hammer_2020_acetaminophen")()$population.
Source trace
Every ini() value carries an in-file comment pointing to
its source in
inst/modeldb/specificDrugs/Hammer_2020_acetaminophen.R. All
values come from Table 3 (page 20), ‘Current Model’ column.
| Equation / parameter | Value | Source location |
|---|---|---|
lcl |
log(18.9) L/h | Table 3: CL = 18.9 x (WT/70)^0.75 |
lvc |
log(23.0) L | Table 3: Vc = 23.0 x (WT/70) |
lq |
log(47.7) L/h | Table 3: CLp = 47.7 x (WT/70)^0.75 |
lvp |
log(45.5) L | Table 3: Vp = 45.5 x (WT/70) |
e_wt_cl_q |
0.75 (fixed) | Table 3 exponents on CL and CLp |
e_wt_vc_vp |
1 (fixed) | Table 3 linear weight on Vc and Vp |
e_placebo_cl |
0.524 | Table 3: ‘Placebo on CL’ x0.524 |
e_page_cl |
0.611 | Table 3 maturation function: 1 - 0.611 x exp(…) |
thalf_cl |
32.6 weeks (fixed) | Table 3 maturation function, ln(2)/32.6 with footnote ‘Fixed at previous value’ |
etalcl, etalvc
|
0.127, 0.993; cov 0.18253 | Table 3 omega^2 CL, omega^2 Vc; note ‘correlation between CL and Vc BSV was 51.4%’ |
expSd |
0.221 | Table 3: ‘Log residual error’ |
fmat = 1 - e_page_cl * exp(-(PAGE - 40) * log(2) / thalf_cl) |
n/a | Table 3 maturation function |
cl = ... * e_placebo_cl^PLACEBO |
n/a | Table 3 ‘Placebo on CL’ row |
d/dt(central), d/dt(peripheral1)
|
n/a | Methods: 2-compartment model with linear elimination |
Cc ~ lnorm(expSd) |
n/a | Table 3: ‘Log residual error’ |
Virtual cohort
The observed data are not public. The first-dose comparison below uses one virtual arm per row of Table 4 (subgroup by dose level). Table 4 prints each subgroup’s median CL both in L/h and in L/h/kg, so the median body weight of each subgroup is their ratio. The virtual subjects draw weight log-normally around that median (SD 0.15 on the log scale) and postmenstrual age uniformly over a range that fits the subgroup’s gestational and postnatal age definition.
set.seed(2020)

# Median weight of each Table 4 subgroup = median CL (L/h) / median CL (L/h/kg).
subgroups <- tibble::tribble(
  ~subgroup, ~cl_lh, ~cl_lhkg, ~page_lo, ~page_hi,
  "Extreme preterm neonates", 0.238, 0.192, 29, 33,
  "Preterm neonates", 0.465, 0.220, 33, 39,
  "Full-term neonates", 0.673, 0.217, 37.5, 44,
  "Younger infants", 1.58, 0.299, 44, 66,
  "Intermediate infants", 2.46, 0.336, 66, 92,
  "Older infants", 3.83, 0.368, 92, 144
) |>
  mutate(wt_med = cl_lh / cl_lhkg)

# Table 4 dose levels (mg/kg) by subgroup. The extreme preterm and preterm
# neonates only report a high-dose arm.
arms <- tibble::tribble(
  ~subgroup, ~level, ~mgkg,
  "Extreme preterm neonates", "High", 10,
  "Preterm neonates", "High", 12.5,
  "Full-term neonates", "Low", 10,
  "Full-term neonates", "High", 12.5,
  "Younger infants", "Low", 12.5,
  "Younger infants", "High", 15,
  "Intermediate infants", "Low", 12.5,
  "Intermediate infants", "High", 15,
  "Older infants", "Low", 12.5,
  "Older infants", "High", 15
) |>
  left_join(subgroups, by = "subgroup") |>
  mutate(treatment = paste0(subgroup, ", ", level, " (", mgkg, " mg/kg)"))

n_per_arm <- 150
obs_times <- c(0, 0.1, 0.2, 0.25, 0.35, 0.5, 0.75, 1, 1.5, 2, 3, 4, 5, 6)

subjects <- arms |>
  slice(rep(seq_len(n()), each = n_per_arm)) |>
  mutate(
    id = seq_len(n()),
    WT = wt_med * exp(rnorm(n(), 0, 0.15)),
    PAGE = runif(n(), page_lo, page_hi),
    PLACEBO = 0,
    amt = mgkg * WT
  )

dose_rows <- subjects |>
  transmute(
    id, treatment, WT, PAGE, PLACEBO,
    time = 0, evid = 1, amt, dur = 0.25, cmt = "central"
  )
obs_rows <- subjects |>
  select(id, treatment, WT, PAGE, PLACEBO) |>
  tidyr::crossing(time = obs_times) |>
  mutate(evid = 0, amt = 0, dur = 0, cmt = "central")
events <- bind_rows(dose_rows, obs_rows) |>
  arrange(id, time, desc(evid))
stopifnot(max(table(subjects$treatment)) <= 200)
Simulation
mod <- readModelDb("Hammer_2020_acetaminophen")
sim <- rxode2::rxSolve(
  mod,
  events = events,
  keep = c("treatment", "WT"),
  returnType = "data.frame"
)
#> ℹ parameter labels from comments will be replaced by 'label()'
Replicate published figures
Figure 4: clearance versus postmenstrual age
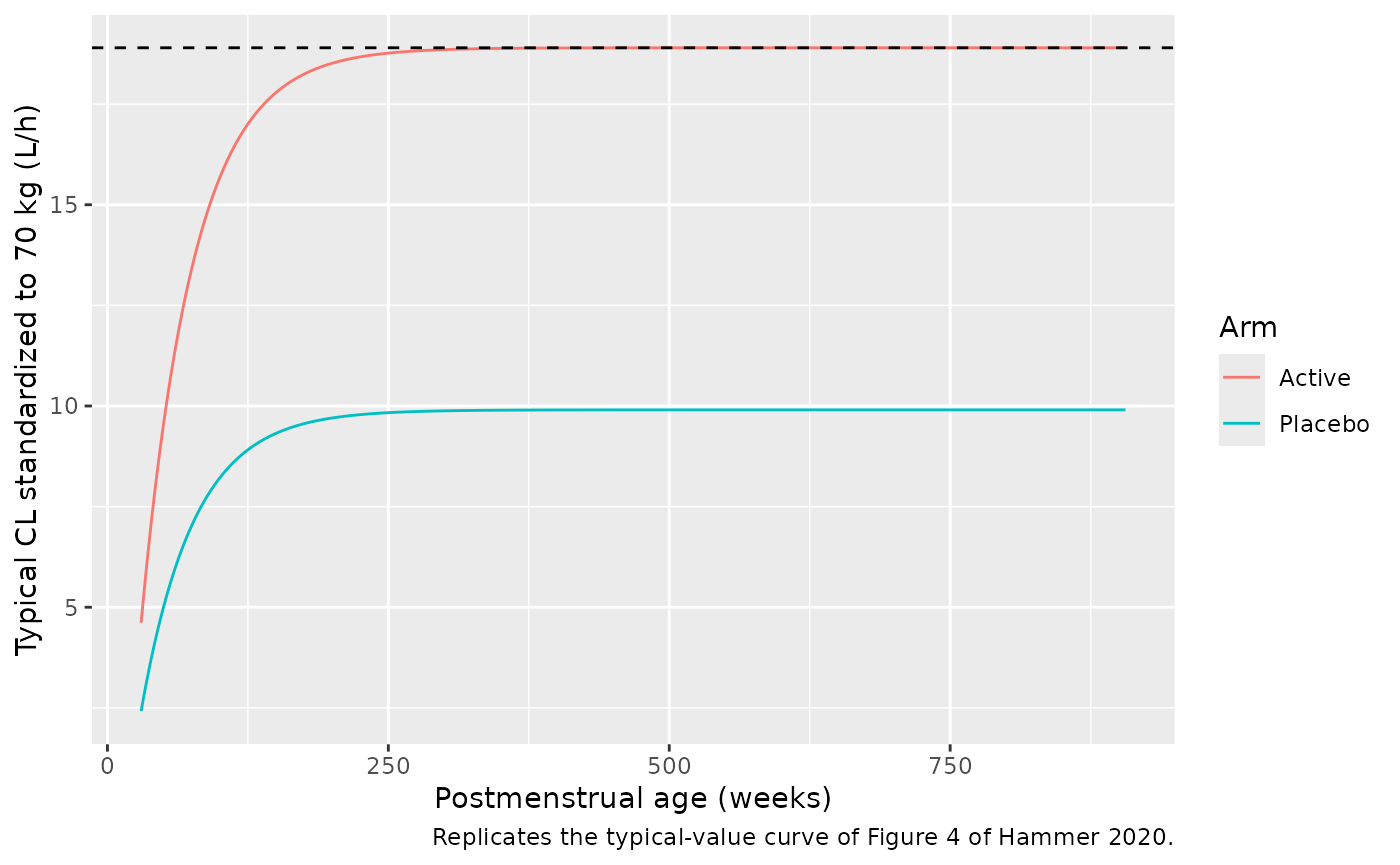
Figure 4 shows the sigmoidal rise of clearance, standardized to 70 kg, towards a plateau of 18.9 L/h in children and adolescents. The typical curve follows directly from the Table 3 maturation function.
e <- rxode2::rxode(mod)$theta
#> ℹ parameter labels from comments will be replaced by 'label()'
fig4 <- tibble(PAGE = seq(30, 906, by = 2)) |>
  mutate(
    fmat = 1 - e[["e_page_cl"]] * exp(-(PAGE - 40) * log(2) / e[["thalf_cl"]]),
    Active = exp(e[["lcl"]]) * fmat,
    Placebo = Active * e[["e_placebo_cl"]]
  ) |>
  tidyr::pivot_longer(c(Active, Placebo), names_to = "Arm", values_to = "cl70")

ggplot(fig4, aes(PAGE, cl70, colour = Arm)) +
  geom_line() +
  geom_hline(yintercept = exp(e[["lcl"]]), linetype = "dashed") +
  labs(
    x = "Postmenstrual age (weeks)",
    y = "Typical CL standardized to 70 kg (L/h)",
    caption = "Replicates the typical-value curve of Figure 4 of Hammer 2020."
  )
# PMA at which fmat reaches a fraction f of the adult value:
# 1 - 0.611 * exp(-(PMA - 40) ln2 / 32.6) = f
pma_at <- function(f) 40 + e[["thalf_cl"]] * log(e[["e_page_cl"]] / (1 - f)) / log(2)
milestones <- c(`fmat at 40 weeks` = 1 - e[["e_page_cl"]], `PMA at 50%` = pma_at(0.5), `PMA at 90%` = pma_at(0.9))
round(milestones, 2)
#> fmat at 40 weeks       PMA at 50%       PMA at 90%
#>             0.39            49.43           125.12
The maturation function starts at 39% of the adult value at 40 weeks, passes 50% at about 49 weeks and 90% at about 125 weeks (about 1.6 years postnatal). This matches Figure 4, which shows clearance levelling off from roughly 2 years onwards.
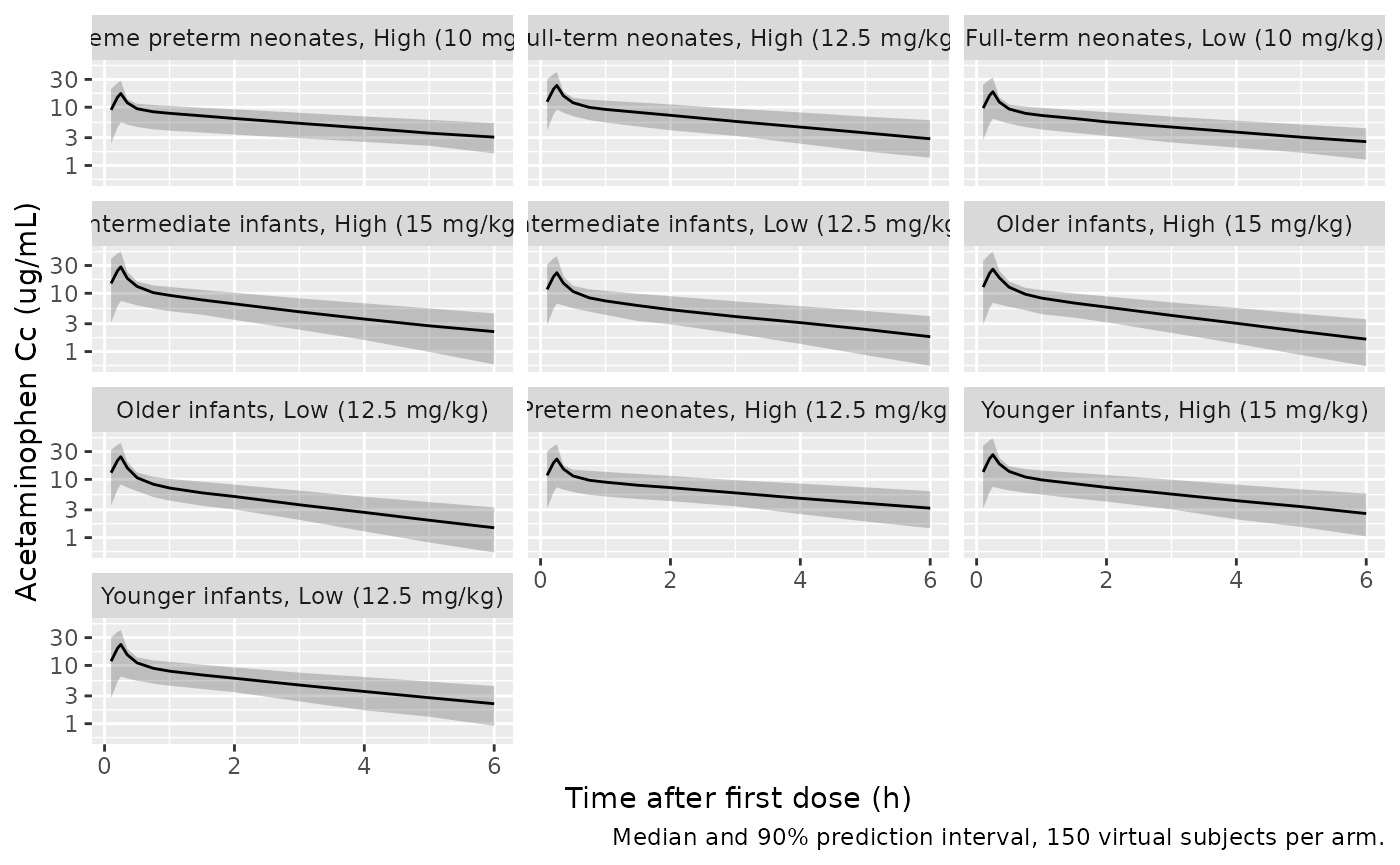
First-dose profiles by subgroup
# Drop the pre-dose sample only for the log-scale plot (PKNCA below keeps it).
sim[sim$time != 0, ] |>
  group_by(treatment, time) |>
  summarise(
    Q05 = quantile(Cc, 0.05),
    Q50 = median(Cc),
    Q95 = quantile(Cc, 0.95),
    .groups = "drop"
  ) |>
  ggplot(aes(time, Q50)) +
  geom_ribbon(aes(ymin = Q05, ymax = Q95), alpha = 0.25) +
  geom_line() +
  facet_wrap(~treatment, ncol = 3) +
  scale_y_log10() +
  labs(
    x = "Time after first dose (h)",
    y = "Acetaminophen Cc (ug/mL)",
    caption = "Median and 90% prediction interval, 150 virtual subjects per arm."
  )
PKNCA validation
Table 4 reports, per subgroup and dose level, the median Cmax and AUCtau of the first dose (tau = 6 h), derived from the individual post hoc parameters. The same quantities are computed here with PKNCA from the virtual cohort.
sim_nca <- sim |>
  filter(!is.na(Cc)) |>
  select(id, time, Cc, treatment)

conc_obj <- PKNCA::PKNCAconc(sim_nca, Cc ~ time | treatment + id)
dose_obj <- PKNCA::PKNCAdose(
  events |> filter(evid == 1) |> select(id, time, amt, treatment),
  amt ~ time | treatment + id
)
intervals <- data.frame(start = 0, end = 6, cmax = TRUE, auclast = TRUE)
nca_res <- PKNCA::pk.nca(
  PKNCA::PKNCAdata(conc_obj, dose_obj, intervals = intervals)
)
Comparison against Table 4
published <- tibble::tribble(
  ~treatment, ~cmax, ~auclast,
  "Preterm neonates, High (12.5 mg/kg)", 22.8, 43.2,
  "Full-term neonates, Low (10 mg/kg)", 18.3, 34.3,
  "Full-term neonates, High (12.5 mg/kg)", 22.6, 44.6,
  "Younger infants, Low (12.5 mg/kg)", 21.6, 34.8,
  "Younger infants, High (15 mg/kg)", 26.7, 41.2,
  "Intermediate infants, Low (12.5 mg/kg)", 20.8, 30.0,
  "Intermediate infants, High (15 mg/kg)", 29.1, 41.6,
  "Older infants, Low (12.5 mg/kg)", 21.2, 27.2,
  "Older infants, High (15 mg/kg)", 27.9, 38.7
)

cmp <- nlmixr2lib::ncaComparisonTable(
  simulated = nca_res,
  reference = published,
  by = "treatment",
  units = c(cmax = "ug/mL", auclast = "ug*h/mL"),
  tolerance_pct = 20
)
knitr::kable(cmp, caption = "Median first-dose NCA: Hammer 2020 Table 4 vs simulation.")| NCA parameter | treatment | Reference | Simulated | % diff |
|---|---|---|---|---|
| Cmax (ug/mL) | Preterm neonates, High (12.5 mg/kg) | 22.8 | 22.3 | -2.1% |
| Cmax (ug/mL) | Full-term neonates, Low (10 mg/kg) | 18.3 | 18.5 | +0.8% |
| Cmax (ug/mL) | Full-term neonates, High (12.5 mg/kg) | 22.6 | 23.7 | +5.0% |
| Cmax (ug/mL) | Younger infants, Low (12.5 mg/kg) | 21.6 | 22.9 | +6.2% |
| Cmax (ug/mL) | Younger infants, High (15 mg/kg) | 26.7 | 26.5 | -0.7% |
| Cmax (ug/mL) | Intermediate infants, Low (12.5 mg/kg) | 20.8 | 22.5 | +8.4% |
| Cmax (ug/mL) | Intermediate infants, High (15 mg/kg) | 29.1 | 28.4 | -2.4% |
| Cmax (ug/mL) | Older infants, Low (12.5 mg/kg) | 21.2 | 24.4 | +15.3% |
| Cmax (ug/mL) | Older infants, High (15 mg/kg) | 27.9 | 26 | -7.0% |
| AUClast (ug*h/mL) | Preterm neonates, High (12.5 mg/kg) | 43.2 | 39.6 | -8.3% |
| AUClast (ug*h/mL) | Full-term neonates, Low (10 mg/kg) | 34.3 | 31.1 | -9.4% |
| AUClast (ug*h/mL) | Full-term neonates, High (12.5 mg/kg) | 44.6 | 39.9 | -10.6% |
| AUClast (ug*h/mL) | Younger infants, Low (12.5 mg/kg) | 34.8 | 33.5 | -3.7% |
| AUClast (ug*h/mL) | Younger infants, High (15 mg/kg) | 41.2 | 40.9 | -0.7% |
| AUClast (ug*h/mL) | Intermediate infants, Low (12.5 mg/kg) | 30 | 30.1 | +0.2% |
| AUClast (ug*h/mL) | Intermediate infants, High (15 mg/kg) | 41.6 | 37.7 | -9.5% |
| AUClast (ug*h/mL) | Older infants, Low (12.5 mg/kg) | 27.2 | 28.8 | +5.7% |
| AUClast (ug*h/mL) | Older infants, High (15 mg/kg) | 38.7 | 33.3 | -13.9% |
The simulated median first-dose Cmax and AUC0-6 match the Table 4 medians in every reported arm within the 20% flagging tolerance (typically within about 10%). The subgroup weights and postmenstrual ages are approximations of cohorts that are not tabulated, so this agreement also covers the maturation function and the allometric scaling across a 10-fold weight range.
sim_med <- as.data.frame(nca_res$result) |>
  filter(PPTESTCD %in% c("cmax", "auclast")) |>
  group_by(treatment, PPTESTCD) |>
  summarise(sim = median(PPORRES), .groups = "drop")
chk <- published |>
  tidyr::pivot_longer(c(cmax, auclast), names_to = "PPTESTCD", values_to = "ref") |>
  inner_join(sim_med, by = c("treatment", "PPTESTCD")) |>
  mutate(pct_diff = 100 * (sim - ref) / ref)
stopifnot(nrow(chk) == 18)
summary(chk$pct_diff)
#>    Min. 1st Qu.  Median    Mean 3rd Qu.    Max.
#> -13.919  -7.948  -1.405  -1.475   3.934  15.285
stopifnot(
  # Structural: a mis-transcribed CL, volume or maturation constant shifts
  # every arm by tens of percent.
  abs(median(chk$pct_diff)) < 10,
  # Envelope: robust to which virtual subjects land in the tails.
  quantile(abs(chk$pct_diff), 0.9) < 25
)
Typical CL, Vss and terminal half-life by subgroup
Table 4 also reports the median post hoc CL (L/h/kg), Vss (L/kg) and terminal half-life. For the median weight of each subgroup and the midpoint of its postmenstrual-age range, the typical values follow in closed form from the model: Vss = Vc + Vp, and the terminal half-life is ln 2 over the smaller eigenvalue of the two-compartment system.
typ <- subgroups |>
  mutate(
    PAGE = (page_lo + page_hi) / 2,
    fmat = 1 - e[["e_page_cl"]] * exp(-(PAGE - 40) * log(2) / e[["thalf_cl"]]),
    cl = exp(e[["lcl"]]) * (wt_med / 70)^0.75 * fmat,
    vc = exp(e[["lvc"]]) * wt_med / 70,
    vp = exp(e[["lvp"]]) * wt_med / 70,
    q = exp(e[["lq"]]) * (wt_med / 70)^0.75,
    k10 = cl / vc,
    k12 = q / vc,
    k21 = q / vp,
    beta = 0.5 * ((k10 + k12 + k21) - sqrt((k10 + k12 + k21)^2 - 4 * k10 * k21)),
    `CL model (L/h/kg)` = cl / wt_med,
    `Vss model (L/kg)` = (vc + vp) / wt_med,
    `t1/2 beta model (h)` = log(2) / beta
  ) |>
  left_join(
    tibble::tribble(
      ~subgroup, ~`Vss Table 4 (L/kg)`, ~`t1/2 beta Table 4 (h)`,
      "Extreme preterm neonates", 0.848, 3.26,
      "Preterm neonates", 0.922, 3.23,
      "Full-term neonates", 0.916, 3.38,
      "Younger infants", 0.948, 2.71,
      "Intermediate infants", 0.926, 2.29,
      "Older infants", 0.952, 2.15
    ),
    by = "subgroup"
  ) |>
  mutate(`CL Table 4 (L/h/kg)` = cl_lhkg)

typ |>
  select(
    Subgroup = subgroup,
    `PMA (weeks)` = PAGE,
    `Weight (kg)` = wt_med,
    `CL Table 4 (L/h/kg)`, `CL model (L/h/kg)`,
    `Vss Table 4 (L/kg)`, `Vss model (L/kg)`,
    `t1/2 beta Table 4 (h)`, `t1/2 beta model (h)`
  ) |>
knitr::kable(digits = 3)| Subgroup | PMA (weeks) | Weight (kg) | CL Table 4 (L/h/kg) | CL model (L/h/kg) | Vss Table 4 (L/kg) | Vss model (L/kg) | t1/2 beta Table 4 (h) | t1/2 beta model (h) |
|---|---|---|---|---|---|---|---|---|
| Extreme preterm neonates | 31.00 | 1.240 | 0.192 | 0.193 | 0.848 | 0.979 | 3.26 | 3.687 |
| Preterm neonates | 36.00 | 2.114 | 0.220 | 0.217 | 0.922 | 0.979 | 3.23 | 3.317 |
| Full-term neonates | 40.75 | 3.101 | 0.217 | 0.235 | 0.916 | 0.979 | 3.38 | 3.099 |
| Younger infants | 55.00 | 5.284 | 0.299 | 0.286 | 0.948 | 0.979 | 2.71 | 2.610 |
| Intermediate infants | 79.00 | 7.321 | 0.336 | 0.348 | 0.926 | 0.979 | 2.29 | 2.213 |
| Older infants | 118.00 | 10.408 | 0.368 | 0.384 | 0.952 | 0.979 | 2.15 | 2.058 |
# Closed-form, no random draws: a structural transcription error moves these
# by far more than the bounds.
cl_diff <- with(typ, `CL model (L/h/kg)` / `CL Table 4 (L/h/kg)` - 1)
hl_diff <- with(typ, `t1/2 beta model (h)` / `t1/2 beta Table 4 (h)` - 1)
stopifnot(
  all(abs(cl_diff) < 0.25),
  all(abs(hl_diff) < 0.30),
  all(abs(typ$`Vss model (L/kg)` / typ$`Vss Table 4 (L/kg)` - 1) < 0.20)
)
The typical CL per kilogram rises from about 0.19 L/h/kg in extreme preterm neonates to about 0.37 L/h/kg in older infants, as in Table 4. The model’s typical Vss is 68.5 L per 70 kg (0.979 L/kg) at every age, 3% to 15% above the Table 4 medians of 0.85 to 0.95 L/kg. Those medians summarize the post hoc (empirical Bayes) estimates of the observed subjects rather than the typical value, so a small offset is expected. The typical terminal half-life falls from about 3.2 h in neonates to about 2.2 h in older infants, as in Table 4.
Assumptions and deviations
-
Residual error scale. Table 3 prints a single ‘Log
residual error’ of 0.221 in a table whose IIV rows are labelled as
variances (omega^2). It is encoded as the log-scale SD
(
expSd = 0.221, about 22% CV), not as a variance (SD 0.470). The Figure 2 prediction-corrected VPC separates the two readings. At 1 to 2 h after the dose its simulated 95th percentile is only about 1.5 times the median, while a residual SD of 0.470 alone would put it at least exp(1.645 x 0.470) = 2.2 times the median, before adding any between-subject variability. Simulating the model with SD 0.221 gives about 1.7 to 1.8. The previous model’s ‘sigma^2 prop (%) 27.9’ is also clearly a CV rather than a variance, so the table’s sigma labels are not reliable. - omega^2 Vc = 0.993 is taken as a variance, as labelled. Its square root (0.9965) is almost the same number, so the SD reading would give nearly the same model.
-
Maturation half-life fixed. The 32.6-week half-life
carries the Table 3 footnote ‘Fixed at previous value derived in.’, and
the citation is missing from the footnote. The value is encoded as
fixed(32.6), and 0.611 as estimated. The Results prose mentions ‘re-estimation of the constant describing age-related changes in CL’, which is taken to refer to 0.611. The previous-model column prints 41.0 weeks, so 32.6 is not that column’s value. -
Placebo multiplier on CL. The placebo control
subjects received saline study drug but had residual acetaminophen
concentrations (Figure 1). The paper estimates their CL as 0.524 times
the active-arm value, but does not describe the dosing that produced
those concentrations. The effect is kept as the
PLACEBOcovariate. For the approved IV regimen, simulate withPLACEBO = 0. - No IIV on CLp or Vp. The current model reports IIV on CL and Vc only (the previous model also had it on CLp and Vp).
- Previous model not extracted. The ‘Previous Model’ column of Table 3 (the Zuppa and Palmer pediatric model) is the predecessor, reported for comparison. Its residual-error rows (‘sigma^2 prop (%) 27.9’, ‘sigma^2 add (mg/L) 168.2’) cannot be encoded without guessing units, and the paper cites no publication for it.
- PK-PD not extracted. The effect-compartment equilibration half-life was ‘fixed to the value estimated’ in a cited reference and is not printed. The pain-score and opioid-rescue analyses are linear regressions and a survival analysis with no reported parameters.
- Table 4 extreme-preterm high-dose cells. The Cmax and AUCtau printed for extreme preterm neonates (20.19 (6.259), 21.2 (4.37-30.9) ug/mL; 27.70 (8.092), 27.2 (14.1-46.3) ug.h/mL) are identical, digit for digit, to the older-infant low-dose cells. They also report an SD and a range that a 2-subject group could not produce, so they appear to be a copy error in the paper and are left out of the NCA comparison. The extreme preterm subgroup is still simulated, and its CL, Vss and half-life are compared.
- Virtual covariates. Subgroup median weights are derived from Table 4 (median CL in L/h divided by median CL in L/h/kg). The postmenstrual-age ranges are assumptions consistent with each subgroup’s definition, because the paper does not tabulate PMA by subgroup.
- Errata. A EuropePMC search (2026-09-25) found no correction notice for doi:10.1002/jcph.1508.