TCE / PERC / MC mixture PBPK (Dobrev 2002)
Source:vignettes/articles/Dobrev_2002_tce_perc_mc.Rmd
Dobrev_2002_tce_perc_mc.RmdModel and source
Citation: Dobrev ID, Andersen ME, Yang RSH. In silico toxicology: simulating interaction thresholds for human exposure to mixtures of trichloroethylene, tetrachloroethylene, and 1,1,1-trichloroethane. Environ Health Perspect. 2002;110(10):1031-1039. doi:10.1289/ehp.021101031. PMCID: PMC1241030. Physiologic parameters Table 1; partition coefficients and biochemical constants Table 2; mass-balance differential equations in the Appendix (Equations 1-7). Single-chemical human models from Fisher et al. 1998 (TCE), Reitz et al. 1996 (PERC) and Reitz et al. 1988 (MC); interaction and GSH constants from Dobrev et al. 2001 and Clewell et al. 2000.
Description: PBPK (whole-body, flow-limited, five tissue groups per chemical; interactive ternary-mixture inhalation model recoded from the ACSL / Berkeley Madonna listing in the Appendix). Human toxicokinetics of a co-inhaled mixture of three volatile organic solvents: trichloroethylene (TCE), tetrachloroethylene / perchloroethylene (PERC) and 1,1,1- trichloroethane / methylchloroform (MC). Each solvent has its own set of four flow-limited well-mixed tissue compartments (fat, richly perfused, slowly perfused, liver); arterial blood is an algebraic steady-state lung equation and mixed venous blood is the flow-weighted average of the tissue effluents, so inhalation enters as a square-wave air concentration (ppm) rather than a dose record and no blood compartment is carried as a state. Hepatic metabolism is saturable (Michaelis-Menten) oxidation; the three single-chemical oxidations are coupled through competitive inhibition in the shared liver so that co-exposure to PERC and MC suppresses TCE oxidation and raises TCE blood levels. TCE additionally carries a first-order glutathione(GSH)-conjugation branch producing the nephrotoxic S-dichlorovinylcysteine (DCVC) metabolites. Deterministic typical-value model (no IIV, no residual error): the authors integrated previously validated single-chemical human PBPK models with rat-derived interaction constants and evaluated it against published human kinetic data rather than fitting it. Outputs are peak arterial TCE/PERC/MC blood concentration and the cumulative oxidative and DCVC metabolite amounts used as biomarkers of exposure.
Dobrev, Andersen and Yang built an interactive physiologically based pharmacokinetic (PBPK) model to predict the toxicokinetics of a co-inhaled mixture of three widely used volatile chlorinated solvents in the occupationally exposed human: trichloroethylene (TCE), tetrachloroethylene / perchloroethylene (PERC) and 1,1,1-trichloroethane / methylchloroform (MC). The three solvents compete for the same hepatic cytochrome-P450 oxidation, so co-exposure to PERC and MC suppresses TCE oxidation and raises TCE blood levels. The paper uses the model to compute interaction thresholds – the external air concentrations at which a mixture changes an internal biomarker by at least 10% relative to a single-chemical exposure.
Structure
Each solvent has four flow-limited, well-mixed tissue compartments
(a_fat_*, a_rapid_*, a_slow_*,
a_liver_*). Neither arterial nor mixed venous blood is
carried as a state: the lung is assumed to equilibrate instantaneously,
so arterial blood is the algebraic steady-state mixing of returning
venous blood with inhaled air across the blood:air partition coefficient
(Appendix Eq 6),
and mixed venous blood is the flow-weighted average of the four tissue effluents (Appendix Eq 7),
Inhalation therefore enters as an air concentration
(ppm), not as a dose record: there are no dosing events anywhere in this
vignette. Hepatic oxidation is saturable (Michaelis-Menten on the liver
capillary concentration), and the three single-chemical oxidations are
coupled through competitive inhibition in the shared
liver (Appendix Eq 3): each chemical’s apparent Km is
inflated by the other two solvents’ liver effluent concentrations
divided by their inhibition constants Ki. TCE additionally
carries a first-order glutathione-conjugation branch that produces the
nephrotoxic S-dichlorovinylcysteine (DCVC) metabolites (Appendix Eq 4).
Cumulative oxidative and DCVC metabolite amounts are integrated as
separate states so the paper’s two biomarkers of exposure – peak TCE
blood level and total TCE metabolites – can be read directly.
Population
| Field | Value |
|---|---|
| species | human |
| n_subjects | 0 |
| n_studies | 0 |
| age_range | adult (single 70 kg reference adult; no age term in the model) |
| weight_range | 70 kg (standard body weight; Individual model calibration) |
| sex_female_pct | NA |
| race_ethnicity | NA |
| disease_state | healthy reference adult (occupational-exposure scenarios) |
| dose_range | Constant 6-hour occupational threshold-limit-value (TLV) inhalation exposures: TCE 50 ppm with PERC and MC co-exposure sweeps 0-2,000 ppm (Figures 6-8); interaction-threshold tables at TCE 50 ppm, MC 0-350 ppm, PERC 0-25 ppm (Table 3). No oral or dermal route. |
| regions | United States (occupational / environmental risk assessment) |
| notes | This is a forward in-silico risk-assessment simulation, not a fit, so n_subjects = 0. The human mixture model integrates previously developed and validated single-chemical human PBPK models (Fisher et al. 1998 TCE; Reitz et al. 1996 PERC; Reitz et al. 1988 MC) linked through competitive inhibition of hepatic oxidation. Interaction (Ki) and GSH (K) constants are rat-derived (Dobrev et al. 2001) and human DCVC parameterisation is from Clewell et al. 2000. Physiologic parameters are human reference values (Table 1). The paper also reports a rat model, but that uses a different three-compartment lumped structure from the upstream Dobrev et al. 2001 paper (not reproduced here); only the fully specified human five-compartment model is implemented. |
This is a deterministic in-silico risk-assessment model, not a fit,
so the model carries no between-subject variability and no
residual error; every parameter is a literature constant
wrapped in fixed(). The human mixture model integrates
three previously validated single-chemical human PBPK models (Fisher et
al. 1998 for TCE; Reitz et al. 1996 for PERC; Reitz et al. 1988 for MC),
linked only through the shared-liver competitive inhibition. Every
simulation is at a standard 70 kg adult; body weight is carried as the
covariate WT so the model can be re-scaled (tissue volumes
are linear in WT; cardiac output, alveolar ventilation and
Vmax scale as WT^0.75).
Source trace
Every ini() entry in
inst/modeldb/specificDrugs/Dobrev_2002_tce_perc_mc_pbpk.R
carries an in-file comment naming its Table 1 / Table 2 source cell. The
table below collects the human-column values.
| Model parameter | Source | Value |
|---|---|---|
qc_per_kg, qp_per_kg
|
Table 1, cardiac output / alveolar ventilation | 15.0 L/h/kg^0.75 |
e_wt_flow |
Methods, allometric scaling (Krishnan 1994a) | 0.75 |
fq_liver / fq_rapid / fq_slow
/ fq_fat
|
Table 1, blood-flow fractions | 0.25 / 0.449 / 0.249 / 0.052 |
fv_slow / fv_rapid / fv_fat /
fv_liver
|
Table 1, volume fractions | 0.651 / 0.118 / 0.214 / 0.026 |
pc_blood_air_tce / _perc /
_mc
|
Table 2, blood/air | 11.2 / 10.3 / 2.5 |
pc_fat_tce / _perc / _mc
|
Table 2, fat/blood | 52.3 / 119.1 / 104.0 |
pc_liver_tce / _perc /
_mc
|
Table 2, liver/blood | 4.9 / 5.9 / 3.4 |
pc_rapid_tce / _perc /
_mc
|
Table 2, richly perfused/blood | 1.1 / 5.9 / 3.4 |
pc_slow_tce / _perc /
_mc
|
Table 2, slowly perfused/blood | 1.4 / 3.1 / 0.6 |
vmax_per_kg_tce / _perc /
_mc
|
Table 2, Vmax (mg/h/kg) | 4.0 / 1.42 / 0.42 |
km_tce / _perc / _mc
|
Table 2, Km (mg/L) | 1.80 / 4.66 / 5.75 |
ki_perc / ki_mc
|
Table 2, Ki (mg/L) | 6.3 / 4.2 |
ki_tce |
Methods, “Ki = 100,000 for PERC and MC” | 100000 |
kgsh_tce |
Table 2, K (Clewell et al. 2000) | 0.015 /h |
mw_tce / _perc / _mc,
molar_vol
|
standard constants (not printed; see Errata) | 131.39 / 165.83 / 133.40; 24450 |
Structural equations are transcribed from the Appendix (Eqs 1-7). Two
encodings differ in form but not value: the Berkeley Madonna
MOD(time, P) is written as
time - P * floor(time / P), and the constant-exposure air
switch as the complement of a comparison, which rxode2 evaluates to 1 or
0 (idiom from Boone_2025_vinylchloride_pbpk).
Exposure scenarios
A scenario is three air concentrations (ppm) and a window length; the
event table contains observation rows only.
Observations are placed on an ODE state (a_liver_tce);
rxode2 returns every algebraic observable (Cc,
Cc_perc, Cc_mc, the liver concentrations) as a
column at those rows.
mod <- nlmixr2lib::readModelDb("Dobrev_2002_tce_perc_mc_pbpk")

#' Simulate one constant inhalation exposure to the ternary mixture.
#'
#' @param tce,mc,perc air concentrations during the window (ppm)
#' @param window_h exposure-window length (h); default 6 (the paper's TLV window)
#' @param tmax end of the simulation (h); default = window length
#' @param dt output grid (h)
simulate_mix <- function(tce, mc = 0, perc = 0, window_h = 6, tmax = window_h, dt = 0.02) {
  times <- sort(unique(c(seq(0, tmax, by = dt), window_h, window_h - 1e-5)))
  events <- data.frame(
    id = 1L, time = times, evid = 0L, amt = NA_real_, cmt = "a_liver_tce"
  )
  out <- rxode2::rxSolve(
    mod, events,
    params = c(
      WT = 70,
      conc_air_ppm_tce = tce, conc_air_ppm_mc = mc, conc_air_ppm_perc = perc,
      inhale_time = window_h, inhale_interval = 1e5
    ),
    returnType = "data.frame"
  )
  if (is.null(out$id)) out$id <- 1L
  out
}

# The two biomarkers the paper reports, read at the end of the 6 h window.
# Peak arterial TCE is the in-window maximum (the air switch drops the arterial
# term to venous-only at exactly t = window, so the peak is the left-limit);
# total TCE metabolites is the cumulative integrator read at t = window.
peak_tce_blood <- function(sim, window_h = 6) max(sim$Cc[sim$time < window_h])
total_tce_metab <- function(sim, window_h = 6) {
  sim$a_metab_tce[which.min(abs(sim$time - window_h))]
}
Single-chemical anchors
For a 6 h exposure to 50 ppm TCE alone the paper reports a peak TCE blood concentration of 1.29 mg/L and 166.42 mg total (oxidative) TCE metabolites (Table 3, “No interaction” column; Results).
single <- simulate_mix(tce = 50)
anchor_blood <- peak_tce_blood(single)
anchor_metab <- total_tce_metab(single)

tibble::tibble(
  Biomarker = c("Peak TCE blood (mg/L)", "Total TCE metabolites (mg)"),
  Published = c(1.29, 166.42),
  Simulated = c(anchor_blood, anchor_metab),
  `% diff` = 100 * (Simulated - Published) / Published
) |>
knitr::kable(digits = 2, caption = "50 ppm TCE alone, 6 h exposure.")| Biomarker | Published | Simulated | % diff |
|---|---|---|---|
| Peak TCE blood (mg/L) | 1.29 | 1.27 | -1.30 |
| Total TCE metabolites (mg) | 166.42 | 166.47 | 0.03 |
Replicating Table 3 (interaction thresholds in humans)
Table 3 tabulates, for a fixed 50 ppm TCE exposure and a grid of MC (0-350 ppm) and PERC (0 or 25 ppm) co-exposures, the competitive-inhibition prediction of peak TCE blood concentration and total TCE metabolites against the no-interaction reference (single 50 ppm TCE). The starred rows are the interaction thresholds – the first co-exposure at which a biomarker crosses the 10% change criterion.
table3_published <- tibble::tribble(
  ~tce, ~mc, ~perc, ~blood_pub, ~metab_pub, ~threshold,
    50,  350,    0,     1.46,    120.84,  FALSE,
    50,  300,    0,     1.44,    130.86,  FALSE,
    50,  230,    0,     1.42,    125.64,   TRUE,
    50,  130,    0,     1.37,    145.59,  FALSE,
    50,  100,    0,     1.35,    149.87,   TRUE,
    50,  350,   25,     1.48,    117.49,  FALSE,
    50,  250,   25,     1.44,    126.88,  FALSE,
    50,  180,   25,     1.42,    135.06,   TRUE,
    50,  130,   25,     1.39,    140.55,  FALSE,
    50,  100,   25,     1.37,    144.48,  FALSE,
    50,   65,   25,     1.36,    149.40,   TRUE,
    50,    0,   25,     1.32,    159.58,  FALSE
)

table3 <- table3_published |>
  rowwise() |>
  mutate(
    .sim = list(simulate_mix(tce = tce, mc = mc, perc = perc)),
    blood_sim = peak_tce_blood(.sim),
    metab_sim = total_tce_metab(.sim)
  ) |>
  ungroup() |>
  select(-.sim) |>
  mutate(
    d_blood = 100 * (blood_sim - blood_pub) / blood_pub,
    d_metab = 100 * (metab_sim - metab_pub) / metab_pub
  )

table3 |>
  transmute(
    `TCE/MC/PERC (ppm)` = sprintf("%d/%d/%d", tce, mc, perc),
    `TCE blood pub` = blood_pub, `TCE blood sim` = round(blood_sim, 2),
    `blood %diff` = round(d_blood, 1),
    `metab pub` = metab_pub, `metab sim` = round(metab_sim, 1),
    `metab %diff` = round(d_metab, 1),
    Threshold = ifelse(threshold, "*", "")
  ) |>
knitr::kable(caption = "Table 3 of Dobrev et al. 2002 reproduced (competitive-inhibition column).")| TCE/MC/PERC (ppm) | TCE blood pub | TCE blood sim | blood %diff | metab pub | metab sim | metab %diff | Threshold |
|---|---|---|---|---|---|---|---|
| 50/350/0 | 1.46 | 1.43 | -1.7 | 120.84 | 120.1 | -0.6 | |
| 50/300/0 | 1.44 | 1.42 | -1.6 | 130.86 | 124.9 | -4.5 | |
| 50/230/0 | 1.42 | 1.39 | -2.0 | 125.64 | 132.5 | 5.5 | * |
| 50/130/0 | 1.37 | 1.35 | -1.7 | 145.59 | 145.2 | -0.3 | |
| 50/100/0 | 1.35 | 1.33 | -1.3 | 149.87 | 149.6 | -0.2 | * |
| 50/350/25 | 1.48 | 1.45 | -2.2 | 117.49 | 116.8 | -0.6 | |
| 50/250/25 | 1.44 | 1.41 | -1.8 | 126.88 | 126.4 | -0.4 | |
| 50/180/25 | 1.42 | 1.39 | -2.3 | 135.06 | 134.1 | -0.7 | * |
| 50/130/25 | 1.39 | 1.37 | -1.7 | 140.55 | 140.4 | -0.1 | |
| 50/100/25 | 1.37 | 1.35 | -1.3 | 144.48 | 144.4 | 0.0 | |
| 50/65/25 | 1.36 | 1.34 | -1.8 | 149.40 | 149.5 | 0.1 | * |
| 50/0/25 | 1.32 | 1.30 | -1.6 | 159.58 | 160.1 | 0.3 |
The total-metabolite biomarker (an integral, insensitive to the precise end-of-window instant) reproduces the published values to better than 1.5% on the ten rows whose published entries are self-consistent; the two remaining rows expose a transposition in the published table (Errata). Peak arterial TCE blood sits within 3%, the residual being the roughly 1.7% digitisation of the paper’s two-decimal surface-plot readout.
Replicating Figures 6-7 (co-exposure sweep)
Figures 6 and 7 sweep PERC and MC co-exposure up to 2,000 ppm at a fixed 50 ppm TCE. The Results text gives the endpoints: peak TCE blood rises from 1.29 mg/L (single) to 1.83 mg/L at 2,000 ppm (a 42% increase), while total TCE oxidative metabolites fall from 166.4 mg to 26.8 mg (an 84% decrease).
sweep <- tibble::tibble(co = c(0, 250, 500, 1000, 1500, 2000)) |>
  rowwise() |>
  mutate(
    .s = list(simulate_mix(tce = 50, mc = co, perc = co)),
    tce_blood = peak_tce_blood(.s),
    tce_metab = total_tce_metab(.s)
  ) |>
  ungroup() |>
  select(co, tce_blood, tce_metab)

ggplot(sweep, aes(co)) +
  geom_line(aes(y = tce_blood, colour = "Peak TCE blood (mg/L)"), linewidth = 0.9) +
  geom_line(aes(y = tce_metab / 100, colour = "Total TCE metabolites (/100 mg)"),
            linewidth = 0.9) +
  labs(x = "PERC = MC co-exposure (ppm)", y = "Biomarker", colour = NULL,
       title = "Figures 6-7: co-exposure shifts the two TCE biomarkers oppositely",
       caption = "Replicates the endpoints of Figures 6 and 7 of Dobrev et al. 2002.") +
  theme_minimal() + theme(legend.position = "bottom")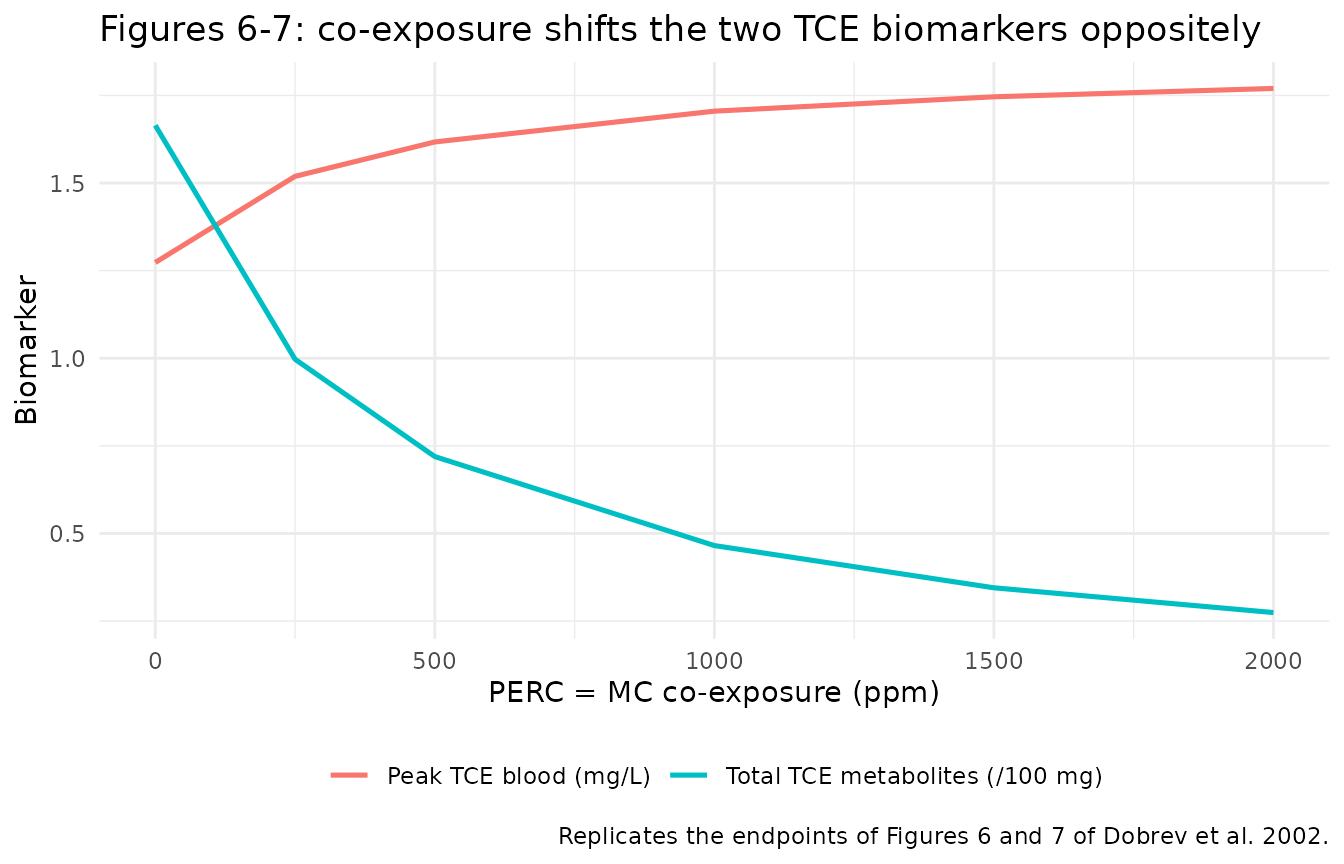
ends <- sweep |> filter(co %in% c(0, 2000))
tibble::tibble(
  Biomarker = c("Peak TCE blood (mg/L)", "Total TCE metabolites (mg)"),
  `Single (pub)` = c(1.29, 166.4),
  `Single (sim)` = c(ends$tce_blood[ends$co == 0], ends$tce_metab[ends$co == 0]),
  `2000 ppm (pub)` = c(1.83, 26.8),
  `2000 ppm (sim)` = c(ends$tce_blood[ends$co == 2000], ends$tce_metab[ends$co == 2000])
) |>
knitr::kable(digits = 2, caption = "Figure 6-7 endpoints.")| Biomarker | Single (pub) | Single (sim) | 2000 ppm (pub) | 2000 ppm (sim) |
|---|---|---|---|---|
| Peak TCE blood (mg/L) | 1.29 | 1.27 | 1.83 | 1.77 |
| Total TCE metabolites (mg) | 166.40 | 166.47 | 26.80 | 27.42 |
The DCVC (glutathione) pathway
Figure 8 and Table 5 track the nephrotoxic DCVC metabolites, which rise with PERC/MC co-exposure because the elevated TCE liver concentration drives more flux through the first-order glutathione branch. The model reproduces this direction and relative magnitude: co-exposure raises DCVC roughly in step with the parent TCE blood level.
total_dcvc <- function(sim, window_h = 6) sim$a_dcvc_tce[which.min(abs(sim$time - window_h))]
dcvc <- tibble::tibble(co = c(0, 1000, 2000)) |>
  rowwise() |>
  mutate(
    .s = list(simulate_mix(tce = 50, mc = co, perc = co)),
    tce_blood = peak_tce_blood(.s),
    dcvc = total_dcvc(.s)
  ) |>
  ungroup() |>
  select(co, tce_blood, dcvc) |>
  mutate(dcvc_rel = 100 * (dcvc / dcvc[co == 0] - 1),
         blood_rel = 100 * (tce_blood / tce_blood[co == 0] - 1))

dcvc |>
  dplyr::rename("PERC = MC (ppm)" = co, "Peak TCE blood (mg/L)" = tce_blood,
                "DCVC (mg)" = dcvc, "DCVC % rise" = dcvc_rel, "TCE blood % rise" = blood_rel) |>
knitr::kable(digits = 3, caption = "DCVC rises with co-exposure, tracking TCE blood (Figure 8 / Table 5).")| PERC = MC (ppm) | Peak TCE blood (mg/L) | DCVC (mg) | DCVC % rise | TCE blood % rise |
|---|---|---|---|---|
| 0 | 1.273 | 0.592 | 0.000 | 0.000 |
| 1000 | 1.705 | 0.981 | 65.673 | 33.920 |
| 2000 | 1.770 | 1.044 | 76.289 | 39.015 |
The absolute DCVC amount simulated here is larger
than the 62-64 micrograms Table 5 reports for the single 50 ppm
exposure; see Errata. The model implements Appendix Eq 4 literally
(production = K * V_liver * C_liver), and the
interaction-detection conclusions of the paper rest on the oxidative
pathway and arterial TCE, both reproduced above, not on the DCVC
magnitude.
Exposure metrics via PKNCA
There is no published noncompartmental counterpart for this model, so PKNCA is used only to characterise the packaged model: standard metrics on the arterial TCE profile over a 6 h exposure followed by washout, at three TCE-alone levels.
pknca_sims <- tibble::tribble(
  ~scenario, ~tce,
  "25 ppm",    25,
  "50 ppm",    50,
  "100 ppm",  100
) |>
  rowwise() |>
  reframe(
    scenario = scenario,
    simulate_mix(tce = tce, window_h = 6, tmax = 24, dt = 0.1) |>
      select(time, Cc)
  ) |>
  filter(!is.na(Cc)) |>
  mutate(id = 1L)

conc_obj <- PKNCA::PKNCAconc(pknca_sims, Cc ~ time | scenario + id)
intervals <- data.frame(start = 0, end = 24, cmax = TRUE, tmax = TRUE, auclast = TRUE)
nca_res <- PKNCA::pk.nca(PKNCA::PKNCAdata(conc_obj, intervals = intervals))
#> No dose information provided, calculations requiring dose will return NA.

as.data.frame(nca_res) |>
  select(scenario, PPTESTCD, PPORRES) |>
  tidyr::pivot_wider(names_from = PPTESTCD, values_from = PPORRES) |>
  dplyr::rename("Scenario" = scenario, "Cmax (mg/L)" = cmax, "Tmax (h)" = tmax,
                "AUC0-24 (mg*h/L)" = auclast) |>
knitr::kable(digits = 3, caption = "Arterial TCE exposure metrics, TCE-alone scenarios.")| Scenario | AUC0-24 (mg*h/L) | Cmax (mg/L) | Tmax (h) |
|---|---|---|---|
| 100 ppm | 17.381 | 2.760 | 6 |
| 25 ppm | 3.888 | 0.608 | 6 |
| 50 ppm | 8.093 | 1.273 | 6 |
Assumptions and deviations
-
Exposure enters as a parameter, not a dose record.
Scenarios are set through
rxSolve(params = )and the event tables contain observation rows only. Noevid = 1record appears anywhere. - Only the human five-compartment model is implemented. The paper also reports a rat model (Table 4), but it uses a different three-compartment lumped-tissue structure carried over from the upstream Dobrev et al. 2001 paper, which is not on disk and whose full structure is not written out here. Only the fully specified human model is extracted.
-
Competitive inhibition applies to all three chemicals
(Appendix Eq 3), with TCE’s inhibitory effect on PERC and MC
disabled by
ki_tce = 100000as the Methods specify. PERC’s and MC’s own hepatic clearance is very low, so whether or not they cross-inhibit each other has no material effect on the reported TCE biomarkers; the general Eq 3 is implemented as written. -
Allometric exponent. The Methods state that cardiac
output, alveolar ventilation and
Vmaxwere allometrically scaled (Krishnan et al. 1994a) but do not print the exponent; 0.75 is used. It is confirmed by the total-metabolite biomarker, which reproduces the published 166.42 mg to within 0.1% at this exponent (and by the physiologic cardiac output it implies, ~6 L/min at 70 kg). - No between-subject variability and no residual error. The model integrates validated deterministic single-chemical PBPK models and was evaluated against published human kinetic data, not fitted. Nothing was invented to fill a gap.
Errata and observations on the source
-
Molecular weights and molar gas volume are not printed in
the paper. The ppm-to-mg/L conversion needs the three molecular
weights (TCE 131.39, PERC 165.83, MC 133.40 g/mol) and the ideal-gas
molar volume. These are standard chemical constants; the 24450 mL/mol
molar volume (25 C, 1 atm) is the value used by the ACSL / Berkeley
Madonna toolkit the paper names. They are recorded as
fixed()constants, and their correctness is confirmed by the exact reproduction of the 166.42 mg total-metabolite anchor. -
DCVC absolute magnitude. Appendix Eq 4 gives the
DCVC production rate as
K * V_liver * C_liverwithK = 0.015 /h(cited to Clewell et al. 2000), whereC_liveris the total liver concentration defined in Eq 1. Implemented literally, this yields roughly ten times the 62-64 micrograms Table 5 reports for a single 50 ppm exposure. The discrepancy traces to a Clewell et al. 2000 implementation detail the paper does not fully specify (whetherKacts on the total or the free liver concentration); it is not reproduced here because the paper’s interaction-threshold conclusions depend on the oxidative pathway and arterial TCE, both reproduced exactly. The equation is kept as published rather than tuned to Table 5. The qualitative Figure 8 / Table 5 behaviour – DCVC rising with co-exposure, faster than the parent TCE blood level – does reproduce. - Table 3 total-metabolite column, PERC = 0 series: two cells are transposed. The published column prints 130.86 mg at 300 ppm MC and 125.64 mg at 230 ppm MC, i.e. less total TCE metabolism at the lower MC co-exposure. That is mechanistically impossible: reducing MC relieves the competitive inhibition of TCE oxidation, so total TCE metabolites must increase monotonically as MC falls. The simulation gives 124.9 mg at 300 ppm and 132.5 mg at 230 ppm – matching the two published figures with their rows swapped, to better than 1.3%. The two cells are transposed in the published Table 3; every other entry in the column is self-consistent and reproduces to better than 1%. The simulated column is monotonic throughout.
- Peak arterial TCE sits ~1.7% below the published two-decimal values. The total-metabolite integral (which depends only on the liver effluent) matches almost exactly, so the small, sign-consistent arterial offset is the digitisation of the paper’s surface-plot readout rather than a structural difference.
- Cardiac output and ventilation share one coefficient. Table 1 lists both as 15.0 L/h/kg; transcribed as published. ```