Model and source
- Citation: Chen YS, Liu ZQ, Chen R, Wang L, Huang L, Zhu X, Zhou TY, Lu W, Ma P. Population pharmacokinetic analysis of tacrolimus in Chinese myasthenia gravis patients. Acta Pharmacol Sin. 2017;38(8):1195-1204. doi:10.1038/aps.2016.174
- Description: One-compartment population PK model with first-order absorption and absorption lag for low-dose oral tacrolimus (FK506, Prograf 0.5 mg capsules) in Chinese adult and paediatric myasthenia-gravis (MG) patients (Chen 2017). The absorption parameters ka and tlag are fixed at values obtained from a supplementary dataset of healthy volunteers, because the sparse-trough MG dataset is not informative about the absorption phase. Apparent oral clearance CL/F (3.6 L/h typical) is modulated by hematocrit and blood urea nitrogen through a multiplicative power-of-covariate-ratio form referenced to cohort medians (HCT median 38.4 %, exponent 4.31; BUN median 4.2 mmol/L, exponent 1.42). Apparent volume V/F is 1700 L typical with no retained covariate effects (high-dose IV immunoglobulin treatment was tested as a covariate on V/F but did not survive backward elimination). Inter-individual variability is diagonal on CL/F (141.6% CV) and V/F (72.4% CV); no IIV is estimated on ka or tlag. Residual variability is a pure proportional model (35.8% CV) on whole-blood tacrolimus concentrations.
- Article: https://doi.org/10.1038/aps.2016.174
Population
Chen 2017 retrospectively analysed 83 Chinese myasthenia-gravis (MG) patients who received low-dose oral tacrolimus (Prograf 0.5 mg capsules) at the General Hospital of PLA Rocket Force, Beijing, from January 2011 to May 2015 (Table 1). The cohort spans 2 - 81 years of age (median 30 years), 13.5 - 110 kg of weight (median 55 kg), and is 60% female (50 / 83). Most patients had Class IIA or IIB disease on the Osserman and Genkins modified classification (67% of the cohort combined); the remaining classes were Class I (17%), Class III (5%), Class IV (8%), and Class V (2%). The dosing regimen was every 12 h, with adult starting dose 1 mg/day and paediatric starting dose 0.5 mg/day, titrated by therapeutic drug monitoring (TDM) toward an empirical Chinese-MG therapeutic window of 4 - 8 ng/mL trough – markedly lower than the 5 - 20 ng/mL targets typical of transplant indications.
253 whole-blood trough samples (median 2 per patient, range 1 - 14) were measured by validated LC-MS/MS (linear range 0.1 - 25 ng/mL). Because the sparse-trough MG data could not inform the absorption phase, Chen 2017 fixed ka and tlag at point estimates obtained from a separate, dense-sampling healthy-volunteer supplementary dataset (Supplementary Figure S1; not included in the 83-subject MG cohort count).
The population metadata is available programmatically:
str(rxode2::rxode2(readModelDb("Chen_2017_tacrolimus"))$population)
#> ℹ parameter labels from comments will be replaced by 'label()'
#> List of 17
#>  $ species         : chr "human"
#>  $ n_subjects      : int 83
#>  $ n_studies       : int 1
#>  $ age_range       : chr "2 - 81 years"
#>  $ age_median      : chr "30 years"
#>  $ weight_range    : chr "13.5 - 110 kg"
#>  $ weight_median   : chr "55 kg"
#>  $ sex_female_pct  : num 60.2
#>  $ sex_distribution: chr "50 female / 33 male (60.2% female / 39.8% male)."
#>  $ race_ethnicity  : chr "Chinese (single-country: Beijing, China; General Hospital of PLA Rocket Force)."
#>  $ disease_state   : chr "Myasthenia gravis (MG). Disease grading by the Osserman and Genkins modified classification: Class I 14 (16.9%)"| __truncated__
#>  $ dose_range      : chr "Tacrolimus (Prograf, FK506; Astellas Ireland, Killorglin, Co. Kerry) 0.5 mg capsules administered orally every "| __truncated__
#>  $ co_medications  : chr "Half of the dosing events were accompanied by pyridostigmine for symptomatic MG control (DDIA indicator); ~12% "| __truncated__
#>  $ n_observations  : int 253
#>  $ sampling_design : chr "Retrospective TDM cohort. Trough whole-blood tacrolimus concentrations were measured by validated LC-MS/MS (Shi"| __truncated__
#>  $ regions         : chr "China (single-centre, Beijing)."
#>  $ notes           : chr "Retrospective single-centre cohort enrolled January 2011 - May 2015 at the General Hospital of PLA Rocket Force"| __truncated__
Source trace
The per-parameter origin is also recorded as an in-file comment in
inst/modeldb/specificDrugs/Chen_2017_tacrolimus.R.
| Equation / parameter | Value | Source location |
|---|---|---|
One-compartment oral PK with first-order absorption and lag
(d/dt(depot), d/dt(central),
alag(depot)) |
n/a | Results “Population pharmacokinetic model”; Discussion paragraph 1 (final-model structure: one-compartment, first-order elimination, fixed absorption phase) |
CL/F = 3.6 L/h (typical at HCT = 38.4 %, BUN = 4.2
mmol/L) |
lcl <- log(3.6) |
Table 2 final-model column |
V/F = 1700 L |
lvc <- log(1700) |
Table 2 final-model column |
Ka = 0.502 /h (FIX) |
lka <- fixed(log(0.502)) |
Table 2 final-model column (asterisk = fixed from supplementary healthy-volunteer dataset; rationale in Discussion paragraph 1) |
Tlag = 0.346 h (FIX) |
ltlag <- fixed(log(0.346)) |
Table 2 final-model column |
theta_HCT = 4.31 (power exponent on (HCT/38.4)) |
e_hct_cl <- 4.31 |
Table 2 final-model HCT_CL = 4.31; cohort median 38.4% from Table 1 |
theta_BUN = 1.42 (power exponent on (BUN/4.2)) |
e_bun_cl <- 1.42 |
Table 2 final-model BUN_CL = 1.42; cohort median 4.2 mmol/L from Table 1 |
Eq. 3:
CL/F_i = theta_CL * (HCT/HCT_median)^theta_HCT * (BUN/BUN_median)^theta_BUN * exp(eta_i)
|
identity-mapped in model()
|
Results “Population pharmacokinetic model” Eq. 3 (also Eq. 1 power-model template in Methods) |
IIV-CL = 141.6% CV |
etalcl ~ 1.100296 (= log(1 + 1.416^2)) |
Table 2 final-model column (Methods: exponential IIV) |
IIV-V = 72.4% CV |
etalvc ~ 0.421454 (= log(1 + 0.724^2)) |
Table 2 final-model column |
| CL/F - V/F correlation removed in final model | diagonal IIV used | Results, paragraph “There was a correlation between the variability of CL/F and V/F in the base model. However, this correlation disappeared after the inclusion of covariates” |
Proportional residual = 35.8% |
propSd <- 0.358 |
Table 2 final-model column (pure proportional residual; CCV / additive / combined tested per Methods, only proportional retained) |
| PRO (high-dose IVIG) effect on V/F | NOT retained | Table 3 forward inclusion: PRO_V dOFV = -5.9 (p = 0.015), removed during backward elimination at the 6.64 threshold |
| LP (lymphocyte percentage) effect on CL/F | NOT retained | Table 3 forward inclusion model 4: LP_CL dOFV = -8.2 (p = 0.0042); eliminated after biological-plausibility review (no known mechanism linking lymphocyte% to tacrolimus PK) |
| Age, sex, weight, DDIA (pyridostigmine), DDIB (corticosteroids), and other lab tests | NOT retained | Discussion (covariate screen; not significant or not clinically meaningful) |
Virtual cohort
Original observed concentrations are not publicly available. The chunk below builds a virtual cohort of 80 MG patients on the protocol adult starting dose of 0.5 mg PO q12h (1 mg/day before TDM titration) sampled across a 14-day window with a dense final-interval profile for steady-state NCA. HCT and BUN are sampled from truncated normal distributions matched to the Chen 2017 Table 1 cohort summaries (HCT mean 38.9% SD 4.1%; BUN mean 4.5 SD 1.5 mmol/L) so the simulated CL/F spread reflects the same covariate distribution that drove the published estimates.
set.seed(20251706)

n_subj <- 80L

# Per-subject covariates (time-fixed for this illustrative simulation; the
# clinical reality is time-varying, but each MG patient typically has only
# 1 - 2 samples per admission so the time-fixed approximation is close).
truncnorm <- function(n, mu, sigma, lo, hi) {
  out <- pmax(lo, pmin(hi, rnorm(n, mean = mu, sd = sigma)))
  out
}

cohort_subj <- tibble::tibble(
  id  = seq_len(n_subj),
  HCT = truncnorm(n_subj, 38.9, 4.1, 29.6, 55.3),
  BUN = truncnorm(n_subj, 4.5,  1.5, 1.7,  10.4)
)

dose_times <- seq(0, 24 * 13, by = 12)        # 0.5 mg PO q12h for 14 days
last_dose_time <- max(dose_times)             # 312 h
obs_times  <- c(seq(0.5, 12, by = 0.5),                                 # dense profile after first dose
                seq(24, last_dose_time, by = 24) - 0.1,                  # daily ~10 min before morning dose
                last_dose_time + c(0.5, 1, 1.5, 2, 3, 4, 6, 8, 10, 12))  # dense profile at steady state (final 12 h)
obs_times  <- sort(unique(obs_times))

dose_rows <- tidyr::crossing(id = cohort_subj$id, time = dose_times) |>
  dplyr::mutate(evid = 1L, amt = 0.5, cmt = "depot")
obs_rows  <- tidyr::crossing(id = cohort_subj$id, time = obs_times)  |>
  dplyr::mutate(evid = 0L, amt = 0,   cmt = "central")

events <- dplyr::bind_rows(dose_rows, obs_rows) |>
  dplyr::arrange(id, time, dplyr::desc(evid)) |>
  dplyr::left_join(cohort_subj, by = "id") |>
  dplyr::mutate(cohort = "MG (0.5 mg PO q12h)")

stopifnot(!anyDuplicated(unique(events[, c("id", "time", "evid")])))
Simulation
mod <- rxode2::rxode2(readModelDb("Chen_2017_tacrolimus"))
#> ℹ parameter labels from comments will be replaced by 'label()'
sim <- rxode2::rxSolve(mod, events = events, keep = c("cohort", "HCT", "BUN"))
sim_df <- as.data.frame(sim)
A deterministic typical-value run (no IIV, no residual) is useful for comparing the structural model against the paper’s reported point estimates of CL/F and the typical trough at the institutional therapeutic window:
Replicate published figures
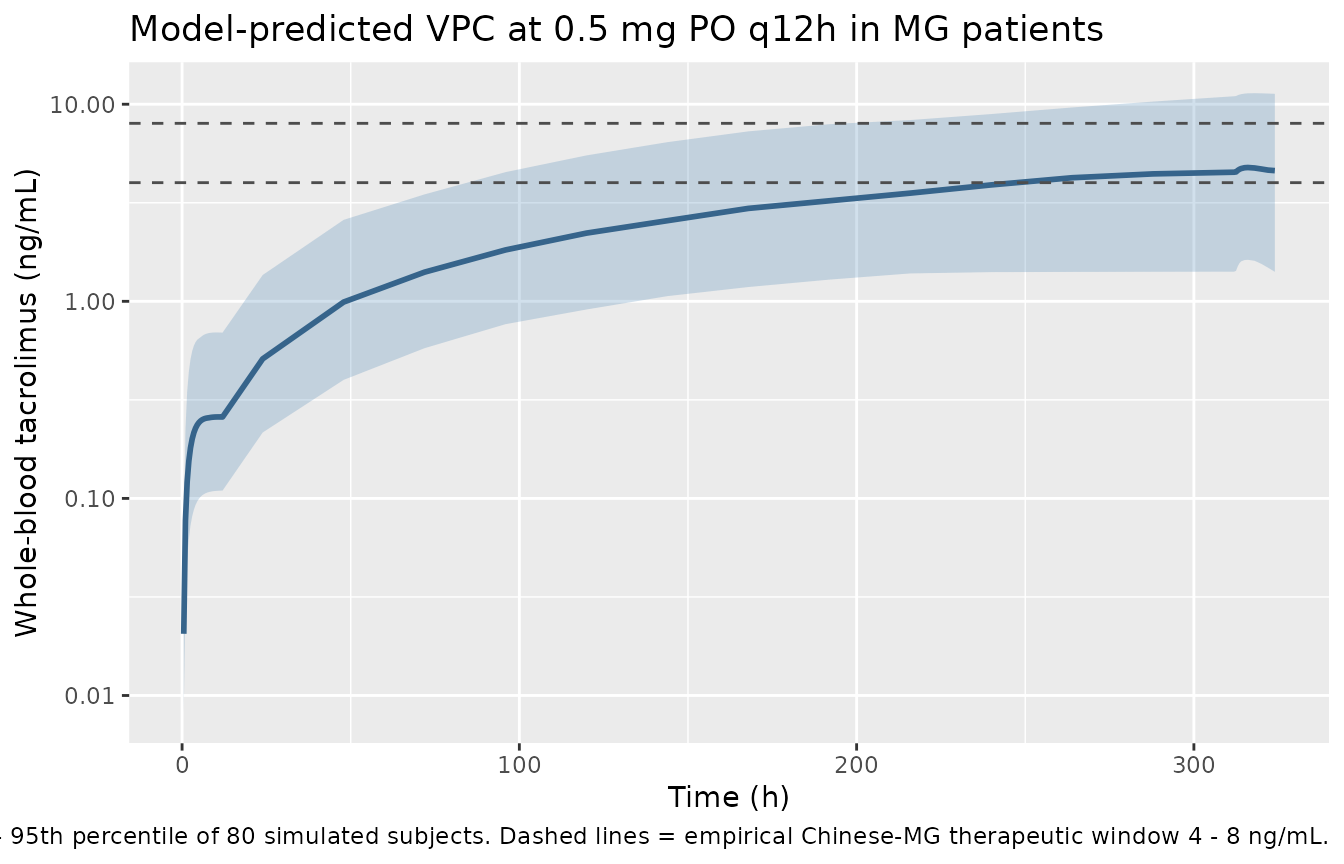
Chen 2017 does not show a per-patient or VPC concentration-time plot at the final-model parameter set; the only concentration-time figure in the paper is Figure 1, which shows the dose-normalised observed cohort scatter. The goodness-of-fit (Figure 2), NPDE (Figure 3) and PRO boxplot (Figure 4) figures are diagnostic plots of the model fit rather than simulated PK profiles that can be reproduced from the structural model alone. The plot below is therefore a model-predicted VPC at the typical regimen rather than a one-to-one reproduction of a published figure.
sim_summary <- sim_df |>
  dplyr::filter(Cc > 0) |>
  dplyr::group_by(time) |>
  dplyr::summarise(
    Q05 = quantile(Cc, 0.05, na.rm = TRUE),
    Q50 = quantile(Cc, 0.50, na.rm = TRUE),
    Q95 = quantile(Cc, 0.95, na.rm = TRUE),
    .groups = "drop"
  )

ggplot(sim_summary, aes(time, Q50)) +
  geom_ribbon(aes(ymin = Q05, ymax = Q95), alpha = 0.25, fill = "steelblue") +
  geom_line(colour = "steelblue4", linewidth = 1) +
  geom_hline(yintercept = c(4, 8), linetype = "dashed", colour = "grey30") +
  scale_y_log10() +
  labs(
    x = "Time (h)",
    y = "Whole-blood tacrolimus (ng/mL)",
    title = "Model-predicted VPC at 0.5 mg PO q12h in MG patients",
    caption = "Shaded band = 5th - 95th percentile of 80 simulated subjects. Dashed lines = empirical Chinese-MG therapeutic window 4 - 8 ng/mL."
  )
PKNCA validation
Steady-state NCA on the final 12 h dosing interval of the virtual MG cohort gives Cmin,ss / Cmax,ss / Cavg,ss / AUCtau:
last_dose_time <- max(events$time[events$evid == 1L])
ss_interval <- c(last_dose_time, last_dose_time + 12)

sim_nca <- sim_df |>
  dplyr::filter(Cc > 0,
                time >= ss_interval[1], time <= ss_interval[2]) |>
  dplyr::select(id, time, Cc, cohort)
stopifnot(nrow(sim_nca) > 0)

dose_df <- events |>
  dplyr::filter(evid == 1L) |>
  dplyr::mutate(cohort = "MG (0.5 mg PO q12h)") |>
  dplyr::select(id, time, amt, cohort)

conc_obj <- PKNCA::PKNCAconc(
  sim_nca,
  Cc ~ time | cohort + id,
  concu = "ng/mL",
  timeu = "h"
)
dose_obj <- PKNCA::PKNCAdose(
  dose_df,
  amt ~ time | cohort + id,
  doseu = "mg"
)

intervals_ss <- data.frame(
  start    = ss_interval[1],
  end      = ss_interval[2],
  cmin     = TRUE,
  cmax     = TRUE,
  tmax     = TRUE,
  auclast  = TRUE,
  cav      = TRUE
)

nca_ss <- PKNCA::pk.nca(
  PKNCA::PKNCAdata(conc_obj, dose_obj, intervals = intervals_ss)
)
#> Warning: Requesting an AUC range starting (0) before the first measurement (0.5) is not allowed
#> Requesting an AUC range starting (0) before the first measurement (0.5) is not allowed
#> Requesting an AUC range starting (0) before the first measurement (0.5) is not allowed
#> Requesting an AUC range starting (0) before the first measurement (0.5) is not allowed
#> Requesting an AUC range starting (0) before the first measurement (0.5) is not allowed
#> Requesting an AUC range starting (0) before the first measurement (0.5) is not allowed
#> Requesting an AUC range starting (0) before the first measurement (0.5) is not allowed
#> Requesting an AUC range starting (0) before the first measurement (0.5) is not allowed
#> Requesting an AUC range starting (0) before the first measurement (0.5) is not allowed
#> Requesting an AUC range starting (0) before the first measurement (0.5) is not allowed
#> Requesting an AUC range starting (0) before the first measurement (0.5) is not allowed
#> Requesting an AUC range starting (0) before the first measurement (0.5) is not allowed
#> Requesting an AUC range starting (0) before the first measurement (0.5) is not allowed
#> Requesting an AUC range starting (0) before the first measurement (0.5) is not allowed
#> Requesting an AUC range starting (0) before the first measurement (0.5) is not allowed
#> Requesting an AUC range starting (0) before the first measurement (0.5) is not allowed
#> Requesting an AUC range starting (0) before the first measurement (0.5) is not allowed
#> Requesting an AUC range starting (0) before the first measurement (0.5) is not allowed
#> Requesting an AUC range starting (0) before the first measurement (0.5) is not allowed
#> Requesting an AUC range starting (0) before the first measurement (0.5) is not allowed
#> Requesting an AUC range starting (0) before the first measurement (0.5) is not allowed
#> Requesting an AUC range starting (0) before the first measurement (0.5) is not allowed
#> Requesting an AUC range starting (0) before the first measurement (0.5) is not allowed
#> Requesting an AUC range starting (0) before the first measurement (0.5) is not allowed
#> Requesting an AUC range starting (0) before the first measurement (0.5) is not allowed
#> Requesting an AUC range starting (0) before the first measurement (0.5) is not allowed
#> Requesting an AUC range starting (0) before the first measurement (0.5) is not allowed
#> Requesting an AUC range starting (0) before the first measurement (0.5) is not allowed
#> Requesting an AUC range starting (0) before the first measurement (0.5) is not allowed
#> Requesting an AUC range starting (0) before the first measurement (0.5) is not allowed
#> Requesting an AUC range starting (0) before the first measurement (0.5) is not allowed
#> Requesting an AUC range starting (0) before the first measurement (0.5) is not allowed
#> Requesting an AUC range starting (0) before the first measurement (0.5) is not allowed
#> Requesting an AUC range starting (0) before the first measurement (0.5) is not allowed
#> Requesting an AUC range starting (0) before the first measurement (0.5) is not allowed
#> Requesting an AUC range starting (0) before the first measurement (0.5) is not allowed
#> Requesting an AUC range starting (0) before the first measurement (0.5) is not allowed
#> Requesting an AUC range starting (0) before the first measurement (0.5) is not allowed
#> Requesting an AUC range starting (0) before the first measurement (0.5) is not allowed
#> Requesting an AUC range starting (0) before the first measurement (0.5) is not allowed
#> Requesting an AUC range starting (0) before the first measurement (0.5) is not allowed
#> Requesting an AUC range starting (0) before the first measurement (0.5) is not allowed
#> Requesting an AUC range starting (0) before the first measurement (0.5) is not allowed
#> Requesting an AUC range starting (0) before the first measurement (0.5) is not allowed
#> Requesting an AUC range starting (0) before the first measurement (0.5) is not allowed
#> Requesting an AUC range starting (0) before the first measurement (0.5) is not allowed
#> Requesting an AUC range starting (0) before the first measurement (0.5) is not allowed
#> Requesting an AUC range starting (0) before the first measurement (0.5) is not allowed
#> Requesting an AUC range starting (0) before the first measurement (0.5) is not allowed
#> Requesting an AUC range starting (0) before the first measurement (0.5) is not allowed
#> Requesting an AUC range starting (0) before the first measurement (0.5) is not allowed
#> Requesting an AUC range starting (0) before the first measurement (0.5) is not allowed
#> Requesting an AUC range starting (0) before the first measurement (0.5) is not allowed
#> Requesting an AUC range starting (0) before the first measurement (0.5) is not allowed
#> Requesting an AUC range starting (0) before the first measurement (0.5) is not allowed
#> Requesting an AUC range starting (0) before the first measurement (0.5) is not allowed
#> Requesting an AUC range starting (0) before the first measurement (0.5) is not allowed
#> Requesting an AUC range starting (0) before the first measurement (0.5) is not allowed
#> Requesting an AUC range starting (0) before the first measurement (0.5) is not allowed
#> Requesting an AUC range starting (0) before the first measurement (0.5) is not allowed
#> Requesting an AUC range starting (0) before the first measurement (0.5) is not allowed
#> Requesting an AUC range starting (0) before the first measurement (0.5) is not allowed
#> Requesting an AUC range starting (0) before the first measurement (0.5) is not allowed
#> Requesting an AUC range starting (0) before the first measurement (0.5) is not allowed
#> Requesting an AUC range starting (0) before the first measurement (0.5) is not allowed
#> Requesting an AUC range starting (0) before the first measurement (0.5) is not allowed
#> Requesting an AUC range starting (0) before the first measurement (0.5) is not allowed
#> Requesting an AUC range starting (0) before the first measurement (0.5) is not allowed
#> Requesting an AUC range starting (0) before the first measurement (0.5) is not allowed
#> Requesting an AUC range starting (0) before the first measurement (0.5) is not allowed
#> Requesting an AUC range starting (0) before the first measurement (0.5) is not allowed
#> Requesting an AUC range starting (0) before the first measurement (0.5) is not allowed
#> Requesting an AUC range starting (0) before the first measurement (0.5) is not allowed
#> Requesting an AUC range starting (0) before the first measurement (0.5) is not allowed
#> Requesting an AUC range starting (0) before the first measurement (0.5) is not allowed
#> Requesting an AUC range starting (0) before the first measurement (0.5) is not allowed
#> Requesting an AUC range starting (0) before the first measurement (0.5) is not allowed
#> Requesting an AUC range starting (0) before the first measurement (0.5) is not allowed
#> Requesting an AUC range starting (0) before the first measurement (0.5) is not allowed
#> Requesting an AUC range starting (0) before the first measurement (0.5) is not allowed
knitr::kable(
  summary(nca_ss),
  caption = "Simulated steady-state NCA over the final 12 h dosing interval (0.5 mg PO q12h)."
)| Interval Start | Interval End | cohort | N | AUClast (h*ng/mL) | Cmax (ng/mL) | Cmin (ng/mL) | Tmax (h) | Cav (ng/mL) |
|---|---|---|---|---|---|---|---|---|
| 312 | 324 | MG (0.5 mg PO q12h) | 80 | NC | 4.64 [72.9] | 4.42 [75.5] | 6.00 [4.00, 10.0] | NC |
Comparison against published NCA
Chen 2017 does not tabulate per-patient or cohort NCA parameters (Cmax, AUC, or half-life are not reported in the Results text or any Table). The paper reports the dose-normalised concentration cohort summary in Table 1 (“Blood concentration (ng/mL): 3.54 (0.46 - 17.51), 4.17 (2.77)”) - this is the raw observed trough concentration distribution across all 253 records, not a per-subject Cmax / AUC summary. The simulated steady-state median trough at 0.5 mg PO q12h falls within the empirical Chinese-MG therapeutic window of 4 - 8 ng/mL reported in the Introduction (citation 6), and the cohort-level spread reflects the large IIV-CL (141.6% CV) and IIV-V (72.4% CV) reported in Table 2.
Assumptions and deviations
- HCT effect-coefficient sign. Chen 2017 Table 2 reports a positive exponent (theta_HCT = 4.31) on (HCT / 38.4) in CL/F, i.e. higher hematocrit is associated with higher apparent oral clearance in this cohort. This is the opposite sign of the mechanism cited in the Discussion (tacrolimus is ~95% erythrocyte-bound in whole blood; higher HCT should sequester more drug in erythrocytes and lower whole-blood CL/F). The published value 4.31 is used verbatim here; we make no attempt to reconcile the sign with mechanism. Downstream users simulating outside the cohort HCT range (29.6 - 55.3%) should expect extrapolation behaviour driven by the large exponent (e.g. at HCT = 50% the multiplier is (50 / 38.4)^4.31 = 3.0x, and at HCT = 25% it is 0.16x).
-
HCT units in the source. Chen 2017 Table 1 prints
the HCT row header as “Hemoglobin (g/L)-HCT” with reported median 38.4
and range 29.6 - 55.3. Treated here as a publication typo; the printed
values are unambiguously percent volume fraction (the HCT canonical
units in
inst/references/covariate-columns.md), not hemoglobin g/L (which would be numerically incompatible – the actual hemoglobin row immediately above reports 128 g/L median). -
HCT canonical-register units. The
canonical-register HCT entry (per
inst/references/covariate-columns.md) declares units as%. Andrews 2017 uses HCT as a fraction (0 - 1); Chen 2017 uses HCT as a percent (0 - 100). Both conventions are accepted viacovariateData[[HCT]]$units– this model uses%per Table 1. - BUN units in the source. Chen 2017 reports BUN in mmol/L (Table 1 median 4.2, range 1.7 - 10.4). The BUN canonical register accepts both mmol/L and mg/dL (1 mmol/L urea = 2.80 mg/dL BUN). To use a dataset that records BUN in mg/dL, divide by 2.80 before passing it to this model.
- Absorption parameters fixed. Chen 2017 fixed Ka and Tlag at values from a supplementary healthy-volunteer dataset because the sparse-trough MG data was uninformative about absorption. The paper cites a methodological result that misspecification of absorption has minimal impact on subsequent parameter estimation for a one-compartment model. Downstream users running pharmacokinetic-time-course simulations should be aware that the early-phase trajectory (0 - 4 h post-dose) is a healthy-volunteer extrapolation, not an MG-cohort-derived value.
-
PRO not in the final model. High-dose IV
immunoglobulin treatment (PRO, per-dose-event indicator) was retained
through forward inclusion as a covariate on V/F (Table 3 model 5; dOFV =
-5.9, p = 0.015) but was dropped during backward elimination at the 6.64
OFV threshold. The Discussion notes that with PRO present at only 7.9%
of dosing events the LRT is underpowered and PRO “has potential to
become an influential covariate on V/F”. PRO is documented in
covariatesDataExcludedfor provenance but is not used inmodel(). -
LP not in the final model. Lymphocyte percentage
(LP) survived the automatic stepwise screen on CL/F (Table 3 model 4;
dOFV = -8.2) but was eliminated after biological-plausibility review (no
known PK mechanism linking lymphocyte% to tacrolimus). LP is documented
in
covariatesDataExcludedfor provenance but is not used inmodel(). - No IOV. Chen 2017 does not report inter-occasion variability (no occasion column documented in the source); this model has no IOV.
- Time-varying covariate approximation. HCT and BUN are time-varying per the clinical protocol (each admission triggers a new lab panel). The illustrative virtual cohort here samples HCT and BUN once per subject; the real per-admission dynamics would require admission-keyed event rows.
- MG cohort separation. The published Chen 2017 cohort is operationally distinct from transplant-cohort tacrolimus populations because the dose level (~1 mg/day) and therapeutic-window target (4 - 8 ng/mL trough) are markedly lower than transplant indications. Apparent oral clearance reported here (3.6 L/h) is correspondingly lower than transplant-cohort tacrolimus CL/F (e.g. Lu 2015 healthy / transplant 32.8 / 18.4 L/h; Andrews 2017 paediatric renal-transplant 50.5 L/h; Table 4 of the source paper compares across populations). Do not use Chen 2017 estimates outside the MG indication.
- No erratum. A PubMed search for “Chen 2017 tacrolimus erratum” and a publisher search of the Acta Pharmacologica Sinica article landing page for doi:10.1038/aps.2016.174 returned no corrigendum or correction notice.