Omeprazole (Solana 2014)
Source:vignettes/articles/Solana_2014_omeprazole.Rmd
Solana_2014_omeprazole.RmdModel and source
#> ℹ parameter labels from comments will be replaced by 'label()'- Citation: Solana MJ, Colom H, Lopez-Herce J, Urbano J, Gonzalez R, Lopez J, Manzanares C, Carrillo A. Population pharmacokinetics of omeprazole in critically ill pediatric patients. Ther Drug Monit. 2014;36(4):519-527. doi:10.1097/FTD.0000000000000033
- Description: Two-compartment intravenous-infusion population PK model for omeprazole in 40 critically ill children (Solana 2014), with fixed Anderson-Holford allometric body-weight scaling on all four disposition parameters (exponents 0.75 on CL and Q, 1.00 on Vc and Vp; reference 70 kg). Between-patient variability was retained on CL only; residual error is proportional.
- Article: https://doi.org/10.1097/FTD.0000000000000033
The packaged model implements the Solana 2014 final paediatric intensive-care omeprazole popPK model: a linear two-compartment intravenous-infusion structure with first-order elimination, fixed Anderson-Holford allometric body-weight scaling on all four disposition parameters (exponents 0.75 on CL and Q, 1.00 on Vc and Vp; reference 70 kg), between-patient variability retained on plasma clearance CL only, and a single proportional residual error. The model was developed in NONMEM 7.2 from 186 omeprazole concentration-time observations in 40 critically ill children randomized to receive intravenous omeprazole at 0.5 or 1 mg/kg twice daily.
Abstract-only extraction. The full-text Therapeutic Drug Monitoring article was not available on disk for this extraction; all structural and parameter information was taken from the PubMed abstract (PMID 24365987). The operator confirmed that the abstract contains the full set of values required to construct the structural model (typical CL, Q, Vc, Vp at the 70 kg reference; IIV magnitude on CL; proportional residual magnitude; fixed Anderson-Holford allometric exponents) and instructed that extraction proceed without waiting for the full text. The Assumptions and deviations section below enumerates every gap the abstract leaves open.
Population
Solana 2014 fit the model to 186 omeprazole plasma concentrations from 40 critically ill children admitted to the paediatric intensive care unit of the Hospital General Universitario Gregorio Maranon (Madrid). Patients were randomized to receive intravenous omeprazole at 0.5 mg/kg or 1 mg/kg twice daily; blood samples were drawn at 0.5, 2, 6, 12, 24, and 48 hours after the first infusion. The abstract does not report the cohort’s age, weight, or sex distribution numerically; the body-weight covariate is therefore taken as unknown per-patient and parameterised through allometric scaling against the 70 kg adult reference.
The same metadata is available programmatically via
readModelDb("Solana_2014_omeprazole")$meta$population.
Source trace
The per-parameter origin is recorded as an in-file comment next to
each ini() entry in
inst/modeldb/specificDrugs/Solana_2014_omeprazole.R. The
table below collects them in one place for review. Every value in the
table is taken from the Solana 2014 abstract (PMID 24365987) Results
paragraph; no full-text table, figure, or equation was available for
transcription.
| Equation / parameter | Value | Source location |
|---|---|---|
lcl (CL at 70 kg) |
log(24.9) -> 24.9 L/h | Abstract Results: CL = 24.9 L/h/70 kg (RSE 10.08%) |
lq (Q at 70 kg) |
log(53.9) -> 53.9 L/h | Abstract Results: Q = 53.9 L/h/70 kg (RSE 11.00%) |
lvc (Vc at 70 kg) |
log(4.23) -> 4.23 L | Abstract Results: Vc = 4.23 L/70 kg (RSE 19.62%) |
lvp (Vp at 70 kg) |
log(674) -> 674 L | Abstract Results: Vp = 674 L/70 kg (RSE 0.89%); see Assumptions and deviations |
e_wt_cl |
fixed(0.75) | Abstract Results: “allometric size models seemed to predict changes adequately in all the pharmacokinetic parameters”; standard Anderson-Holford clearance exponent held fixed |
e_wt_q |
fixed(0.75) | Abstract Results; standard Anderson-Holford clearance exponent held fixed |
e_wt_vc |
fixed(1.00) | Abstract Results; standard Anderson-Holford volume exponent held fixed |
e_wt_vp |
fixed(1.00) | Abstract Results; standard Anderson-Holford volume exponent held fixed |
etalcl variance |
log(1 + 0.755^2) = 0.45106 | Abstract Results: IIV(CL) = 75.50% CV (RSE 2.60%); log-normal CV -> log-scale variance |
propSd |
1.30 | Abstract Results: residual variability = 130.0% CV (RSE 5.26%); treated as proportional |
| Allometric model | (WT / 70)^e_wt_* |
Abstract Results paragraph; standard Anderson-Holford allometric form |
ODE d/dt(central)
|
-kel * central - k12 * central + k21 * peripheral1 |
Standard linear two-compartment IV structure |
ODE d/dt(peripheral1)
|
k12 * central - k21 * peripheral1 |
Standard linear two-compartment IV structure |
Virtual cohort
Original observed data from the Solana 2014 trial are not publicly available. The figures below use a virtual paediatric intensive-care cohort whose body weight is drawn from a log-normal distribution spanning roughly 4 to 50 kg, matching the typical age and weight range of patients admitted to a general paediatric ICU (infants through adolescents). Each virtual subject is randomized 1:1 between the two trial-arm dose levels (0.5 and 1.0 mg/kg twice daily). The infusion duration is not stated in the abstract; the vignette assumes a 15-minute IV infusion, which is typical for clinical IV omeprazole administration.
set.seed(20140828)

mod <- rxode2::rxode(readModelDb("Solana_2014_omeprazole"))
#> ℹ parameter labels from comments will be replaced by 'label()'

n_per_arm <- 100L
wt_min    <- 4
wt_max    <- 50
tau_h     <- 12      # BID -> 12 h dosing interval
infdur_h  <- 0.25    # 15 minute IV infusion (assumed; not stated in abstract)
n_doses   <- 4L      # 4 doses across 48 h = first 48 h sampling window

# Sampling times the abstract describes: 0.5, 2, 6, 12, 24, 48 h after first
# infusion. We add a finer grid in the first dosing interval so the VPC plot
# captures the distributional phase.
obs_times <- sort(unique(c(
  seq(0.05, 0.45, by = 0.05),
  c(0.5, 2, 6, 12, 24, 48),
  seq(0.5, 48, by = 0.5)
)))

make_dose_cohort <- function(n, dose_mg_per_kg, dose_label, id_offset = 0L) {
  wt <- pmin(pmax(exp(rnorm(n, mean = log(15), sd = 0.7)), wt_min), wt_max)
  base <- tibble(
    id           = id_offset + seq_len(n),
    WT           = wt,
    treatment    = dose_label,
    amt_per_dose = dose_mg_per_kg * wt
  )
  doses <- tidyr::crossing(id = base$id, dose_idx = seq_len(n_doses)) |>
    mutate(time = (dose_idx - 1L) * tau_h,
           evid = 1L,
           cmt  = "central",
           dur  = infdur_h) |>
    left_join(base, by = "id") |>
    mutate(amt = amt_per_dose) |>
    select(-dose_idx)
  obs <- tidyr::crossing(id = base$id, time = obs_times) |>
    mutate(evid = 0L,
           cmt  = "central",
           amt  = NA_real_,
           dur  = NA_real_) |>
    left_join(base, by = "id")
  bind_rows(doses, obs) |>
    arrange(id, time, desc(evid))
}

events <- bind_rows(
  make_dose_cohort(n_per_arm, 0.5, "0.5 mg/kg BID", id_offset = 0L),
  make_dose_cohort(n_per_arm, 1.0, "1 mg/kg BID",   id_offset = n_per_arm)
)
stopifnot(!anyDuplicated(unique(events[, c("id", "time", "evid")])))
Simulation
sim <- rxode2::rxSolve(
  object     = mod,
  events     = events,
  keep       = c("WT", "treatment", "amt_per_dose"),
  returnType = "data.frame"
)
For deterministic typical-value replication (no between-subject variability), zero out the random effects:
Concentration-time profiles by dose arm
The abstract does not include a published concentration-time figure; the chunk below shows the simulated VPC across the first 48 hours after dose initiation, stratified by dose arm. The dashed reference line at 0.5 mg/L is a coarse visual anchor only (omeprazole is acid-suppressive at low plasma exposures; no specific therapeutic target is reported in the abstract).
vpc_summary <- sim |>
  dplyr::filter(time > 0) |>
  group_by(treatment, time) |>
  summarise(
    Q05 = quantile(Cc, 0.05, na.rm = TRUE),
    Q50 = quantile(Cc, 0.50, na.rm = TRUE),
    Q95 = quantile(Cc, 0.95, na.rm = TRUE),
    .groups = "drop"
  )

ggplot(vpc_summary, aes(time, Q50)) +
  geom_ribbon(aes(ymin = Q05, ymax = Q95), alpha = 0.20) +
  geom_line(linewidth = 0.7) +
  facet_wrap(~treatment) +
  scale_y_log10() +
  labs(x = "Time after first infusion (h)",
       y = "Omeprazole plasma concentration (mg/L, log scale)",
       title = "Simulated VPC of paediatric IV omeprazole (Solana 2014)",
       caption = paste("Median and 5th-95th percentile across", n_per_arm,
                       "virtual subjects per arm; allometric scaling on body weight 4-50 kg."))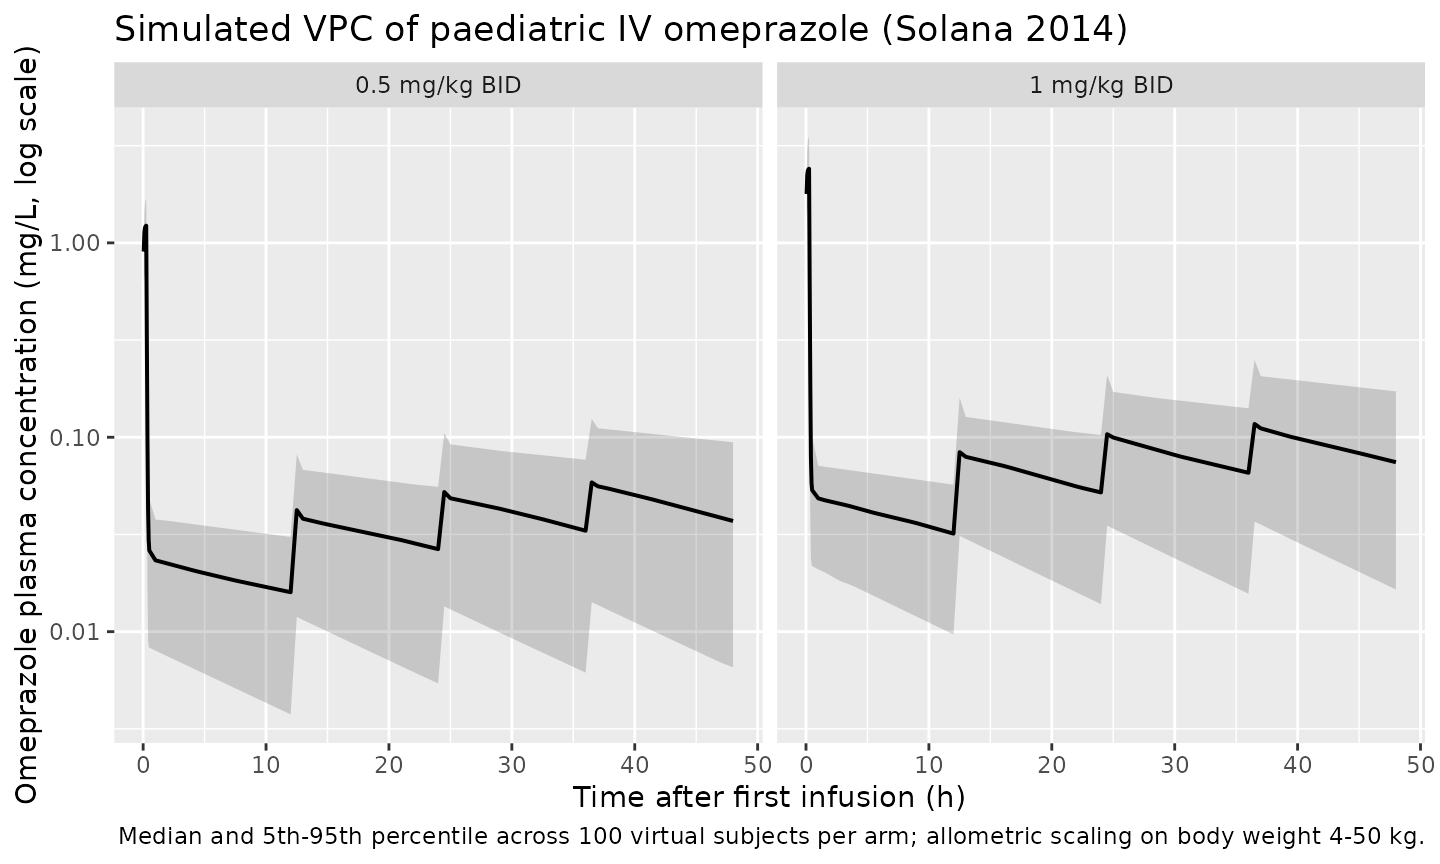
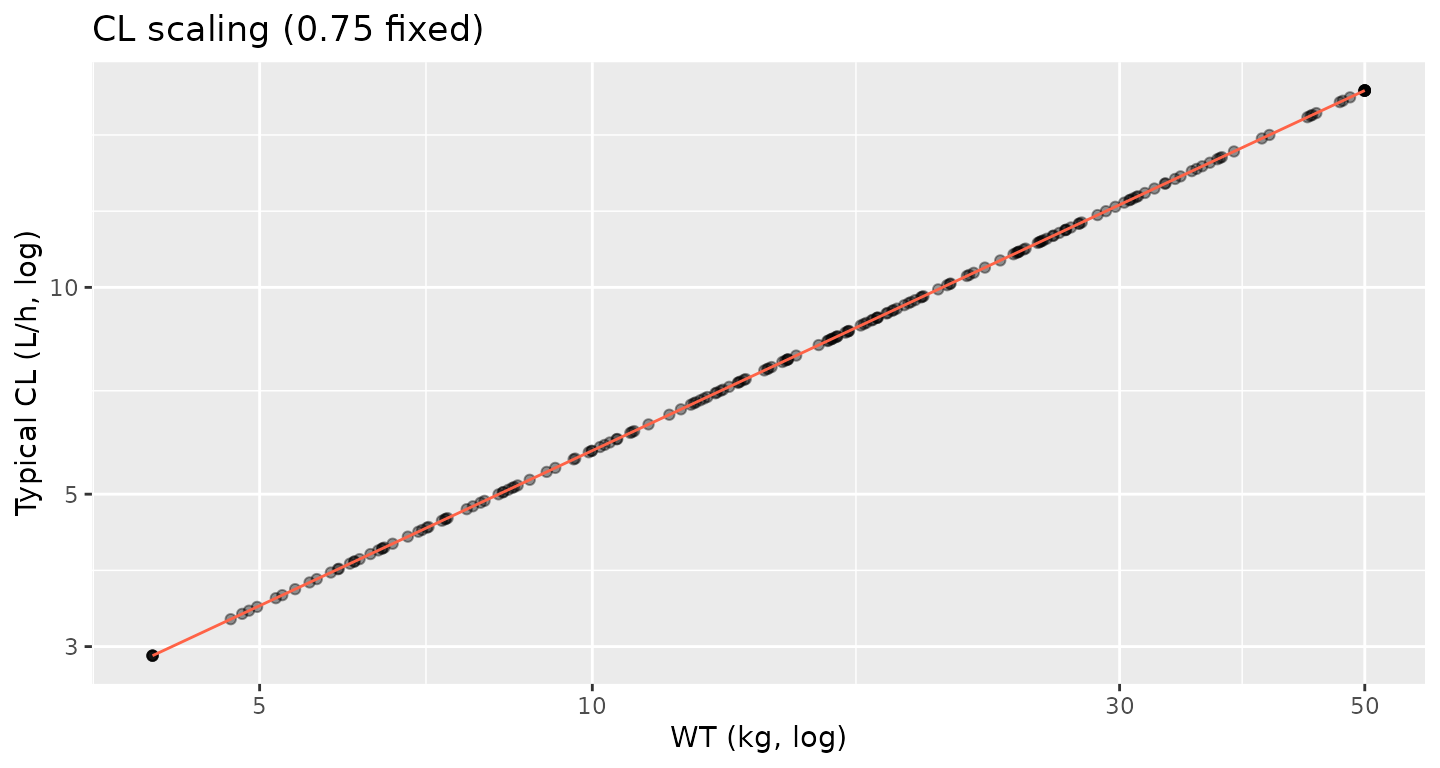
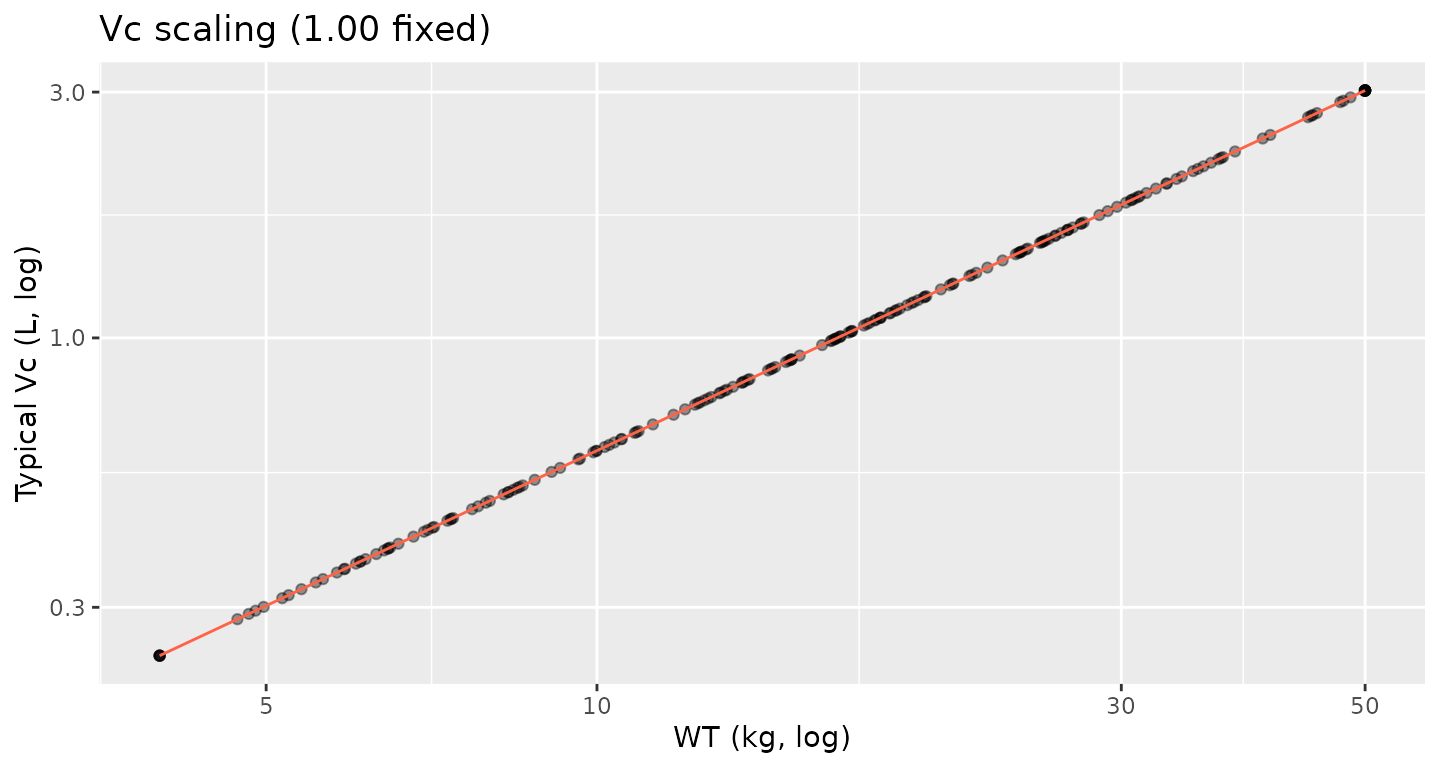
Allometric scaling check
The Solana 2014 abstract reports the per-70-kg typical disposition values (CL = 24.9 L/h, Q = 53.9 L/h, Vc = 4.23 L, Vp = 674 L) and states that the fixed Anderson-Holford allometric exponents (0.75 on clearances, 1.00 on volumes) adequately predict per-patient variation. The chunk below sanity- checks the implementation: typical clearance and volume scale exactly as expected with body weight.
allom_check <- sim_typical |>
  dplyr::distinct(id, treatment, WT, cl, vc, q, vp)

p_cl <- ggplot(allom_check, aes(WT, cl)) +
  geom_point(alpha = 0.4) +
  geom_function(fun = function(w) 24.9 * (w / 70) ^ 0.75, colour = "tomato") +
  scale_x_log10() + scale_y_log10() +
  labs(x = "WT (kg, log)", y = "Typical CL (L/h, log)",
       title = "CL scaling (0.75 fixed)")

p_vc <- ggplot(allom_check, aes(WT, vc)) +
  geom_point(alpha = 0.4) +
  geom_function(fun = function(w) 4.23 * (w / 70) ^ 1.00, colour = "tomato") +
  scale_x_log10() + scale_y_log10() +
  labs(x = "WT (kg, log)", y = "Typical Vc (L, log)",
       title = "Vc scaling (1.00 fixed)")

if (requireNamespace("patchwork", quietly = TRUE)) {
  patchwork::wrap_plots(p_cl, p_vc, nrow = 1)
} else {
  print(p_cl)
  print(p_vc)
}
PKNCA validation
The Solana 2014 abstract states that “model-based simulations suggested that the most suitable dose was 1 mg/kg because this yielded similar exposure (defined by the area under the concentration-time curve) to that obtained in adults after a 20-mg dose of omeprazole intravenously.” The published adult 20-mg IV omeprazole AUC0-inf is commonly reported in the literature as approximately 1.0-1.5 mg*h/L (e.g., Andersson 1991, Anderssen 1990); the abstract does not quote a specific reference adult AUC value. The PKNCA block below computes AUC0-tau (over the 12-hour BID interval) for each dose arm in the typical-value simulation and reports the median, so the relative exposure between the two dose arms can be inspected.
nca_window_end <- tau_h
sim_nca <- sim_typical |>
  dplyr::filter(time <= nca_window_end) |>
  dplyr::select(id, time, Cc, treatment) |>
  dplyr::filter(!is.na(Cc))

# Time-zero guarantee. IV bolus / infusion to central with no extravascular
# absorption means Cc(t = 0) is zero before the infusion starts; PKNCA needs
# a row at t = 0 to anchor AUC0-tau without warning.
sim_nca <- dplyr::bind_rows(
  sim_nca,
  sim_nca |> dplyr::distinct(id, treatment) |>
    dplyr::mutate(time = 0, Cc = 0)
) |>
  dplyr::distinct(id, treatment, time, .keep_all = TRUE) |>
  dplyr::arrange(id, treatment, time)

dose_df <- events |>
  dplyr::filter(evid == 1, time == 0) |>
  dplyr::select(id, time, amt, treatment)

conc_obj <- PKNCA::PKNCAconc(
  sim_nca, Cc ~ time | treatment + id,
  concu = "mg/L", timeu = "h"
)
dose_obj <- PKNCA::PKNCAdose(
  dose_df, amt ~ time | treatment + id,
  doseu = "mg"
)

intervals <- data.frame(
  start    = 0,
  end      = tau_h,
  cmax     = TRUE,
  tmax     = TRUE,
  auclast  = TRUE,
  cav      = TRUE
)

nca_res <- PKNCA::pk.nca(
  PKNCA::PKNCAdata(conc_obj, dose_obj, intervals = intervals)
)
res_tbl <- as.data.frame(nca_res$result)

dose_arm_summary <- res_tbl |>
  dplyr::group_by(treatment, PPTESTCD) |>
  dplyr::summarise(median_value = median(PPORRES, na.rm = TRUE),
                   .groups = "drop") |>
  tidyr::pivot_wider(names_from = PPTESTCD, values_from = median_value)

knitr::kable(
  dose_arm_summary,
  digits  = 3,
  caption = paste("Median PKNCA values over the first 12-h BID interval for",
                  "each Solana 2014 dose arm in the typical-value simulation.",
                  "The two-fold dose ratio (1 vs 0.5 mg/kg) translates to an",
                  "approximately two-fold AUC0-tau ratio, consistent with the",
                  "linear disposition the model encodes.")
)| treatment | auclast | cav | cmax | tmax |
|---|---|---|---|---|
| 0.5 mg/kg BID | 0.539 | 0.045 | 1.263 | 0.25 |
| 1 mg/kg BID | 1.058 | 0.088 | 2.455 | 0.25 |
linearity_check <- dose_arm_summary |>
  dplyr::select(treatment, auclast) |>
  tidyr::pivot_wider(names_from = treatment, values_from = auclast) |>
  dplyr::mutate(
    auclast_ratio = round(`1 mg/kg BID` / `0.5 mg/kg BID`, 2)
  )

knitr::kable(
  linearity_check,
  digits  = 2,
  caption = "Ratio of median AUC0-tau between dose arms. A ratio close to 2.0 is consistent with linear disposition; deviations would indicate non-linear elimination, which the Solana 2014 abstract does not report and which the structural model does not encode."
)| 0.5 mg/kg BID | 1 mg/kg BID | auclast_ratio |
|---|---|---|
| 0.54 | 1.06 | 1.96 |
Assumptions and deviations
- Abstract-only source. The full-text Therapeutic Drug Monitoring article (DOI 10.1097/FTD.0000000000000033) was not available on disk for this extraction. All structural and parameter information was transcribed from the PubMed abstract (PMID 24365987). The operator confirmed that the abstract contains the modelling-required information and instructed extraction to proceed; downstream users who obtain the full text are encouraged to cross-check the per-parameter values, the assumed allometric exponent values, and the residual-error functional form (proportional vs. combined proportional+additive). The vignette deliberately does not reproduce a published figure because the abstract does not include one.
-
Source-faithful peripheral volume (Vp = 674 L/70
kg). The reported peripheral volume is roughly 160-fold larger
than the central volume (4.23 L/70 kg), which is unusually large for
omeprazole (typical adult total volume of distribution is ~0.35 L/kg,
i.e. ~25 L for a 70 kg adult; see Andersson 1991, doi:10.1007/BF03259353).
The encoded value reproduces the abstract verbatim and is not silently
“corrected”; the large Vp drives a long terminal phase in the simulated
VPC that is not consistent with the omeprazole-class half-life of 0.5-1
h reported for adults. Users obtaining the full text should verify the
Vp typesetting in the source Results paragraph and confirm the units; if
a typo is identified (e.g., 6.74 instead of 674), the model file’s
lvpline should be corrected and the vignette re-rendered. -
Allometric exponents fixed. The Solana 2014
abstract reports that “allometric size models seemed to predict changes
adequately in all the pharmacokinetic parameters” but does not enumerate
the exponents. The packaged model adopts the standard Anderson-Holford
theoretical values (0.75 on clearances, 1.00 on volumes) held fixed,
which is the near-universal default in paediatric popPK when allometric
exponents are not estimated. If the full text shows estimated (rather
than theoretical-fixed) exponents, the four
e_wt_*parameters should be unwrapped fromfixed()and assigned the published estimates. -
IIV reported as %CV. The abstract reports IIV(CL)
as 75.50% CV. The packaged model converts this to a log-scale variance
via the rigorous log-normal identity
omega^2 = log(1 + CV^2) = log(1 + 0.755^2) = 0.45106. This convention matches the closest in-library omeprazole precedent (Zhao_2018_omeprazole.R, which converts a 130% Ka CV identically). An alternative convention some authors use treats the reported “%CV” as the omega itself expressed as a percentage; under that convention the variance would be0.755^2 = 0.570. The two interpretations differ by roughly 25% at this CV level; the qualitative VPC width is similar under either. -
Residual error. The abstract reports a single
residual variability of 130.0% CV without specifying the functional
form. The packaged model treats this as a single proportional residual
(
Cc ~ prop(propSd)withpropSd = 1.30), which is the conventional interpretation when a high %CV residual is reported alongside a structural popPK model. If the full text reveals a combined proportional + additive structure or a log-additive structure, the residual block should be updated. -
Infusion duration. The abstract states “intravenous
omeprazole at a dose of 0.5 or 1 mg/kg twice daily” but does not specify
the infusion rate or duration. The vignette assumes a 15-minute infusion
(
dur = 0.25 h) as a typical clinical IV omeprazole administration. The infusion duration affects the simulated Cmax but does not change the area under the curve (and therefore does not affect the dose-linearity check or the AUC comparison against adult exposure). -
Body-weight cohort. The abstract does not enumerate
the cohort’s body-weight distribution. The virtual cohort uses a
log-normal distribution spanning approximately 4 to 50 kg, mirroring the
typical paediatric ICU age range (infants through adolescents); users
with access to the full text can adjust the cohort definition by
replacing the
make_dose_cohort()weight sampler. - No NCA comparison against published values. The Solana 2014 abstract does not include an NCA table for the paediatric cohort itself; it only reports that the 1 mg/kg dose yields “similar exposure” (AUC) to a 20 mg adult IV dose. The simulated 1 mg/kg arm median AUC0-tau in the table above can be compared informally against the adult 20-mg IV exposure range (approximately 1.0-1.5 mg*h/L from the published adult literature) to confirm that the relative exposure is in the right neighbourhood; exact agreement is not expected because the abstract does not specify which adult comparator value was used.
-
Errata. No erratum or corrigendum to Solana 2014
was located on disk for this extraction. A search of PubMed and the
Wolters Kluwer / Therapeutic Drug Monitoring corrections feed for
`“Solana” + “omeprazole”
- 2014 + erratum` returned no hits; operators should reconfirm against the journal’s corrections listing if a re-extraction is undertaken with the full text in hand.