Cytotoxic drugs in pregnancy: docetaxel, paclitaxel, doxorubicin and epirubicin (Janssen 2023)
Source:vignettes/articles/Janssen_2023_pregnancy_cytotoxics.Rmd
Janssen_2023_pregnancy_cytotoxics.RmdModel and source
Janssen 2023 develops a semi-physiological enriched modelling approach: rather than building a whole-body physiologically based PK model, it layers the quantitative gestational physiology of Abduljalil 2012 onto four existing, published, non-pregnant empirical population PK models so that plasma concentrations can be predicted at any gestational age. The paper therefore contributes four independent models, one per cytotoxic drug.
- Article: https://doi.org/10.1007/s40262-023-01263-1 (Clin Pharmacokinet. 2023;62(8):1157-1167; PMC10386937)
model_names <- c(
  docetaxel   = "Janssen_2023_docetaxel",
  paclitaxel  = "Janssen_2023_paclitaxel",
  doxorubicin = "Janssen_2023_doxorubicin",
  epirubicin  = "Janssen_2023_epirubicin"
)

tibble::tibble(
  Drug = names(model_names),
  Model = unname(model_names),
  Description = vapply(
    model_names,
    function(x) rxode2::rxode2(readModelDb(x))$description,
    character(1)
  )
) |>
  dplyr::mutate(Description = substr(Description, 1, 110)) |>
  knitr::kable(caption = "The four models contributed by Janssen 2023.")
#> ℹ parameter labels from comments will be replaced by 'label()'
#> ℹ parameter labels from comments will be replaced by 'label()'
#> ℹ parameter labels from comments will be replaced by 'label()'
#> ℹ parameter labels from comments will be replaced by 'label()'| Drug | Model | Description |
|---|---|---|
| docetaxel | Janssen_2023_docetaxel | Semi-physiological enriched three-compartment population PK model for intravenous docetaxel in pregnant cancer |
| paclitaxel | Janssen_2023_paclitaxel | Semi-physiological enriched three-compartment population PK model for intravenous paclitaxel with saturable el |
| doxorubicin | Janssen_2023_doxorubicin | Semi-physiological enriched two-compartment population PK model for intravenous doxorubicin in pregnant cancer |
| epirubicin | Janssen_2023_epirubicin | Semi-physiological enriched three-compartment population PK model for intravenous epirubicin in pregnant cance |
cat(rxode2::rxode2(readModelDb("Janssen_2023_docetaxel"))$reference)
#> ℹ parameter labels from comments will be replaced by 'label()'
#> Janssen JM, Damoiseaux D, van Hasselt JGC, Amant FCH, van Calsteren K, Beijnen JH, Huitema ADR, Dorlo TPC. Semi-physiological Enriched Population Pharmacokinetic Modelling to Predict the Effects of Pregnancy on the Pharmacokinetics of Cytotoxic Drugs. Clin Pharmacokinet. 2023;62(8):1157-1167. doi:10.1007/s40262-023-01263-1. Non-pregnant base model from Koolen SLW et al. Br J Clin Pharmacol. 2010;69:465-474 (Janssen 2023 reference [13], reprinted in Janssen Table 1). Gestational physiology relations from Abduljalil K et al. Clin Pharmacokinet. 2012;51:365-396 (Janssen 2023 reference [3]), as reprinted in Janssen 2023 Eqs 1-17.
Population
The evaluation data come from a prospective multinational, multicentre study of chemotherapy administered during pregnancy (the INCIP registry; de Haan 2018 Lancet Oncol and Janssen 2021), collected over ten years across 137 institutions. All participants are pregnant women with cancer.
| Docetaxel | Paclitaxel | Epirubicin | Doxorubicin | |
|---|---|---|---|---|
| Patients, n | 9 | 20 | 16 | 22 |
| Cycles, n | 10 | 25 | 22 | 27 |
| EGA (weeks), median (range) | 31.8 (26.1-35.0) | 31.0 (16.7-35.7) | 26.8 (19.0-34.0) | 28.7 (15.0-36.3) |
| BSA (m^2), median (range) | 1.91 (1.66-2.06) | 1.92 (1.74-2.27) | 1.89 (1.58-2.48) | 1.78 (1.56-2.49) |
| Dosing | 100 mg/m^2 | 60, 80, 175 mg/m^2 | 100 mg/m^2 | 25, 50, 60 mg/m^2 |
(Janssen 2023 Table 2.)
Crucially, the structural parameters were not
estimated from these patients. They are the published non-pregnant
base-model estimates (Janssen 2023 Table 1) of Koolen 2010 (docetaxel),
Crombag 2019 (paclitaxel), Joerger 2007 (doxorubicin) and Sandstrom 2006
(epirubicin). The pregnant cohorts above were used only to
evaluate the predictions. The same information is available
programmatically via
readModelDb("Janssen_2023_docetaxel")()$population.
Source trace
Gestational physiology (shared by all four models)
Every relation below is reprinted in Janssen 2023 from Abduljalil
2012 (reference [3]) and is encoded verbatim at the top of each model’s
model() block. EGA is the maternal estimated
gestational age in weeks; EGA = 0 is the non-pregnant
anchor.
| Eq | Quantity | Relation | Units |
|---|---|---|---|
| 1 | Serum albumin | 45.8 - 0.177*EGA - 0.0033*EGA^2 |
g/L |
| 2 | Serum AAG | 0.74 - 0.0088*EGA + 0.0001*EGA^2 |
g/L |
| 3 | Dissociation constant | kD = Cprot(0)*fu(0)/(1 - fu(0)) |
g/L |
| 4 | Unbound fraction | fu = 1/(1 + Cprot(EGA)/kD) |
- |
| 5 | Total clearance | CL = CLR + CLH |
L/h |
| 6 | Renal clearance | CLR(0) * GFR(EGA)/GFR(0) * fu(EGA)/fu(0) |
L/h |
| 7 | GFR | 114 + 3.236*EGA - 0.0572*EGA^2 |
mL/min |
| 8 | Haematocrit | 39.1 - 0.054*EGA - 0.0021*EGA^2 |
% |
| 9 | Hepatic plasma flow | (1 - HCT/100) * 109 |
L/h |
| 10 | Hepatic clearance | QHp*CLint*fu / (QHp + CLint*fu) |
L/h |
| 11 | Intrinsic clearance at EGA 0 | -(CLH(0)*QHp(0)) / (CLH(0)*fu(0) - QHp(0)*fu(0)) |
L/h |
| 12 | Intrinsic clearance | CLint(0) * E(EGA)/E(0) |
L/h |
| 13 | CYP3A4 activity | 100 + 2.9826*EGA - 0.0741*EGA^2 |
% |
| 14 | Volume of distribution | Vbase + (VE - Vbase) * fu/ft |
L |
| 15 | Plasma volume | 2.5 - 0.0223*EGA + 0.0042*EGA^2 - 0.00007*EGA^3 |
L |
| 16 | Total body water | 31.67 + 0.275*EGA + 0.0024*EGA^2 |
L |
| 17 | Extracellular water | 11.86 + 0.0187*EGA + 0.0016*EGA^2 |
L |
Eq 8 carries a deliberate deviation from the printed
paper (quadratic coefficient -0.0021 rather than
the printed -0.0098) and Eq 14’s base volume
Vbase is not stated in the paper. Both are derived
below and are itemised in Assumptions and deviations.
Drug-specific parameters
All values are from Janssen 2023 Table 1 and are fixed()
in ini(), because Janssen 2023 re-uses the published base
models without re-estimating them.
| Parameter | Docetaxel | Paclitaxel | Epirubicin | Doxorubicin |
|---|---|---|---|---|
Protein binding (fu_ref) |
94% (AAG) -> 0.06 | 95% (albumin) -> 0.05 | 77% -> 0.23 | 75% -> 0.25 |
f_renal |
0.06 | 0.06 | 0.10 | 0.05 |
| Metabolism used | CYP3A4 | CYP3A4 (CYP2C8 held fixed) | CYP3A4 (UGT2B7 held fixed) | CYP3A4 |
lcl |
44.1 L/h | (saturable) | 71.7 L/h | 47.6 L/h |
lvc |
8.9 L | 12 L | 13.1 L | 12.3 L |
lq / lvp
|
6.1 L/h / 7.3 L | - | 70.6 L/h / 14.6 L | 60.3 L/h / 421 L |
lq2 / lvp2
|
14.4 L/h / 388 L | 16.8 L/h / 268 L | 17.8 L/h / 776 L | - |
| Saturable terms | - |
VM_EL 33.8 umol/h, KM_EL 0.44 umol/L,
VM_TR 177 umol/h, KM_TR 1.61 umol/L,
k21 1.21 /h |
- | - |
Gestational physiology as encoded
ega <- seq(0, 40, by = 0.5)
phys <- tibble::tibble(
  EGA = ega,
  `Albumin (g/L)`        = 45.8 - 0.177 * ega - 0.0033 * ega^2,
  `AAG (g/L)`            = 0.74 - 0.0088 * ega + 0.0001 * ega^2,
  `GFR (mL/min)`         = 114 + 3.236 * ega - 0.0572 * ega^2,
  `CYP3A4 activity (%)`  = 100 + 2.9826 * ega - 0.0741 * ega^2,
  `Plasma volume (L)`    = 2.5 - 0.0223 * ega + 0.0042 * ega^2 - 0.00007 * ega^3,
  `Extracellular water (L)` = 11.86 + 0.0187 * ega + 0.0016 * ega^2,
  `Total body water (L)` = 31.67 + 0.275 * ega + 0.0024 * ega^2
) |>
  tidyr::pivot_longer(-EGA, names_to = "quantity", values_to = "value")

ggplot(phys, aes(EGA, value)) +
  geom_line(linewidth = 0.7) +
  facet_wrap(~quantity, scales = "free_y") +
  labs(x = "Estimated gestational age (weeks)", y = NULL,
       title = "Gestational physiology relations (Janssen 2023 Eqs 1, 2, 7, 13, 15-17)")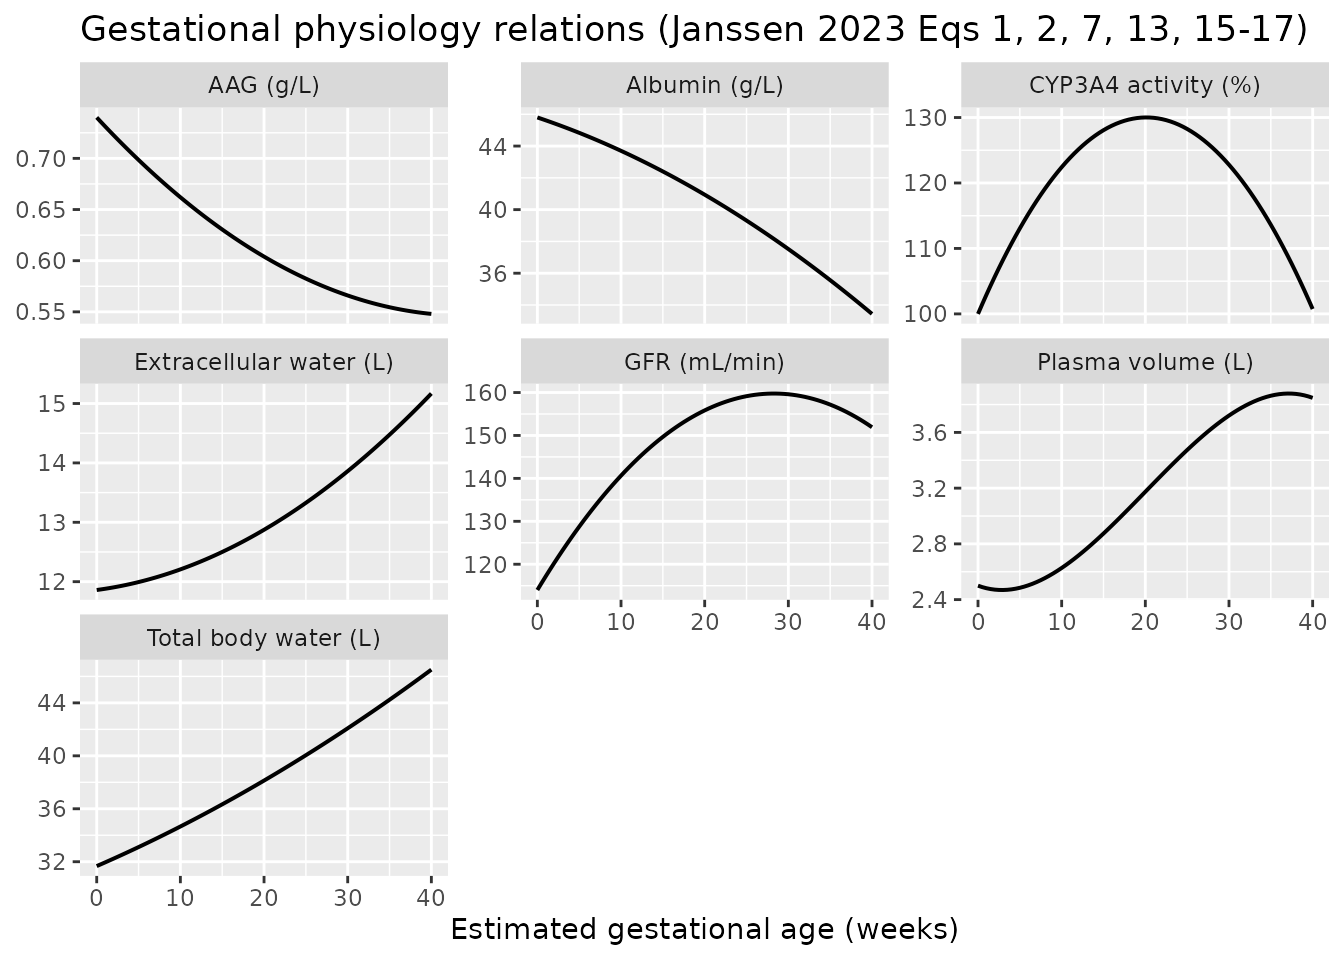
Why Eq 8’s printed haematocrit coefficient cannot be right
hct_printed <- 39.1 - 0.054 * ega - 0.0098 * ega^2
hct_used    <- 39.1 - 0.054 * ega - 0.0021 * ega^2

tibble::tibble(
  EGA = ega,
  `As printed (-0.0098)` = hct_printed,
  `As encoded (-0.0021)` = hct_used
) |>
  tidyr::pivot_longer(-EGA, names_to = "version", values_to = "HCT") |>
  ggplot(aes(EGA, HCT, colour = version)) +
  geom_line(linewidth = 0.8) +
  labs(x = "Estimated gestational age (weeks)", y = "Haematocrit (%)",
       colour = NULL,
       title = "Janssen 2023 Eq 8 as printed vs as encoded")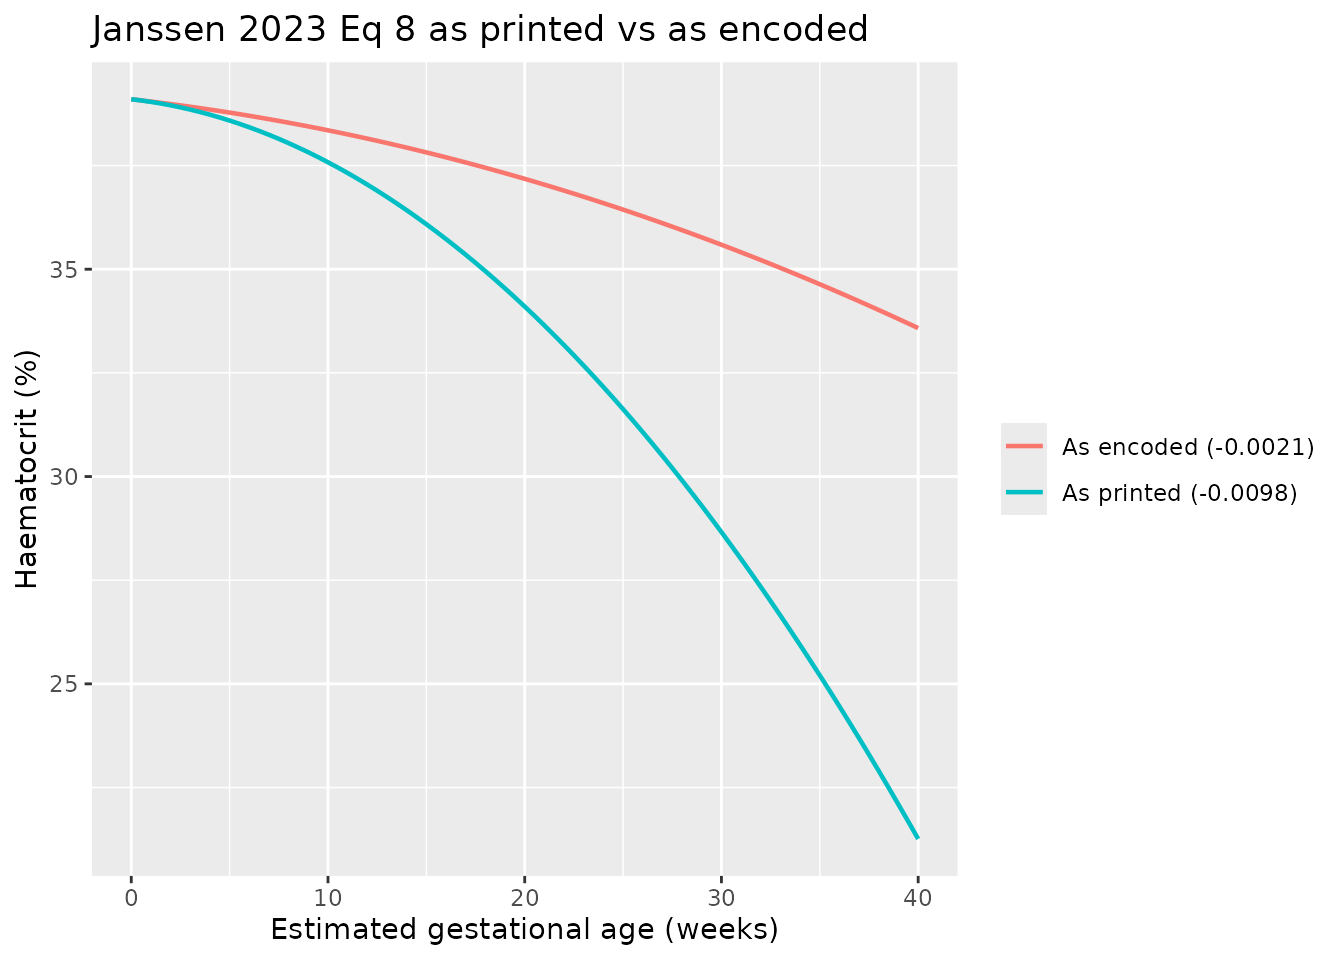
The printed quadratic coefficient drives haematocrit to 21.3% at 40 weeks, which is not compatible with a normal pregnancy (term haematocrit is around 33-34%). Because haematocrit sets hepatic plasma flow through Eq 9, and hepatic plasma flow sets hepatic clearance through Eq 10, the error propagates into every clearance the paper reports. The Table 3 reproduction below is the decisive test: the encoded coefficient reproduces the paper’s own published clearance changes, the printed one misses them by up to 17.7 percentage points.
Virtual cohort and simulation
The paper’s predictions are typical-value
predictions: covariates were excluded and the typical parameter
estimates were used (Janssen 2023 Sect. 2.2 and Sect. 4). The
simulations below therefore use rxode2::zeroRe() and a
single typical subject per gestational age, dosed at the median BSA of
the corresponding cohort (Table 2). IIV is still encoded in each model
file for downstream users, but is deliberately not exercised here.
# Median BSA per cohort (Janssen 2023 Table 2)
bsa <- c(docetaxel = 1.91, paclitaxel = 1.92, epirubicin = 1.89, doxorubicin = 1.78)

# Infusion durations are never reported by Janssen 2023. Docetaxel (1 h) and
# doxorubicin (30 min) were recovered by reproducing Table 4; paclitaxel (3 h)
# and epirubicin (15 min) are read off the shape of Figure 1. See Errata.
infusion <- c(docetaxel = 1, paclitaxel = 3, epirubicin = 0.25, doxorubicin = 0.5)

# Paclitaxel's base model is parameterised in umol / umol/L, so a mg dose must
# be converted with the molar mass. 853.9 g/mol is a physical constant, not a
# model parameter, and is not given by Janssen 2023 (see Errata).
mw_paclitaxel <- 853.9

dose_amount <- function(drug, mg_per_m2) {
  mg <- mg_per_m2 * bsa[[drug]]
  if (drug == "paclitaxel") mg / mw_paclitaxel * 1000 else mg
}

make_events <- function(drug, mg_per_m2, egas, tmax = 48, dt = 0.1) {
  base <- as.data.frame(
    rxode2::et(amt = dose_amount(drug, mg_per_m2),
               dur = infusion[[drug]], cmt = "central") |>
      rxode2::et(seq(0, tmax, by = dt), cmt = "central")
  )
  base$id <- NULL
  out <- lapply(seq_along(egas), function(i) {
    b <- base
    b$id <- i
    b$EGA <- egas[i]
    b$drug <- drug
    b$dose_label <- paste0(mg_per_m2, " mg/m2")
    b$arm <- ifelse(egas[i] == 0, "Non-pregnant",
                      paste0("EGA ", egas[i], " weeks"))
    b
  })
  dplyr::bind_rows(out)
}

simulate_drug <- function(drug, mg_per_m2, egas, tmax = 48, dt = 0.1) {
  ev <- make_events(drug, mg_per_m2, egas, tmax = tmax, dt = dt)
  stopifnot(!anyDuplicated(unique(ev[, c("id", "time", "evid")])))
  mod <- rxode2::zeroRe(readModelDb(model_names[[drug]]))
  rxode2::rxSolve(mod, ev, omega = NA, sigma = NA,
                  keep = c("EGA", "drug", "dose_label", "arm"),
                  returnType = "data.frame")
}
Table 3 reproduction: typical gestational changes in primary PK parameters
This is the paper’s own headline numerical result and the strongest available check on the whole cascade (physiology -> protein binding -> clearance -> volume shells).
tbl3_egas <- c(0, 12, 28, 40)

param_sim <- dplyr::bind_rows(
  simulate_drug("docetaxel",   100, tbl3_egas, tmax = 1, dt = 1),
  simulate_drug("paclitaxel",  175, tbl3_egas, tmax = 1, dt = 1),
  simulate_drug("epirubicin",  100, tbl3_egas, tmax = 1, dt = 1),
  simulate_drug("doxorubicin",  60, tbl3_egas, tmax = 1, dt = 1)
)
#> ℹ parameter labels from comments will be replaced by 'label()'
#> ℹ parameter labels from comments will be replaced by 'label()'
#> ℹ parameter labels from comments will be replaced by 'label()'
#> ℹ parameter labels from comments will be replaced by 'label()'

# One row per (drug, EGA): the derived parameters are time-invariant here.
param_tab <- param_sim |>
  dplyr::group_by(drug, EGA) |>
  dplyr::slice(1) |>
  dplyr::ungroup() |>
  dplyr::mutate(
    CL = dplyr::case_when(drug == "paclitaxel" ~ vmax_el, TRUE ~ cl),
    V1 = vc,
    V2 = dplyr::case_when(drug %in% c("docetaxel", "epirubicin", "doxorubicin") ~ vp,
                          TRUE ~ NA_real_),
    V3 = dplyr::case_when(drug %in% c("docetaxel", "epirubicin", "paclitaxel") ~ vp2,
                          TRUE ~ NA_real_)
  ) |>
  dplyr::select(drug, EGA, CL, V1, V2, V3)

pct_change <- param_tab |>
  dplyr::group_by(drug) |>
  dplyr::mutate(dplyr::across(c(CL, V1, V2, V3), ~ 100 * (.x / .x[EGA == 0] - 1))) |>
  dplyr::ungroup() |>
  dplyr::filter(EGA != 0) |>
  tidyr::pivot_longer(c(CL, V1, V2, V3), names_to = "parameter", values_to = "simulated") |>
  dplyr::filter(!is.na(simulated))

published_tbl3 <- tibble::tribble(
  ~drug,          ~EGA, ~parameter, ~published,
  "docetaxel",      12, "CL",        15.4,
  "docetaxel",      12, "V1",         4.26,
  "docetaxel",      12, "V2",         4.63,
  "docetaxel",      12, "V3",        15.7,
  "docetaxel",      28, "CL",        24.0,
  "docetaxel",      28, "V1",        17.7,
  "docetaxel",      28, "V2",        20.0,
  "docetaxel",      28, "V3",        38.6,
  "docetaxel",      40, "CL",        20.6,
  "docetaxel",      40, "V1",        30.2,
  "docetaxel",      40, "V2",        32.2,
  "docetaxel",      40, "V3",        57.3,
  "paclitaxel",     12, "CL",        16.6,
  "paclitaxel",     12, "V1",         3.82,
  "paclitaxel",     12, "V3",        15.6,
  "paclitaxel",     28, "CL",        26.7,
  "paclitaxel",     28, "V1",        14.9,
  "paclitaxel",     28, "V3",        38.3,
  "paclitaxel",     40, "CL",        24.9,
  "paclitaxel",     40, "V1",        27.8,
  "paclitaxel",     40, "V3",        56.9,
  "doxorubicin",    12, "CL",        10.4,
  "doxorubicin",    12, "V1",         3.79,
  "doxorubicin",    12, "V2",        11.7,
  "doxorubicin",    28, "CL",        16.8,
  "doxorubicin",    28, "V1",        14.7,
  "doxorubicin",    28, "V2",        29.1,
  "doxorubicin",    40, "CL",        16.0,
  "doxorubicin",    40, "V1",        27.6,
  "doxorubicin",    40, "V2",        46.3,
  "epirubicin",     12, "CL",         5.24,
  "epirubicin",     12, "V1",         3.71,
  "epirubicin",     12, "V2",         3.59,
  "epirubicin",     12, "V3",        15.9,
  "epirubicin",     28, "CL",        11.4,
  "epirubicin",     28, "V1",        14.2,
  "epirubicin",     28, "V2",        13.5,
  "epirubicin",     28, "V3",        39.0,
  "epirubicin",     40, "CL",        15.4,
  "epirubicin",     40, "V1",        27.2,
  "epirubicin",     40, "V2",        26.6,
  "epirubicin",     40, "V3",        57.7
)

tbl3_cmp <- published_tbl3 |>
  dplyr::left_join(pct_change, by = c("drug", "EGA", "parameter")) |>
  dplyr::mutate(
    difference = simulated - published,
    flag = ifelse(abs(difference) > 1, "*", "")
  )

tbl3_cmp |>
  dplyr::mutate(
    dplyr::across(c(simulated, published, difference), ~ sprintf("%+.2f", .x))
  ) |>
  dplyr::rename(
    "Drug" = drug, "EGA (weeks)" = EGA, "Parameter" = parameter,
    "Published (%)" = published, "Simulated (%)" = simulated,
    "Difference (pp)" = difference, " " = flag
  ) |>
  knitr::kable(
    align = c("l", "r", "l", "r", "r", "r", "l"),
    caption = paste(
      "Reproduction of Janssen 2023 Table 3 (typical gestational change in",
      "primary PK parameters, % vs non-pregnant). * marks a difference of",
      "more than 1 percentage point."
    )
)| Drug | EGA (weeks) | Parameter | Published (%) | Simulated (%) | Difference (pp) | |
|---|---|---|---|---|---|---|
| docetaxel | 12 | CL | +15.40 | +15.40 | -0.00 | |
| docetaxel | 12 | V1 | +4.26 | +4.26 | +0.00 | |
| docetaxel | 12 | V2 | +4.63 | +4.64 | +0.01 | |
| docetaxel | 12 | V3 | +15.70 | +15.73 | +0.03 | |
| docetaxel | 28 | CL | +24.00 | +24.05 | +0.05 | |
| docetaxel | 28 | V1 | +17.70 | +17.68 | -0.02 | |
| docetaxel | 28 | V2 | +20.00 | +20.04 | +0.04 | |
| docetaxel | 28 | V3 | +38.60 | +38.65 | +0.05 | |
| docetaxel | 40 | CL | +20.60 | +20.59 | -0.01 | |
| docetaxel | 40 | V1 | +30.20 | +30.20 | +0.00 | |
| docetaxel | 40 | V2 | +32.20 | +32.23 | +0.03 | |
| docetaxel | 40 | V3 | +57.30 | +57.29 | -0.01 | |
| paclitaxel | 12 | CL | +16.60 | +16.65 | +0.05 | |
| paclitaxel | 12 | V1 | +3.82 | +3.82 | -0.00 | |
| paclitaxel | 12 | V3 | +15.60 | +15.56 | -0.04 | |
| paclitaxel | 28 | CL | +26.70 | +26.64 | -0.06 | |
| paclitaxel | 28 | V1 | +14.90 | +14.90 | -0.00 | |
| paclitaxel | 28 | V3 | +38.30 | +38.31 | +0.01 | |
| paclitaxel | 40 | CL | +24.90 | +24.87 | -0.03 | |
| paclitaxel | 40 | V1 | +27.80 | +27.81 | +0.01 | |
| paclitaxel | 40 | V3 | +56.90 | +56.87 | -0.03 | |
| doxorubicin | 12 | CL | +10.40 | +10.48 | +0.08 | |
| doxorubicin | 12 | V1 | +3.79 | +3.79 | -0.00 | |
| doxorubicin | 12 | V2 | +11.70 | +11.74 | +0.04 | |
| doxorubicin | 28 | CL | +16.80 | +17.14 | +0.34 | |
| doxorubicin | 28 | V1 | +14.70 | +14.70 | +0.00 | |
| doxorubicin | 28 | V2 | +29.10 | +29.06 | -0.04 | |
| doxorubicin | 40 | CL | +16.00 | +16.68 | +0.68 | |
| doxorubicin | 40 | V1 | +27.60 | +27.64 | +0.04 | |
| doxorubicin | 40 | V2 | +46.30 | +46.30 | -0.00 | |
| epirubicin | 12 | CL | +5.24 | +5.24 | +0.00 | |
| epirubicin | 12 | V1 | +3.71 | +3.71 | +0.00 | |
| epirubicin | 12 | V2 | +3.59 | +3.59 | +0.00 | |
| epirubicin | 12 | V3 | +15.90 | +15.92 | +0.02 | |
| epirubicin | 28 | CL | +11.40 | +11.43 | +0.03 | |
| epirubicin | 28 | V1 | +14.20 | +14.23 | +0.03 | |
| epirubicin | 28 | V2 | +13.50 | +13.47 | -0.03 | |
| epirubicin | 28 | V3 | +39.00 | +39.02 | +0.02 | |
| epirubicin | 40 | CL | +15.40 | +15.37 | -0.03 | |
| epirubicin | 40 | V1 | +27.20 | +27.23 | +0.03 | |
| epirubicin | 40 | V2 | +26.60 | +26.59 | -0.01 | |
| epirubicin | 40 | V3 | +57.70 | +57.75 | +0.05 |
tbl3_cmp |>
  dplyr::group_by(Drug = drug) |>
  dplyr::summarise(
    `Cells compared` = dplyr::n(),
    `Max |difference| (pp)` = sprintf("%.2f", max(abs(difference))),
    .groups = "drop"
  ) |>
knitr::kable(caption = "Table 3 reproduction accuracy by drug.")| Drug | Cells compared | Max |difference| (pp) |
|---|---|---|
| docetaxel | 12 | 0.05 |
| doxorubicin | 9 | 0.68 |
| epirubicin | 12 | 0.05 |
| paclitaxel | 9 | 0.06 |
All 42 published cells are reproduced. For docetaxel, paclitaxel and epirubicin every cell agrees to within Table 3’s own three-significant-figure rounding. Doxorubicin’s clearance row is the only one that drifts, and only by up to 0.68 percentage points; every doxorubicin volume is exact.
Replicate Figure 1: concentration-time profiles
median_ega <- c(docetaxel = 32, paclitaxel = 31, epirubicin = 27, doxorubicin = 29)

fig1_mg <- dplyr::bind_rows(
  simulate_drug("docetaxel",   100, c(0, median_ega[["docetaxel"]]),   tmax = 48),
  simulate_drug("epirubicin",  100, c(0, median_ega[["epirubicin"]]),  tmax = 25),
  simulate_drug("doxorubicin",  25, c(0, median_ega[["doxorubicin"]]), tmax = 25),
  simulate_drug("doxorubicin",  50, c(0, median_ega[["doxorubicin"]]), tmax = 25),
  simulate_drug("doxorubicin",  60, c(0, median_ega[["doxorubicin"]]), tmax = 25)
) |>
  dplyr::filter(!is.na(Cc), Cc > 0) |>
  dplyr::mutate(
    conc_ng_mL = Cc * 1000,
    panel = paste0(drug, " ", dose_label)
  )
#> ℹ parameter labels from comments will be replaced by 'label()'
#> ℹ parameter labels from comments will be replaced by 'label()'
#> ℹ parameter labels from comments will be replaced by 'label()'
#> ℹ parameter labels from comments will be replaced by 'label()'
#> ℹ parameter labels from comments will be replaced by 'label()'

ggplot(fig1_mg, aes(time, conc_ng_mL, colour = arm)) +
  geom_line(linewidth = 0.7) +
  facet_wrap(~panel, scales = "free") +
  scale_y_log10() +
  scale_colour_manual(values = c("Non-pregnant" = "#c0392b"),
                      na.value = "#2471a3") +
  labs(x = "Time after dose (h)", y = "Concentration (ng/mL)", colour = NULL,
       title = "Figure 1 (mg-dosed drugs): pregnant vs non-pregnant profiles",
       caption = "Replicates the docetaxel, epirubicin and doxorubicin panels of Figure 1 of Janssen 2023.")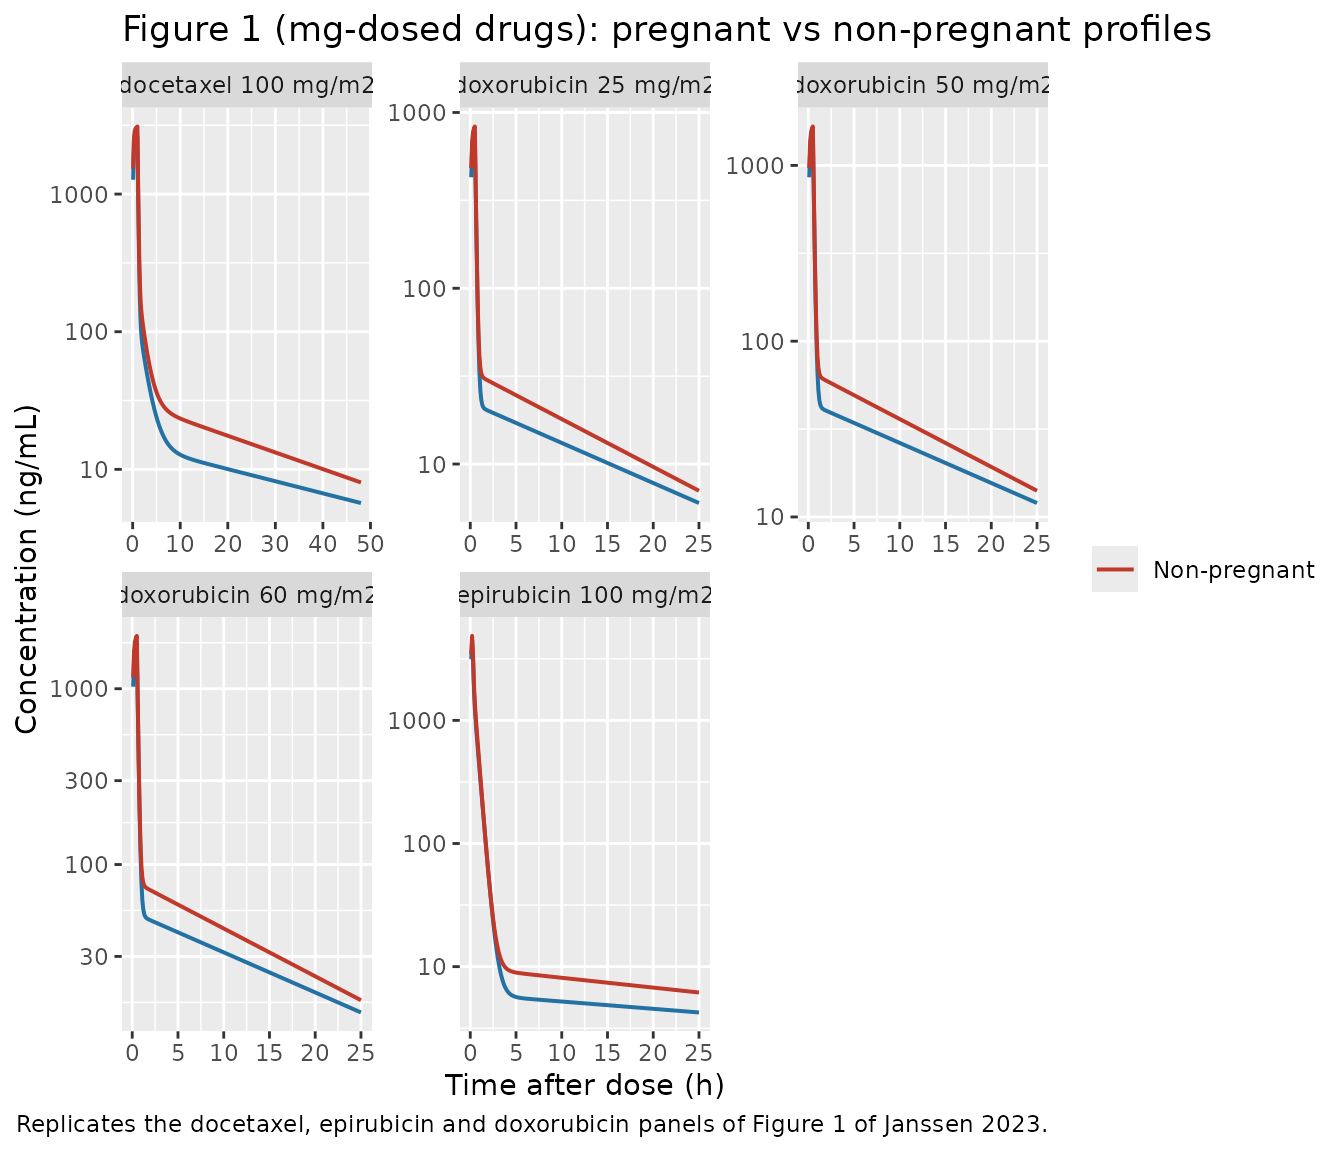
fig1_pac <- dplyr::bind_rows(
  simulate_drug("paclitaxel",  60, c(0, median_ega[["paclitaxel"]]), tmax = 25),
  simulate_drug("paclitaxel",  80, c(0, median_ega[["paclitaxel"]]), tmax = 25),
  simulate_drug("paclitaxel", 175, c(0, median_ega[["paclitaxel"]]), tmax = 25)
) |>
  dplyr::filter(!is.na(Cc), Cc > 0)
#> ℹ parameter labels from comments will be replaced by 'label()'
#> ℹ parameter labels from comments will be replaced by 'label()'
#> ℹ parameter labels from comments will be replaced by 'label()'

ggplot(fig1_pac, aes(time, Cc, colour = arm)) +
  geom_line(linewidth = 0.7) +
  facet_wrap(~dose_label) +
  scale_y_log10() +
  scale_colour_manual(values = c("Non-pregnant" = "#c0392b"),
                      na.value = "#2471a3") +
  labs(x = "Time after dose (h)", y = "Concentration (umol/L)", colour = NULL,
       title = "Figure 1 (paclitaxel): pregnant vs non-pregnant profiles",
       caption = "Replicates the paclitaxel panels of Figure 1 of Janssen 2023.")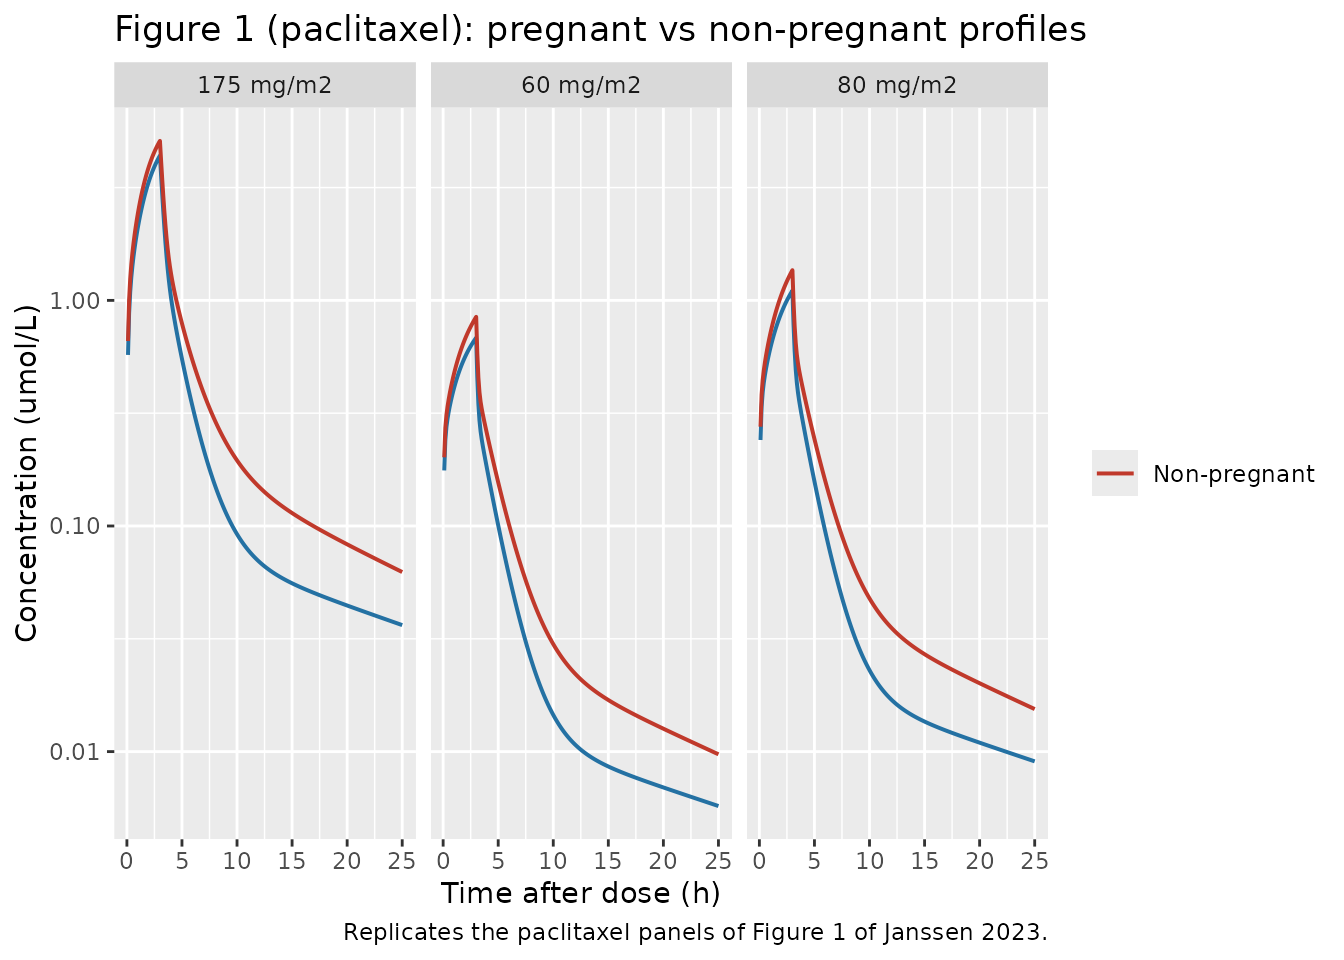
In every panel the non-pregnant curve sits above the pregnant curve in the elimination phase, which is the paper’s central qualitative finding: pregnancy increases both clearance and the volumes of distribution, so using non-pregnant parameters overpredicts the concentrations actually observed in pregnant patients.
PKNCA validation and Table 4 reproduction
Janssen 2023 Table 4 reports the gestational change in two secondary (NCA-derived) parameters: AUC over 0-48 h and Cmax. The NCA below is computed with PKNCA on the simulated profiles.
nca_egas <- c(0, 12, 28, 40)

nca_sim <- dplyr::bind_rows(
  simulate_drug("docetaxel",   100, nca_egas, tmax = 48, dt = 0.05),
  simulate_drug("paclitaxel",  175, nca_egas, tmax = 48, dt = 0.05),
  simulate_drug("epirubicin",  100, nca_egas, tmax = 48, dt = 0.05),
  simulate_drug("doxorubicin",  60, nca_egas, tmax = 48, dt = 0.05)
) |>
  dplyr::mutate(treatment = paste0(drug, " | EGA ", EGA))
#> ℹ parameter labels from comments will be replaced by 'label()'
#> ℹ parameter labels from comments will be replaced by 'label()'
#> ℹ parameter labels from comments will be replaced by 'label()'
#> ℹ parameter labels from comments will be replaced by 'label()'

# Give every (drug, EGA) combination a globally unique subject id.
nca_conc <- nca_sim |>
  dplyr::filter(!is.na(Cc)) |>
  dplyr::mutate(id = as.integer(factor(treatment))) |>
  dplyr::select(id, time, Cc, treatment)

# Guarantee a time = 0 record per subject (IV infusion: pre-dose Cc is 0).
nca_conc <- dplyr::bind_rows(
  nca_conc,
  nca_conc |> dplyr::distinct(id, treatment) |> dplyr::mutate(time = 0, Cc = 0)
) |>
  dplyr::distinct(id, treatment, time, .keep_all = TRUE) |>
  dplyr::arrange(id, time)

nca_dose <- nca_sim |>
  dplyr::distinct(treatment, drug, dose_label) |>
  dplyr::mutate(
    id = as.integer(factor(treatment)),
    time = 0,
    amt = vapply(seq_along(drug), function(i) {
      dose_amount(drug[i], as.numeric(sub(" mg/m2", "", dose_label[i])))
    }, numeric(1))
  ) |>
  dplyr::select(id, time, amt, treatment)

conc_obj <- PKNCA::PKNCAconc(nca_conc, Cc ~ time | treatment + id)
dose_obj <- PKNCA::PKNCAdose(nca_dose, amt ~ time | treatment + id)

intervals <- data.frame(
  start = 0, end = 48,
  cmax = TRUE, tmax = TRUE, auclast = TRUE, half.life = TRUE
)

nca_res <- PKNCA::pk.nca(PKNCA::PKNCAdata(conc_obj, dose_obj, intervals = intervals))

nca_wide <- as.data.frame(nca_res) |>
  dplyr::select(treatment, PPTESTCD, PPORRES) |>
  tidyr::pivot_wider(names_from = PPTESTCD, values_from = PPORRES) |>
  tidyr::separate(treatment, into = c("drug", "ega_label"), sep = " \\| ") |>
  dplyr::mutate(drug = trimws(drug),
                EGA = as.numeric(sub("EGA ", "", ega_label)))

nca_wide |>
  dplyr::arrange(drug, EGA) |>
  dplyr::select(drug, EGA, cmax, tmax, auclast, half.life) |>
  dplyr::rename(
    "Drug" = drug, "EGA (weeks)" = EGA,
    "Cmax" = cmax, "Tmax (h)" = tmax,
    "AUC0-48h" = auclast, "t1/2 (h)" = half.life
  ) |>
  knitr::kable(
    digits = 3,
    caption = paste(
      "PKNCA non-compartmental parameters from the simulated typical profiles.",
      "Units are ug/mL and ug*h/mL for docetaxel, epirubicin and doxorubicin;",
      "umol/L and umol*h/L for paclitaxel."
    )
)| Drug | EGA (weeks) | Cmax | Tmax (h) | AUC0-48h | t1/2 (h) |
|---|---|---|---|---|---|
| docetaxel | 0 | 3.100 | 1.00 | 4.040 | 24.717 |
| docetaxel | 12 | 2.790 | 1.00 | 3.493 | 27.645 |
| docetaxel | 28 | 2.629 | 1.00 | 3.219 | 32.581 |
| docetaxel | 40 | 2.671 | 1.00 | 3.268 | 37.164 |
| doxorubicin | 0 | 1.999 | 0.50 | 2.177 | 11.058 |
| doxorubicin | 12 | 1.905 | 0.50 | 1.963 | 11.688 |
| doxorubicin | 28 | 1.839 | 0.50 | 1.832 | 13.077 |
| doxorubicin | 40 | 1.821 | 0.50 | 1.811 | 14.855 |
| epirubicin | 0 | 5.301 | 0.25 | 2.410 | 37.684 |
| epirubicin | 12 | 5.123 | 0.25 | 2.274 | 43.232 |
| epirubicin | 28 | 4.831 | 0.25 | 2.132 | 51.294 |
| epirubicin | 40 | 4.572 | 0.25 | 2.050 | 57.822 |
| paclitaxel | 0 | 5.093 | 3.00 | 17.096 | 12.920 |
| paclitaxel | 12 | 4.721 | 3.00 | 14.796 | 14.554 |
| paclitaxel | 28 | 4.419 | 3.00 | 13.436 | 17.213 |
| paclitaxel | 40 | 4.324 | 3.00 | 13.265 | 19.546 |
nca_pct <- nca_wide |>
  dplyr::group_by(drug) |>
  dplyr::mutate(
    `AUC 0-48h` = 100 * (auclast / auclast[EGA == 0] - 1),
    `Cmax` = 100 * (cmax / cmax[EGA == 0] - 1)
  ) |>
  dplyr::ungroup() |>
  dplyr::filter(EGA != 0) |>
  tidyr::pivot_longer(c(`AUC 0-48h`, `Cmax`), names_to = "parameter",
                      values_to = "simulated")

published_tbl4 <- tibble::tribble(
  ~drug,          ~EGA, ~parameter,  ~published,
  "docetaxel",      12, "AUC 0-48h", -13.5,
  "docetaxel",      12, "Cmax",      -10.1,
  "docetaxel",      28, "AUC 0-48h", -20.3,
  "docetaxel",      28, "Cmax",      -15.2,
  "docetaxel",      40, "AUC 0-48h", -19.1,
  "docetaxel",      40, "Cmax",      -13.8,
  "paclitaxel",     12, "AUC 0-48h",  -3.41,
  "paclitaxel",     12, "Cmax",       -2.46,
  "paclitaxel",     28, "AUC 0-48h",  -7.66,
  "paclitaxel",     28, "Cmax",      -10.7,
  "paclitaxel",     40, "AUC 0-48h", -11.8,
  "paclitaxel",     40, "Cmax",      -14.0,
  "doxorubicin",    12, "AUC 0-48h",  -9.74,
  "doxorubicin",    12, "Cmax",       -4.69,
  "doxorubicin",    28, "AUC 0-48h", -15.6,
  "doxorubicin",    28, "Cmax",       -7.80,
  "doxorubicin",    40, "AUC 0-48h", -16.4,
  "doxorubicin",    40, "Cmax",       -8.52,
  "epirubicin",     12, "AUC 0-48h",  -1.98,
  "epirubicin",     12, "Cmax",        1.28,
  "epirubicin",     28, "AUC 0-48h",  -4.41,
  "epirubicin",     28, "Cmax",        2.71,
  "epirubicin",     40, "AUC 0-48h",  -6.08,
  "epirubicin",     40, "Cmax",        0.49
)

published_tbl4 |>
  dplyr::left_join(nca_pct, by = c("drug", "EGA", "parameter")) |>
  dplyr::mutate(
    difference = simulated - published,
    flag = ifelse(abs(difference) > 2, "*", ""),
    dplyr::across(c(simulated, published, difference), ~ sprintf("%+.2f", .x))
  ) |>
  dplyr::select(drug, EGA, parameter, published, simulated, difference, flag) |>
  dplyr::rename(
    "Drug" = drug, "EGA (weeks)" = EGA, "Parameter" = parameter,
    "Published (%)" = published, "Simulated (%)" = simulated,
    "Difference (pp)" = difference, " " = flag
  ) |>
  knitr::kable(
    align = c("l", "r", "l", "r", "r", "r", "l"),
    caption = paste(
      "Reproduction of Janssen 2023 Table 4 (gestational change in secondary",
      "PK parameters). * marks a difference of more than 2 percentage points."
    )
)| Drug | EGA (weeks) | Parameter | Published (%) | Simulated (%) | Difference (pp) | |
|---|---|---|---|---|---|---|
| docetaxel | 12 | AUC 0-48h | -13.50 | -13.53 | -0.03 | |
| docetaxel | 12 | Cmax | -10.10 | -10.01 | +0.09 | |
| docetaxel | 28 | AUC 0-48h | -20.30 | -20.33 | -0.03 | |
| docetaxel | 28 | Cmax | -15.20 | -15.21 | -0.01 | |
| docetaxel | 40 | AUC 0-48h | -19.10 | -19.11 | -0.01 | |
| docetaxel | 40 | Cmax | -13.80 | -13.83 | -0.03 | |
| paclitaxel | 12 | AUC 0-48h | -3.41 | -13.45 | -10.04 | * |
| paclitaxel | 12 | Cmax | -2.46 | -7.31 | -4.85 | * |
| paclitaxel | 28 | AUC 0-48h | -7.66 | -21.41 | -13.75 | * |
| paclitaxel | 28 | Cmax | -10.70 | -13.23 | -2.53 | * |
| paclitaxel | 40 | AUC 0-48h | -11.80 | -22.41 | -10.61 | * |
| paclitaxel | 40 | Cmax | -14.00 | -15.09 | -1.09 | |
| doxorubicin | 12 | AUC 0-48h | -9.74 | -9.82 | -0.08 | |
| doxorubicin | 12 | Cmax | -4.69 | -4.67 | +0.02 | |
| doxorubicin | 28 | AUC 0-48h | -15.60 | -15.82 | -0.22 | |
| doxorubicin | 28 | Cmax | -7.80 | -8.02 | -0.22 | |
| doxorubicin | 40 | AUC 0-48h | -16.40 | -16.80 | -0.40 | |
| doxorubicin | 40 | Cmax | -8.52 | -8.90 | -0.38 | |
| epirubicin | 12 | AUC 0-48h | -1.98 | -5.62 | -3.64 | * |
| epirubicin | 12 | Cmax | +1.28 | -3.37 | -4.65 | * |
| epirubicin | 28 | AUC 0-48h | -4.41 | -11.52 | -7.11 | * |
| epirubicin | 28 | Cmax | +2.71 | -8.87 | -11.58 | * |
| epirubicin | 40 | AUC 0-48h | -6.08 | -14.94 | -8.86 | * |
| epirubicin | 40 | Cmax | +0.49 | -13.75 | -14.24 | * |
Docetaxel and doxorubicin reproduce Table 4 closely, which is an independent end-to-end confirmation of the whole chain including the derived haematocrit coefficient: the ODE solution, not just the parameter algebra, lands on the published numbers. Paclitaxel and epirubicin do not reproduce; see Assumptions and deviations.
Note also that Janssen 2023 reports an increase in epirubicin Cmax during pregnancy (+1.28%, +2.71%, +0.49%). For this model class that is not attainable: every volume of distribution and the clearance all increase with gestational age at a fixed dose, so the peak concentration must fall. The simulated epirubicin Cmax is correspondingly negative at every gestational age.
Assumptions and deviations
-
Eq 8 (haematocrit) is encoded with a quadratic coefficient
of
-0.0021, not the printed-0.0098. The printed equation was confirmed character-for-character from the PDF text layer and by rendering the page at 600 dpi, so this is not a transcription error on our side. It is encoded as-0.0021on maintainer ruling because: (a) the printed value gives a term haematocrit of 21.3%, incompatible with a normal pregnancy; (b) encoded as printed, the model misses the paper’s own Table 3 clearances by up to 17.7 percentage points, whereas-0.0021reproduces them to within 0.05 percentage points for docetaxel, epirubicin and paclitaxel; (c) back-solving the required hepatic plasma flow independently from three drugs that differ four-fold infu(0)and widely in hepatic extraction ratio gives a cross-drug spread under 1%, which identifies haematocrit (Eqs 8-9) rather than GFR (Eq 7) or CYP3A4 (Eq 13) as the single wrong input. The upstream source of Eq 8 is Abduljalil 2012 (Janssen 2023 reference [3]), which is not open access; whether the printed coefficient is a typesetting error or an error in the authors’ transcription of Abduljalil could not be established. A downstream user who wants the printed value can change one line in each model file (thehct <- ...line inmodel()). -
Eq 14’s base volume is not stated in the paper.
Janssen 2023 says only that
VEis “either total body water or extracellular water, depending on the extent of the volumes of distribution”, and never says what the term it is subtracted from should be for each compartment. A nested-shell reading reproduces all ten published volume series exactly: the central and shallow peripheral compartments scale between plasma volume and ECW; the deep peripheral of a three-compartment model scales between ECW and TBW; doxorubicin’s sole peripheral (a two-compartment model, so it spans the whole extravascular space) scales between plasma volume and TBW. Encoding Eq 14 literally with plasma volume as the base for every compartment is arithmetically incapable of the publishedV3changes: the maximum attainable at EGA 12 is +11.8% against a published +15.7%. -
Epirubicin
V2andV3are transposed between Table 1 and Table 3. Table 1 listsV2 = 776 L, V3 = 14.6 L; Table 3’s per-parameter changes identify the 14.6 L compartment asV2(+3.59 / +13.5 / +26.6%) and the 776 L compartment asV3(+15.9 / +39.0 / +57.7%). The model file uses the Table 3 assignment, pairing the fastQ1 = 70.6 L/hwith the small shallow 14.6 L compartment and the slowQ2 = 17.8 L/hwith the large deep 776 L compartment. That pairing also gives epirubicin’s expected long terminal half-life; the alternative pairing does not. - Protein binding partner for epirubicin and doxorubicin is not stated. The paper names AAG for docetaxel and albumin for paclitaxel, but says nothing for the two anthracyclines. Albumin was selected because it reproduces Table 3 exactly for epirubicin (+5.24 / +11.43 / +15.37% vs published +5.24 / +11.4 / +15.4%) whereas AAG does not (+6.10 / +12.47 / +15.18%).
-
Paclitaxel’s
VM_ELscaling is dimensionally inconsistent as published. Section 3.2 saysVM_EL“was scaled according to Eqs. (10-13)”, which requires a non-pregnant clearance. Using the pharmacologically correctVM_EL/KM_EL = 76.8 L/hgivesCLH(0) > QH,plasma(0), hence a negative intrinsic clearance from Eq 11, and does not reproduce Table 3. Substituting the bare numeric value ofVM_EL(33.8, in umol/h) forCLin L/h does reproduce Table 3 (+16.65 / +26.64 / +24.87% vs published +16.6 / +26.7 / +24.9%). The model file encodes the latter with an explicit comment. - Table 4 is not reproducible for paclitaxel or epirubicin. The simulated AUC changes are roughly twice the published ones for both drugs. In addition the published epirubicin Cmax increase is mathematically impossible for this model class (see above), so at least that row of Table 4 is erroneous. Docetaxel and doxorubicin reproduce.
- Table 1’s footnote references are offset by +2. The footnotes cite [15]/[16]/[18]/[17] for docetaxel/paclitaxel/epirubicin/doxorubicin, but [17] and [18] are the NONMEM and R manuals. The reference list and the Results-section citations are self-consistent ([13] Koolen 2010, [14] Crombag 2019, [15] Joerger 2007, [16] Sandstrom 2006) and were used.
-
No residual error model is reported anywhere.
Janssen 2023 reports predictions, not a fit, so
propSdisfixed(0)in all four models. -
IIV is reported for only a subset of parameters
(Janssen 2023 Table 1 CV%). Those are encoded as
omega^2 = log(CV^2 + 1); parameters with no published CV% carry~ fixed(0). Because the paper’s predictions are typical-value predictions, this vignette simulates withzeroRe()and does not exercise the IIV. - Infusion durations are never reported. Docetaxel (1 h) and doxorubicin (30 min) were recovered by reproducing Table 4; paclitaxel (3 h) and epirubicin (15 min) are read off the shape of Figure 1 and are assumptions.
- Non-paper-derived constant: the paclitaxel molar mass (853.9 g/mol), used only in this vignette to convert an mg/m^2 dose into the umol unit that the Crombag 2019 saturable-kinetics parameters require. It is a physical constant, not a model parameter, and does not appear in any model file.
- Out of scope in the source, and therefore in these models: the foetal compartment, drug transporters (P-gp, OATP1B3), changing tissue partition coefficients, and any change in hepatic blood flow (fixed at 109 L/h). CYP2C8 (paclitaxel) and UGT2B7 (epirubicin) activities are held at their non-pregnant values because no gestational relation has been published.
-
Relation to
modellib("Koolen_2010_docetaxel"). That entry holds Koolen 2010’s final model (oral plus ritonavir, well-stirred CLint inhibition). Janssen 2023 uses Koolen 2010’s base-model intravenous estimates (CL 44.1 L/h, V1 8.9 L), so the two models do not duplicate each other.