Model and source
- Citation: Cao Y, Balthasar JP, Jusko WJ. Second-generation minimal physiologically-based pharmacokinetic model for monoclonal antibodies. J Pharmacokinet Pharmacodyn. 2013 Oct;40(5):597-607.
- Article: https://doi.org/10.1007/s10928-013-9332-2
- Source data digitised from Puchalski T et al. Clin Cancer Res. 2010;16(5):1652-1661 (PMID 20179212).
This is the siltuximab entry from the 12-fit Cao
2013 mAb cohort. The structural model (4-compartment mPBPK: plasma +
tight-tissue interstitial fluid + leaky-tissue interstitial fluid +
lymph) is shared by all 12 mAbs in the paper; each mAb has its own
values of sigma1, sigma2, and CLp
(Model A) or CLi (Model B). This file uses Model
A (clearance from plasma) per the operator’s choice for the
canonical entries.
Population
Cao et al. fit the mPBPK model to siltuximab plasma concentration profiles digitised from Puchalski et al. (2010), a phase 1 study of an anti-IL-6 chimeric IgG1 in patients with metastatic renal cell carcinoma. Doses spanned 1, 3, 6, and 12 mg/kg by intravenous infusion. Cao 2013 does not reproduce the underlying Puchalski 2010 demographics; consult the source publication for age, sex, and other baseline characteristics. Cao 2013 used a 70 kg reference body weight when assigning the human physiological constants (V_p = 2.6 L, ISF = 15.6 L, lymph flow = 2.9 L/day).
The packaged metadata
(readModelDb("Cao_2013_siltuximab")$population) records
this study context.
Source trace
| Equation / parameter | Value | Source location |
|---|---|---|
| 4-compartment mPBPK ODE system | – | Cao 2013 Eqs 1-4 (page 3, Model A) |
| Lumped tissue-volume splits (V_tight = 0.65 * ISF * Kp; V_leaky = 0.35 * ISF * Kp) | – | Cao 2013 Eq 6 |
| Lymph-flow splits (L1 = 0.33 * L; L2 = 0.67 * L) | – | Cao 2013 Eq 7 |
sigma1 (vascular reflection coefficient, tight
tissues) |
0.964 | Cao 2013 Table 2, siltuximab Model A (CV 10.3%) |
sigma2 (vascular reflection coefficient, leaky
tissues) |
0.673 | Cao 2013 Table 2, siltuximab Model A (CV 9.27%) |
CLp (plasma clearance) |
0.0115 L/hr = 0.276 L/day | Cao 2013 Table 2, siltuximab Model A (CV 5.19%) |
sigmaL (lymphatic capillary reflection
coefficient) |
0.2 (fixed) | Cao 2013 Methods (assumed) |
Kp (available ISF fraction for native IgG1) |
0.8 | Cao 2013 Methods, refs 22-23 |
Vplasma for 70 kg adult |
2.6 L | Cao 2013 Table 2 footnote |
ISF total interstitial fluid for 70 kg adult |
15.6 L | Cao 2013 Methods (refs 24-25) |
| Total lymph flow for 70 kg adult | 2.9 L/day | Cao 2013 Methods (refs 24-25) |
Vlymph (assumed equal to plasma volume) |
2.6 L | Cao 2013 Methods, ref 21 |
Virtual cohort
The packaged model has no IIV and no residual error – it is a typical-value structural mPBPK model fit by Cao 2013 to digitised mean profiles in ADAPT 5. Simulation reproduces the paper’s typical-value fits.
obs_times <- sort(unique(c(seq(0, 1, by = 0.05),
                            seq(1, 14, by = 0.5),
                            seq(14, 100, by = 2))))

make_dose_panel <- function(dose_mg_per_kg, weight_kg = 70, id) {
  amt <- dose_mg_per_kg * weight_kg
  rxode2::et(amt = amt, cmt = "plasma", id = id) |>
    rxode2::et(time = obs_times, id = id)
}

events <- dplyr::bind_rows(
  as.data.frame(make_dose_panel(1,  id = 1L)) |> dplyr::mutate(dose_mg_per_kg = 1),
  as.data.frame(make_dose_panel(3,  id = 2L)) |> dplyr::mutate(dose_mg_per_kg = 3),
  as.data.frame(make_dose_panel(6,  id = 3L)) |> dplyr::mutate(dose_mg_per_kg = 6),
  as.data.frame(make_dose_panel(12, id = 4L)) |> dplyr::mutate(dose_mg_per_kg = 12)
)
stopifnot(!anyDuplicated(unique(events[, c("id", "time", "evid")])))
Simulation
mod <- readModelDb("Cao_2013_siltuximab")
sim <- rxode2::rxSolve(rxode2::rxode2(mod), events = events,
keep = "dose_mg_per_kg") |>
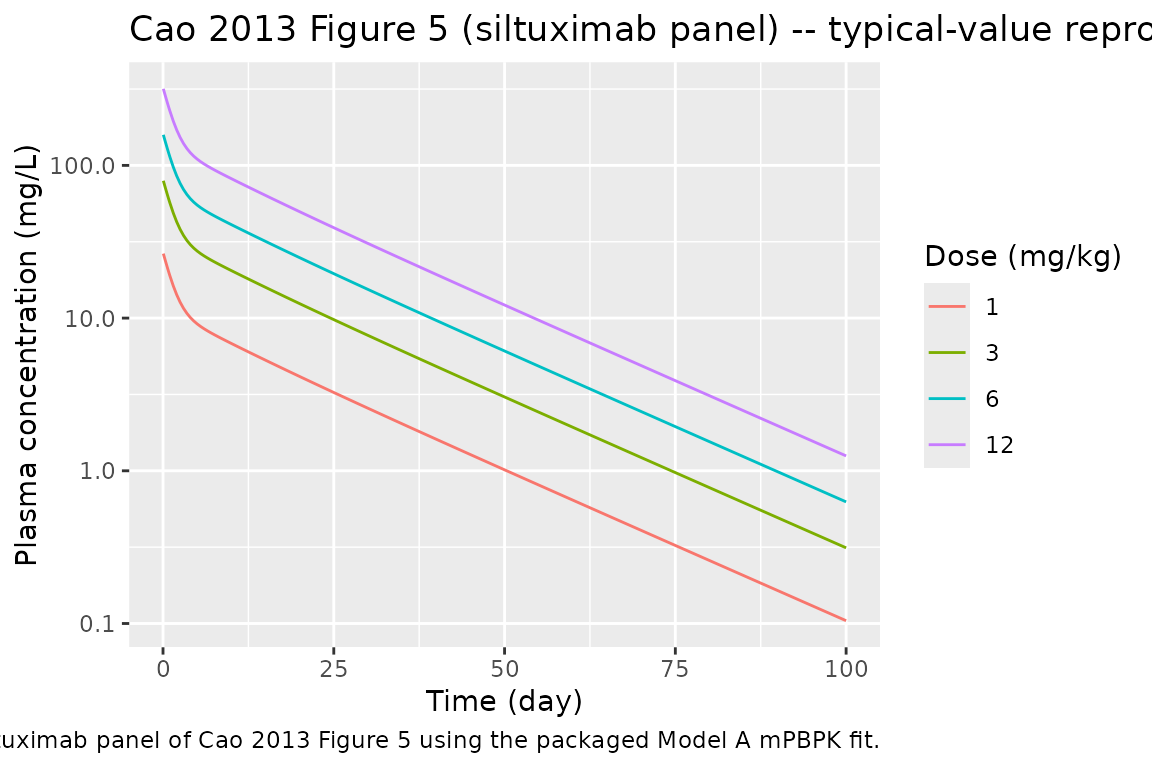
as.data.frame()Replicate Figure 5 (siltuximab panel)
sim |>
  dplyr::filter(time > 0) |>
  ggplot2::ggplot(ggplot2::aes(time, Cc,
                                colour = factor(dose_mg_per_kg))) +
  ggplot2::geom_line() +
  ggplot2::scale_y_log10() +
  ggplot2::labs(
    x = "Time (day)", y = "Plasma concentration (mg/L)",
    colour = "Dose (mg/kg)",
    title = "Cao 2013 Figure 5 (siltuximab panel) -- typical-value reproduction",
    caption = "Replicates the siltuximab panel of Cao 2013 Figure 5 using the packaged Model A mPBPK fit."
  )
PKNCA validation
Run NCA on the simulated plasma profile to compute Cmax, t_max, AUC_inf, and terminal half-life. The packaged model has no IIV, so a single trajectory per dose group represents the “typical” patient.
sim_nca <- sim |>
  dplyr::filter(!is.na(Cc)) |>
  dplyr::transmute(id = id, time = time, conc = Cc,
                   dose_mg_per_kg = dose_mg_per_kg)

dose_df <- events |>
  dplyr::filter(evid == 1) |>
  dplyr::transmute(id = id, time = time, amt = amt,
                   dose_mg_per_kg = dose_mg_per_kg)

conc_obj <- PKNCA::PKNCAconc(sim_nca, conc ~ time | dose_mg_per_kg + id)
dose_obj <- PKNCA::PKNCAdose(dose_df, amt ~ time | dose_mg_per_kg + id)

intervals <- data.frame(
  start      = 0,
  end        = Inf,
  cmax       = TRUE,
  tmax       = TRUE,
  aucinf.obs = TRUE,
  half.life  = TRUE
)

nca <- PKNCA::pk.nca(PKNCA::PKNCAdata(conc_obj, dose_obj, intervals = intervals))
nca_summary <- summary(nca)
knitr::kable(nca_summary, caption = "Simulated NCA parameters by dose group (Cao 2013 siltuximab Model A typical-value fit).")| start | end | dose_mg_per_kg | N | cmax | tmax | half.life | aucinf.obs |
|---|---|---|---|---|---|---|---|
| 0 | Inf | 1 | 1 | 26.9 | 0.000 | 15.1 | 254 |
| 0 | Inf | 3 | 1 | 80.8 | 0.000 | 15.1 | 761 |
| 0 | Inf | 6 | 1 | 162 | 0.000 | 15.1 | 1520 |
| 0 | Inf | 12 | 1 | 323 | 0.000 | 15.1 | 3040 |
The terminal half-life predicted by the typical-value mPBPK fit corresponds to siltuximab’s reported half-life of approximately 2-3 weeks in the underlying Puchalski 2010 study; Cmax and AUC scale linearly with dose because the model is purely linear (no TMDD, no concentration-dependent clearance).
Assumptions and deviations
-
No IIV, no residual error. Cao 2013 fit the mPBPK
model in ADAPT 5 to digitised mean profiles using a typical-value
variance model
V_i = (intercept + slope * Y_hat)^2(Eq 9). Cao 2013 does not report the values ofinterceptandslope. The packaged model is a structural typical-value fit; downstream users wanting between-subject variability must add their own IIV. -
Compartment names deviate from the nlmixr2lib canonical
set (
plasma,tight,leaky,lymphinstead ofcentral,peripheral1,peripheral2,effect). The deviation is necessary because the four mPBPK compartments are mechanistically distinct (plasma vs. tight-tissue ISF vs. leaky-tissue ISF vs. lymph) and forcing them into the canonical PK-style names would obscure the physiology.checkModelConventions()raises this as four warnings (one per compartment) and no errors. - Kp = 0.8 is hard-coded for native IgG1. Siltuximab is a chimeric IgG1; native-IgG1 Kp is appropriate. Cao 2013 also uses Kp = 0.4 for native IgG4 elsewhere in the cohort, but the value is not estimated and is not modified subject-to-subject.
- 70 kg reference body weight. Cao 2013 used a fixed 70 kg adult plasma volume, ISF volume, and lymph flow (Vplasma = 2.6 L, ISF = 15.6 L, L = 2.9 L/day). For paediatric or markedly under- or over-weight subjects, the user must rescale these constants.
- Model A (clearance from plasma) used by default. Cao 2013 also reports Model B (clearance from interstitial fluid; CLi = 0.0218 L/hr for siltuximab); Model A is used here for consistency across the 12 nlmixr2lib entries from this paper. Cao 2013 reports a slightly lower objective-function value for Model B in 7 of 10 human mAbs but notes that Model A is more reasonable on the latent constraint sigma1 > sigma2.