Rosuvastatin LDL-C MBMA (Yang 2010)
Source:vignettes/articles/Yang_2010_rosuvastatin_mbma.Rmd
Yang_2010_rosuvastatin_mbma.RmdModel and source
- Citation: Yang J, Li LJ, Wang K, He YC, Sheng YC, Xu L, Huang XH, Guo F, Zheng QS. Race differences: modeling the pharmacodynamics of rosuvastatin in Western and Asian hypercholesterolemia patients. Acta Pharmacologica Sinica. 2011;32(1):116-125 (published online 13 Dec 2010). doi:10.1038/aps.2010.169. Placebo intercept E0 = -0.802 percent fixed from Mandema JW, Hermann D, Wang W et al. Model-based development of gemcabene, a new lipid-altering agent. AAPS J. 2005;7(3):E513-E522 (ref [15]).
- Description: MBMA. Literature-based meta-analysis simple Emax dose-response model for percentage reduction in low-density lipoprotein cholesterol (LDL-C) from baseline in adult hypercholesterolemia patients receiving rosuvastatin. Operates at the study-arm level over 14 dose-ranging trials (46 study-arm-mean effect samples; 9 Western trials and 5 Asian trials, total N substantially larger than 46 because each arm pools many patients). Output Cc is the study-arm mean percent LDL-C reduction from baseline (unsigned: Cc = 50 means a 50 percent reduction). The placebo intercept E0 (-0.802 percent, a small expected LDL-C increase under placebo) and the Hill / sigmoidicity exponent (1) are fixed at the values used by the source paper – E0 from prior literature [Mandema 2005, ref 15] and gamma after the sigmoidal Emax fit produced unstable estimates. Race (Asian vs Western reference) is the only retained covariate and acts on ED50: ED50_Asian = ED50_Western * 0.564 (i.e. roughly twofold-lower ED50 in Asians). Between-trial variability is encoded as a single study-arm-level eta on the predicted output (SD 3.0 percent); residual error is additive (SD 3.1 percent). Baseline LDL-C was screened but not retained. Suitable simulation scope is study-arm-mean percent LDL-C reduction, NOT individual-subject LDL-C trajectories. The model also predicts only the steady-state effect (paper restricted to arms with at least 4 weeks of treatment).
- Article: https://doi.org/10.1038/aps.2010.169
Population
Yang and colleagues performed a literature-based meta-analysis of percent LDL-C reduction from baseline at steady state (at least 4 weeks of treatment) across 14 dose-ranging clinical trials of rosuvastatin in adults with primary hypercholesterolemia. Of the 14 dose-ranging trials used for model estimation, 9 enrolled Western patients (predominantly Whites / Caucasians) and 5 enrolled Asian patients (Chinese, Japanese, and South Asian subjects, including two unpublished trials from the authors department). A further 22 single-dose trials (18 Western and 4 Asian) served as an independent external visual-predictive-check holdout (Yang 2010 Tables 1-3).
Daily rosuvastatin doses spanned 0 (placebo), 1, 2, 2.5, 4, 5, 10, 20, 40, and 80 mg/day across the dose-ranging trials. Per-arm baseline LDL-C ranged about 153-219 mg/dL. Baseline LDL-C was screened as a covariate but did not reach significance; only race (Asian vs Western reference) was retained as a covariate on ED50 in the final model. All 14 trials were randomized parallel-group, mostly double-blind, with three placebo-controlled and the majority multicenter.
The modelled data are 46 study-arm-mean percent LDL-C reductions; each modelled point is the mean response in a group of patients at the steady-state timepoint in a single trial arm. Inter-trial variability is encoded as a single study-arm-level random effect on the predicted output (SD 3.0 percent). The simulation scope is study-arm-mean percent LDL-C reduction, not individual-patient LDL-C trajectories.
The same information is available programmatically via
rxode2::rxode(readModelDb("Yang_2010_rosuvastatin_mbma"))$population.
Source trace
The structural form is a simple Emax dose-response on the percent-LDL-C reduction scale (Yang 2010 Eq 1 with gamma fixed to 1):
with
and (SD 3.0 percent), on the unsigned percent-reduction scale.
| Equation / parameter | Value | Source location |
|---|---|---|
| Structural form (simple Emax in dose) | n/a | Yang 2010 Eq 1 + Results paragraph 2 (gamma fixed to 1) |
| Race covariate equation | n/a | Yang 2010 Methods, covariate-modeling paragraph |
e0 (placebo intercept; FIXED from Mandema 2005) |
-0.802 % | Yang 2010 Table 4 footnote |
lemax (max LDL-C reduction Emax) |
57.0 % | Yang 2010 Table 4, Emax row (RSE 3.86%) |
led50 (ED50 for Western reference) |
1.74 mg/day | Yang 2010 Table 4, ED50 row (RSE 21.8%) |
lhill (sigmoidicity gamma; FIXED to 1) |
1 | Yang 2010 Table 4 + Results paragraph 2 |
e_asian_ed50 (Asian-race multiplicative effect on
ED50) |
0.564 | Yang 2010 Table 4, theta (race on ED50) row (RSE 28.55%) |
eta_study_e0 (inter-trial random effect; variance) |
9.0 (SD 3.0) | Yang 2010 Table 4, “Inter-trial variability” row + footnote (SD = sqrt(eta)) |
addSd (residual error SD) |
3.1 | Yang 2010 Table 4, “Residual error (SD)” row |
| Baseline LDL-C covariate (screened, not retained) | n/a | Yang 2010 Methods + Results paragraph 2 (only race-on-ED50 reduced OFV) |
Errata
No published erratum or corrigendum was located for Yang 2010. The Acta Pharmacologica Sinica landing page (https://www.nature.com/articles/aps2010169) and PubMed PMID 21151164 returned no correction notices as of the model extraction date (2026-06-03).
Virtual cohort
Original individual-patient data are not publicly available; the source analysis was performed on aggregated study-arm-mean data from 14 dose-ranging trials (46 effect samples) plus 22 single-dose trials for external validation. The simulations below explore the typical-value dose-response curves for the two race strata and also generate a stochastic study-arm envelope using the published inter-trial SD (3.0 percent) and residual SD (3.1 percent).
mod_full <- readModelDb("Yang_2010_rosuvastatin_mbma")
mod_typ  <- rxode2::zeroRe(mod_full)
#> ℹ parameter labels from comments will be replaced by 'label()'
Replication: typical-value dose-response in Western and Asian arms (Yang 2010 Figure 3)
Figure 3 of the source paper plots the typical-value LDL-C reduction on a logarithmic dose axis for Western and Asian patients (solid and dashed lines, respectively). The Asian curve sits to the left of the Western curve, reflecting the lower ED50 (1.74 mg/day vs 0.981 mg/day, i.e. about twofold lower in Asians).
dose_grid <- c(0.1, 0.25, 0.5, 1, 2, 2.5, 5, 10, 20, 40, 80, 160)

ev_typ <- expand.grid(DOSE = dose_grid, RACE_ASIAN = 0:1) |>
  dplyr::mutate(
    id   = seq_len(dplyr::n()),
    time = 0,
    amt  = 0,
    evid = 0L,
    race = ifelse(RACE_ASIAN == 1, "Asian", "Western")
  ) |>
  dplyr::select(id, time, amt, evid, DOSE, RACE_ASIAN, race)

sim_typ <- rxode2::rxSolve(mod_typ, events = ev_typ,
                           keep = c("DOSE", "RACE_ASIAN", "race")) |>
  as.data.frame()
#> ℹ omega/sigma items treated as zero: 'eta_study_e0'
#> Warning: multi-subject simulation without without 'omega'

ggplot(sim_typ, aes(x = DOSE, y = Cc, colour = race, linetype = race)) +
  geom_line(linewidth = 0.9) +
  geom_point(size = 1.5) +
  scale_x_log10(breaks = c(0.1, 0.5, 1, 2.5, 5, 10, 20, 40, 80, 160)) +
  scale_colour_manual(values = c("Western" = "black", "Asian" = "steelblue")) +
  scale_linetype_manual(values = c("Western" = "solid", "Asian" = "dashed")) +
  labs(
    x        = "Rosuvastatin dose (mg/day, log scale)",
    y        = "LDL-C reduction from baseline (%)",
    colour   = NULL, linetype = NULL,
    title    = "Yang 2010 Figure 3 -- typical-value rosuvastatin dose-response",
    caption  = "Logarithmic dose axis. ED50 = 1.74 mg/day (Western) vs 0.981 mg/day (Asian)."
  ) +
  theme_bw() +
  theme(legend.position = "top")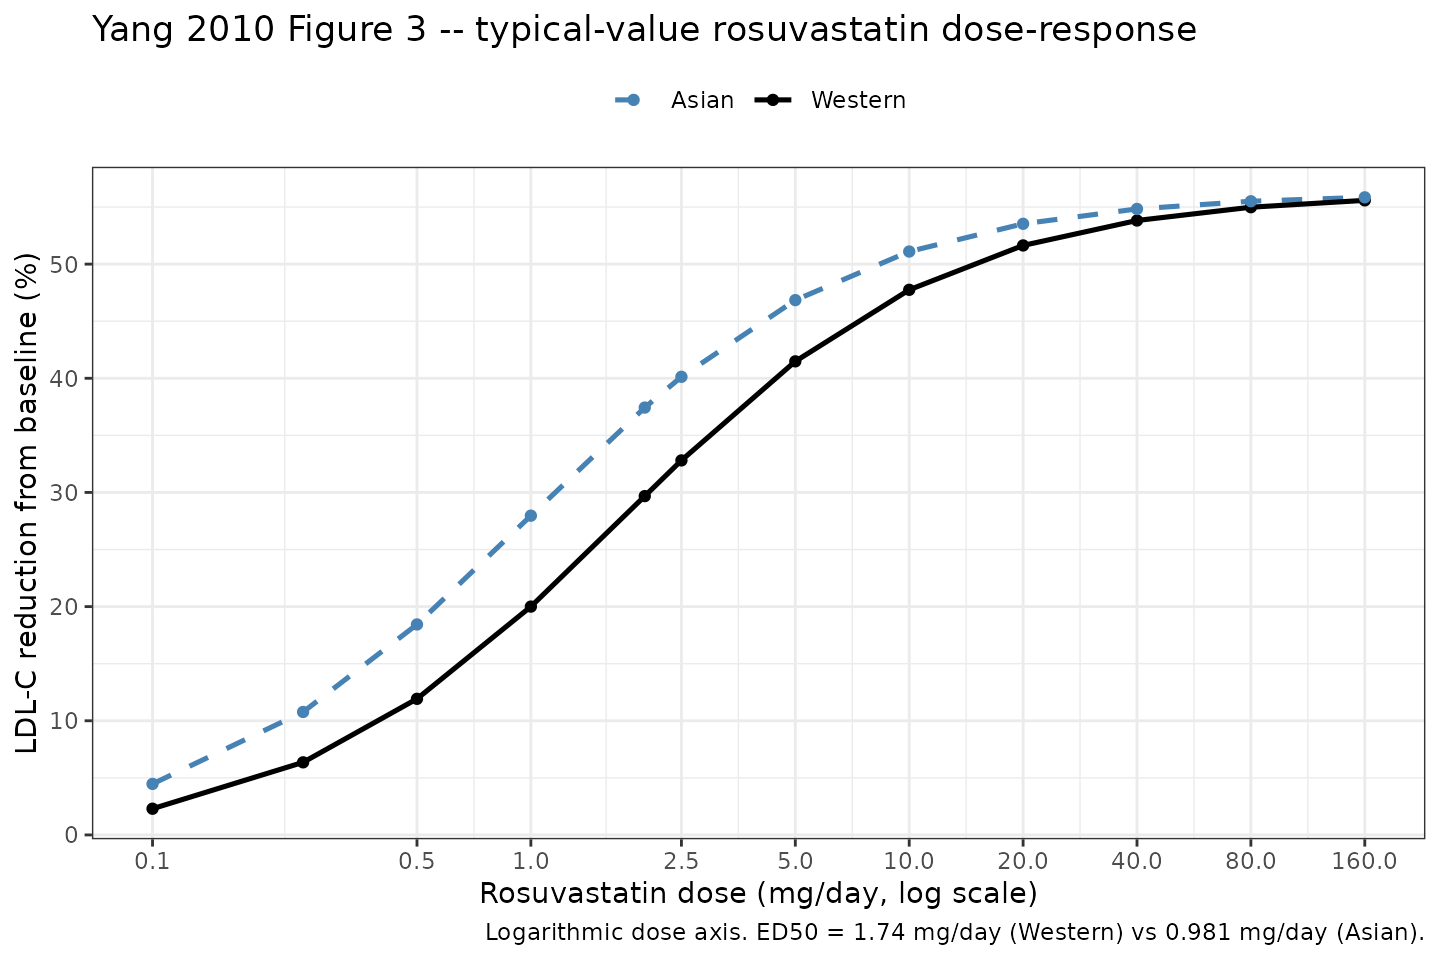
Replication of Yang 2010 Figure 3: typical-value rosuvastatin dose-response on a logarithmic dose axis in Western (solid) and Asian (dashed) hypercholesterolemia patients.
Sanity check: typical-value predictions at characteristic doses
A direct check at the ED50 reference dose: the simple Emax model
predicts E0 + Emax/2 = -0.802 + 57/2 = 27.7% at the Western
ED50 (1.74 mg/day) and at the Asian ED50 (0.981 mg/day) respectively.
The maximal LDL-C reduction predicted as dose tends to infinity is
E0 + Emax = -0.802 + 57.0 = 56.2% for both races (race
shifts the half-max location, not the asymptote).
ev_chk <- data.frame(
  id         = 1:6,
  time       = 0,
  amt        = 0,
  evid       = 0L,
  DOSE       = c(0, 1.74, 1e4, 0, 0.981, 1e4),
  RACE_ASIAN = c(0,    0,   0, 1,     1,   1),
  arm        = c("Western placebo", "Western @ ED50 (1.74)", "Western @ Dose -> Inf",
                 "Asian placebo",   "Asian @ ED50 (0.981)",  "Asian @ Dose -> Inf")
)

sim_chk <- rxode2::rxSolve(mod_typ, events = ev_chk, keep = c("arm", "DOSE", "RACE_ASIAN")) |>
  as.data.frame() |>
  dplyr::select(arm, DOSE, RACE_ASIAN, Cc) |>
  dplyr::mutate(
    expected = c(-0.802, -0.802 + 57.0/2, -0.802 + 57.0,
                 -0.802, -0.802 + 57.0/2, -0.802 + 57.0),
    delta    = Cc - expected
  )
#> ℹ omega/sigma items treated as zero: 'eta_study_e0'
#> Warning: multi-subject simulation without without 'omega'

knitr::kable(sim_chk, digits = 3,
caption = "Closed-form algebra spot-check: simulated Cc at characteristic doses vs the hand-computed E0 + Emax * D / (ED50_arm + D) expression. Differences below 0.01% confirm the simple Emax encoding is correct.")| arm | DOSE | RACE_ASIAN | Cc | expected | delta |
|---|---|---|---|---|---|
| Western placebo | 0.00e+00 | 0 | -0.802 | -0.802 | 0.000 |
| Western @ ED50 (1.74) | 1.74e+00 | 0 | 27.698 | 27.698 | 0.000 |
| Western @ Dose -> Inf | 1.00e+04 | 0 | 56.188 | 56.198 | -0.010 |
| Asian placebo | 0.00e+00 | 1 | -0.802 | -0.802 | 0.000 |
| Asian @ ED50 (0.981) | 9.81e-01 | 1 | 27.693 | 27.698 | -0.005 |
| Asian @ Dose -> Inf | 1.00e+04 | 1 | 56.192 | 56.198 | -0.006 |
Replication: observed vs typical-value reductions at clinically relevant doses (Yang 2010 Tables 1 and 2)
Tables 1 and 2 of the source paper list the mean (SE) percent LDL-C reduction at each study arm’s dose, race, baseline LDL-C, and trial. The typical-value predicted curves track the trial-by-trial means but do not match exactly because (a) each trial arm carries its own inter-trial random effect on the predicted output, and (b) the placebo arms in some trials report small but non-zero LDL-C reductions even though the fixed E0 of -0.802 percent predicts a small LDL-C increase.
observed <- tibble::tribble(
  ~trial, ~race,     ~year, ~DOSE, ~obs_reduction,
  "1",    "Western", 2001L,   0,             3.6,
  "1",    "Western", 2001L,   1,            34.3,
  "1",    "Western", 2001L,   2.5,          40.7,
  "1",    "Western", 2001L,   5,            42.5,
  "1",    "Western", 2001L,  10,            50.5,
  "1",    "Western", 2001L,  20,            57.0,
  "1",    "Western", 2001L,  40,            62.6,
  "1",    "Western", 2001L,  80,            64.8,
  "22",   "Western", 2003L,   5,            41.5,
  "22",   "Western", 2003L,  10,            46.6,
  "22",   "Western", 2003L,  20,            51.7,
  "22",   "Western", 2003L,  40,            56.8,
  "22",   "Western", 2003L,  80,            61.9,
  "14",   "Asian",   2003L,   0,             3.2,
  "14",   "Asian",   2003L,   1,            35.8,
  "14",   "Asian",   2003L,   2.5,          45.0,
  "14",   "Asian",   2003L,   5,            52.7,
  "14",   "Asian",   2003L,  10,            49.7,
  "14",   "Asian",   2003L,  20,            58.2,
  "14",   "Asian",   2003L,  40,            66.0,
  "25",   "Asian",   2002L,   1,            30.0,
  "25",   "Asian",   2002L,   2,            36.5,
  "25",   "Asian",   2002L,   4,            41.5
)

typ_curve <- sim_typ |>
  dplyr::select(DOSE, race, Cc_typ = Cc) |>
  dplyr::mutate(
    Cc_lo = Cc_typ - 3.0,
    Cc_hi = Cc_typ + 3.0
  )

ggplot() +
  geom_ribbon(data = typ_curve,
              aes(x = DOSE, ymin = Cc_lo, ymax = Cc_hi, fill = race),
              alpha = 0.18, colour = NA) +
  geom_line(data = typ_curve, aes(x = DOSE, y = Cc_typ, colour = race),
            linewidth = 0.9) +
  geom_point(data = observed,
             aes(x = pmax(DOSE, 0.5), y = obs_reduction,
                 colour = race, shape = trial),
             size = 2.4) +
  scale_x_log10(breaks = c(0.5, 1, 2.5, 5, 10, 20, 40, 80)) +
  scale_colour_manual(values = c("Western" = "black", "Asian" = "steelblue")) +
  scale_fill_manual(values = c("Western" = "grey50", "Asian" = "steelblue")) +
  labs(
    x        = "Rosuvastatin dose (mg/day, log scale; placebo arms placed at 0.5 mg for visibility)",
    y        = "LDL-C reduction from baseline (%)",
    colour   = NULL, fill = NULL, shape = "Trial",
    title    = "Yang 2010 Tables 1-2 -- observed vs typical-value dose-response",
    caption  = "Filled points: observed study-arm means from Tables 1 (Western) and 2 (Asian). Lines: typical-value model prediction. Ribbon: +/- 1 SD inter-trial envelope (eta_study_e0 SD 3.0 percent)."
  ) +
  theme_bw() +
  theme(legend.position = "top")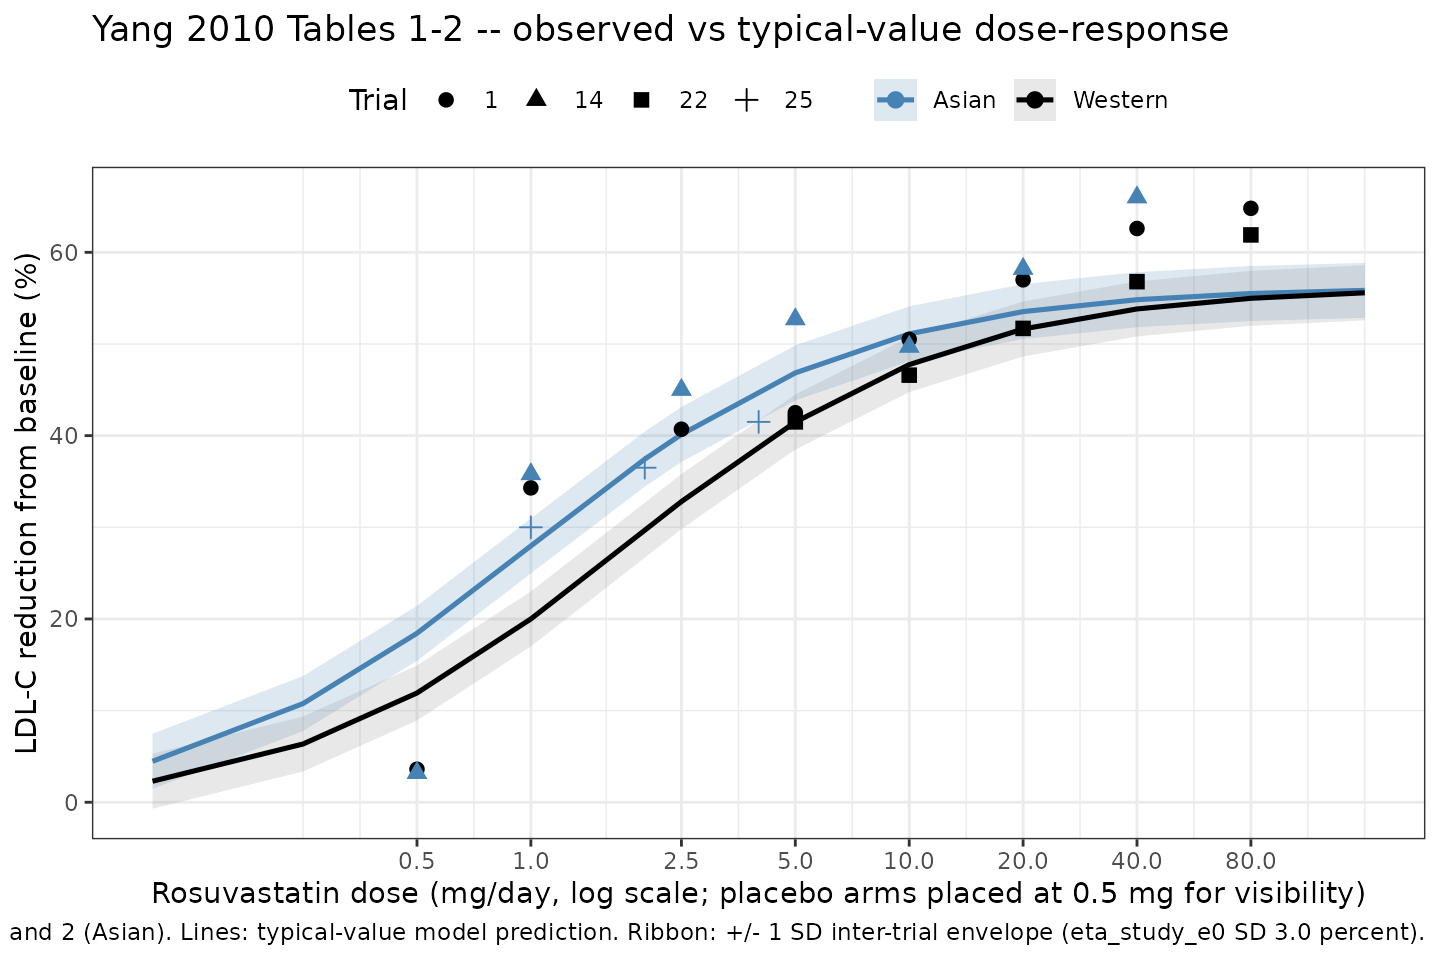
Replication of Yang 2010 Tables 1-2: observed study-arm-mean LDL-C reductions (filled points) vs the typical-value model prediction (lines) for representative dose-ranging arms in Western and Asian patients. The orange ribbon shows the +/- 1 SD inter-trial envelope contributed by eta_study_e0 (SD 3.0 percent).
Stochastic VPC of inter-trial variability (Yang 2010 Figure 6)
Figure 6 of the source paper shows a visual predictive check from 1000 Monte Carlo simulations comparing the typical-value dose-response curve and its 5th-95th percentile envelope against the 22 single-dose trial means held out as a validation set. Here we run the same Monte Carlo idea on the 14-trial dose-ranging grid using the inter-trial random effect plus the residual error.
set.seed(2024)
n_trial <- 200L
dose_vpc <- c(1, 2.5, 5, 10, 20, 40, 80)
race_vec <- c(0L, 1L)

ev_vpc <- expand.grid(DOSE = dose_vpc, RACE_ASIAN = race_vec, rep = seq_len(n_trial)) |>
  dplyr::mutate(
    id   = seq_len(dplyr::n()),
    time = 0,
    amt  = 0,
    evid = 0L,
    race = ifelse(RACE_ASIAN == 1L, "Asian", "Western")
  ) |>
  dplyr::select(id, time, amt, evid, DOSE, RACE_ASIAN, race)

sim_vpc <- rxode2::rxSolve(mod_full, events = ev_vpc,
                           keep = c("DOSE", "RACE_ASIAN", "race"),
                           nsim = 1) |>
  as.data.frame()
#> ℹ parameter labels from comments will be replaced by 'label()'

vpc_summary <- sim_vpc |>
  dplyr::group_by(DOSE, race) |>
  dplyr::summarise(
    Q05 = stats::quantile(Cc, 0.05, na.rm = TRUE),
    Q50 = stats::quantile(Cc, 0.50, na.rm = TRUE),
    Q95 = stats::quantile(Cc, 0.95, na.rm = TRUE),
    .groups = "drop"
  )

ggplot(vpc_summary, aes(x = DOSE)) +
  geom_ribbon(aes(ymin = Q05, ymax = Q95, fill = race), alpha = 0.25) +
  geom_line(aes(y = Q50, colour = race), linewidth = 0.9) +
  facet_wrap(~ race) +
  scale_x_log10(breaks = dose_vpc) +
  scale_colour_manual(values = c("Western" = "black", "Asian" = "steelblue")) +
  scale_fill_manual(values = c("Western" = "grey50", "Asian" = "steelblue")) +
  labs(
    x        = "Rosuvastatin dose (mg/day, log scale)",
    y        = "Arm-level LDL-C reduction (%)",
    colour   = NULL, fill = NULL,
    title    = "Yang 2010 Figure 6 -- inter-trial VPC envelope of arm-level LDL-C reductions",
    caption  = sprintf("Median (line) and 5th-95th percentile range (ribbon) across %d simulated trials per dose. Inter-trial SD = 3.0 percent, residual SD = 3.1 percent.", n_trial)
  ) +
  theme_bw() +
  theme(legend.position = "top")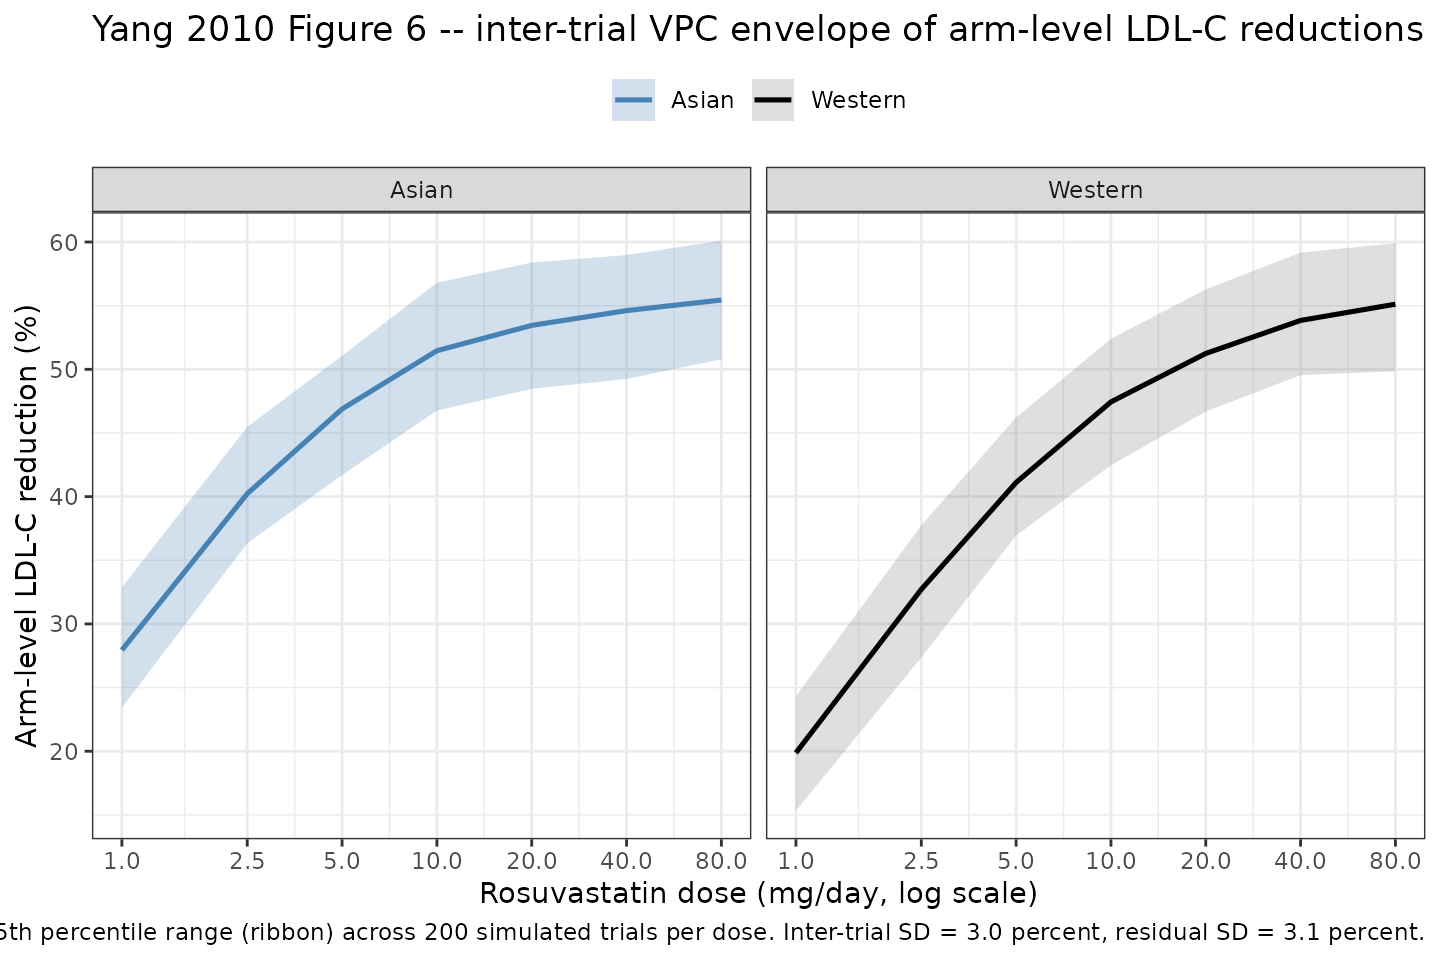
Inter-trial VPC of the Yang 2010 final MBMA model. 200 virtual trials per dose and race stratum; ribbon shows the 5th-95th percentile range of arm-level predicted LDL-C reductions, line shows the typical-value prediction.
NCA validation
This model is a steady-state dose-response (study-arm-mean percent LDL-C reduction); it has no PK time course and no concentration trajectory. Standard PKNCA NCA parameters (Cmax, Tmax, AUC, half-life) are therefore not applicable. Validation in this vignette is by direct comparison of model-predicted dose-response curves and parameter estimates against the source paper (Yang 2010 Figure 3 / Tables 1, 2, and 4).
Assumptions and deviations
E0andlhillare FIXED from the source paper, not estimated here. Yang 2010 holds the placebo interceptE0at -0.802 percent (the literature value from Mandema 2005) because the unconstrained sigmoidal fit produced a large RSE onE0(greater than 900 percent per the Discussion), and fixes the Hill sigmoidicity gamma at 1 because the sigmoidal Emax fit produced unstable parameters. Bothfixed()wrappers inini()reflect these structural choices; do not estimateE0orlhillagainst new data without first re-checking the original paper.eta_study_e0is a study-arm-level random intercept, NOT individual between-subject variability. This MBMA model operates on study-arm-mean data, so the eta represents trial-to-trial heterogeneity at the group-mean level. Simulations using the model are valid for reproducing arm-level summaries (mean percent LDL-C reduction per trial arm) but NOT for individual-patient LDL-C trajectories. The encoding follows theBoucher_2018_naproxen_mbmaconvention ofeta_study_<param>names for MBMA study-arm-level etas.RACE_ASIANis the only retained covariate; baseline LDL-C was screened in the forward-inclusion step but not retained, so it is recorded incovariatesDataExcludedrather thancovariateData. No point estimate is available in the source paper for the dropped baseline-LDL-C effect.Steady-state assumption: the source restricts each arm to at least 4 weeks of treatment (“maximum response is usually obtained within 2-4 weeks and is maintained during chronic therapy”). The model emits a single steady-state observation per arm and has no time component; short-duration dosing scenarios should not be simulated with this model.
Placebo arms in Tables 1-2 show observed mean LDL-C reductions of 0-3.6 percent, whereas the fixed
E0of -0.802 percent predicts a small LDL-C increase under placebo. Theeta_study_e0study-arm random effect absorbs this trial-by-trial heterogeneity in baseline response.Categorisation of races. Yang 2010 treats “Asian” as a single composite (Chinese, Japanese, and South Asian subjects pooled) and “Western” as a single composite (predominantly Whites / Caucasians). The canonical column
RACE_ASIANininst/references/covariate-columns.mdmaps to this composite without modification; finer race indicators (RACE_CHINESE,RACE_JAPANESE,RACE_ASIAN_NORTHEAST) are not used by this model because the source paper did not stratify Asian subjects further.