Pyrazinamide (Horita 2018)
Source:vignettes/articles/Horita_2018_pyrazinamide.Rmd
Horita_2018_pyrazinamide.RmdModel and source
- Citation: Horita Y, Alsultan A, Kwara A, Antwi S, Enimil A, Ortsin A, Dompreh A, Yang H, Wiesner L, Peloquin CA. Evaluation of the Adequacy of WHO Revised Dosages of the First-Line Antituberculosis Drugs in Children with Tuberculosis Using Population Pharmacokinetic Modeling and Simulations. Antimicrob Agents Chemother. 2018;62(9):e00008-18. doi:10.1128/AAC.00008-18
- Description: One-compartment population pharmacokinetic model with three-compartment transit absorption followed by first-order absorption and first-order elimination for oral pyrazinamide in Ghanaian children with active tuberculosis (Horita 2018); allometric weight scaling on V/F (estimated exponent 0.677) and CL/F (estimated exponent 0.735) normalised to the cohort median 14.3 kg.
- Article: https://doi.org/10.1128/AAC.00008-18
Population
The model was developed from 113 Ghanaian children with active tuberculosis enrolled at Komfo Anokye Teaching Hospital, Kumasi, Ghana between October 2012 and August 2015 (ClinicalTrials.gov NCT01687504). The cohort spans 3 months to 14 years of age and 5 to 30 kg in body weight (median 14.3 kg). 542 pyrazinamide concentration-time data points were available; 17 below-LLOQ values were left-censored and analyzed via the SAEM algorithm in MonolixSuite2016R1. Three children with only-BLQ values (malabsorption group) and one child with no observed peak were excluded from model building.
Children received pyrazinamide 30-40 mg/kg orally daily (median 24.7 mg/kg, IQR 22.6-29.7; note: median was below the WHO 2010 recommended range, reflecting the WHO-recommended dispersible / non-dispersible tablet sizes available at the study site). PK sampling was at steady state with blood samples at 0, 1, 2, 4, and 8 hours postdose. PZA was quantified by LC-MS/MS over 0.20 to 80 ug/mL.
The same information is available programmatically via
readModelDb("Horita_2018_pyrazinamide")$population.
Source trace
| Equation / parameter | Value | Source location |
|---|---|---|
| Structural model: 1-compartment with transit-compartment absorption | – | Results “PZA” paragraph 1; Table 4 |
MTT (mean transit time, paper-reported) |
0.33 h | Table 4 |
Ktr (transit-chain rate constant) |
12.5 1/h | Table 4 |
N (number of transit compartments, derived from MTT and
Ktr) |
3.13 (~3) | Table 4 |
ka (first-order absorption rate from last transit to
central) |
5.28 1/h | Table 4 |
V/F (typical at WT = 14.3 kg) |
13.1 L | Table 4 |
CL/F (typical at WT = 14.3 kg) |
1.6 L/h | Table 4 |
| Allometric exponent on CL/F (estimated) | 0.735 (RSE 10%) | Table 4 |
| Allometric exponent on V/F (estimated) | 0.677 (RSE 11%) | Table 4 |
| IIV on MTT (omega) | 0.443 (46.6% CV) | Table 4 |
| IIV on Ktr (omega) | 0.455 (48.0% CV) | Table 4 |
| IIV on ka (omega) | 2.05 (811.5% CV) | Table 4 |
| IIV on V/F (omega) | 0.370 (38.3% CV) | Table 4 |
| IIV on CL/F (omega) | 0.385 (40.0% CV) | Table 4 |
| Residual error: constant a | 0.268 ug/mL | Table 4 |
| Residual error: slope b | 0.112 (fraction) | Table 4 |
Virtual cohort
set.seed(20260526)

weight_bands <- tibble::tibble(
  band = c("5-7 kg", "8-14 kg", "15-20 kg", "21-30 kg"),
  weight_median = c(6.45, 12.5, 17.7, 22.4),
  dose_mg = c(300, 450, 450, 600),  # Horita 2018 Table 3: Cmax 20 ug/mL TA dose
  band_idx = seq_len(4)
)

n_per_band <- 100L
make_cohort <- function(band_idx, n, id_offset = 0L) {
  row <- weight_bands[band_idx, ]
  ids <- id_offset + seq_len(n)
  obs_times <- seq(0, 24, by = 0.5)
  rxode2::et(amt = row$dose_mg, time = 0, cmt = "depot") |>
    rxode2::et(obs_times) |>
    rxode2::et(id = ids) |>
    as.data.frame() |>
    dplyr::mutate(
      WT   = row$weight_median,
      band = row$band
    )
}

events <- dplyr::bind_rows(
  make_cohort(1L, n_per_band, id_offset =   0L),
  make_cohort(2L, n_per_band, id_offset = 200L),
  make_cohort(3L, n_per_band, id_offset = 400L),
  make_cohort(4L, n_per_band, id_offset = 600L)
)
stopifnot(!anyDuplicated(unique(events[, c("id", "time", "evid")])))
Simulation
mod <- readModelDb("Horita_2018_pyrazinamide")
sim <- rxode2::rxSolve(mod, events = events, keep = c("band", "WT"))
#> ℹ parameter labels from comments will be replaced by 'label()'
Replicate published figures
sim_cmax <- sim |>
  dplyr::filter(time <= 24, !is.na(Cc)) |>
  dplyr::group_by(id, band) |>
  dplyr::summarise(cmax = max(Cc), .groups = "drop")

ggplot(sim_cmax, aes(x = band, y = cmax)) +
  geom_boxplot(outlier.size = 0.5) +
  geom_hline(yintercept = 20.0, linetype = "dashed", colour = "red") +
  geom_hline(yintercept = 38.1, linetype = "dotted", colour = "red") +
  labs(x = "Weight band",
       y = "Simulated steady-state Cmax (ug/mL)",
       title = "Pyrazinamide steady-state Cmax by weight band",
       caption = "Replicates Horita 2018 Figure 7A. Dashed: 20 ug/mL adult normal range lower; dotted: 38.1 ug/mL paediatric treatment-outcome target.")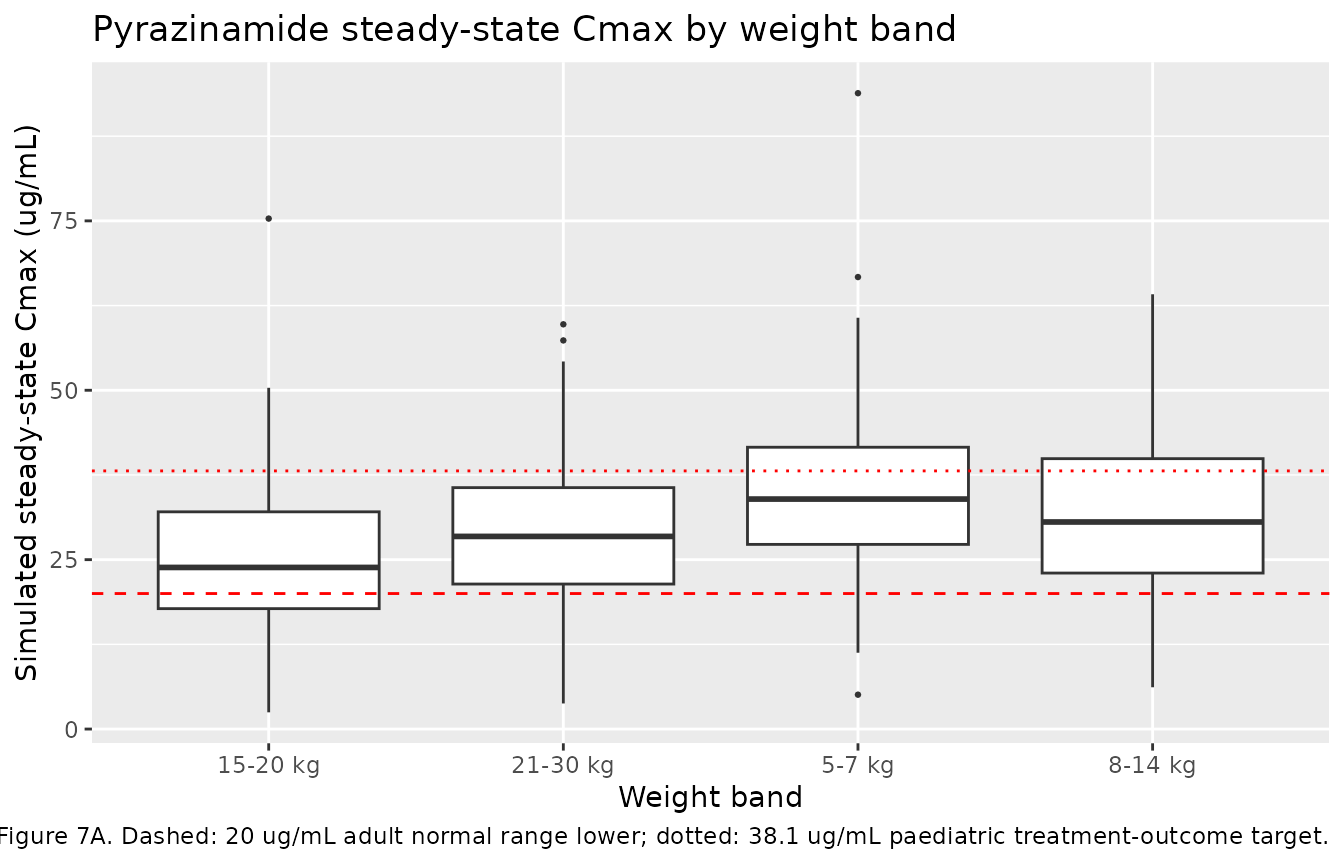
Replicates Figure 7 of Horita 2018 (pyrazinamide Cmax by weight band).
PKNCA validation
sim_nca <- sim |>
  dplyr::filter(!is.na(Cc), time <= 24) |>
  dplyr::select(id, time, Cc, band)

conc_obj <- PKNCA::PKNCAconc(sim_nca, Cc ~ time | band + id)

dose_df <- events |>
  dplyr::filter(evid == 1) |>
  dplyr::select(id, time, amt, band) |>
  dplyr::distinct()

dose_obj <- PKNCA::PKNCAdose(dose_df, amt ~ time | band + id)

intervals <- data.frame(
  start      = 0,
  end        = 24,
  cmax       = TRUE,
  tmax       = TRUE,
  auclast    = TRUE
)

nca_data <- PKNCA::PKNCAdata(conc_obj, dose_obj, intervals = intervals)
nca_res  <- PKNCA::pk.nca(nca_data)

nca_summary <- summary(nca_res)
knitr::kable(nca_summary, caption = "Simulated NCA parameters by weight band (Horita 2018 pyrazinamide).")| start | end | band | N | auclast | cmax | tmax |
|---|---|---|---|---|---|---|
| 0 | 24 | 15-20 kg | 100 | 191 [42.2] | 22.3 [57.7] | 1.00 [0.500, 21.5] |
| 0 | 24 | 21-30 kg | 100 | 238 [39.9] | 26.8 [43.9] | 1.00 [0.500, 8.50] |
| 0 | 24 | 5-7 kg | 100 | 304 [37.7] | 32.3 [42.7] | 1.00 [0.500, 13.0] |
| 0 | 24 | 8-14 kg | 100 | 263 [33.6] | 30.2 [40.4] | 1.00 [0.500, 10.5] |
Comparison against published NCA
Horita 2018 (Results “PZA” paragraph 1; supplementary Table S1) reports the observed cohort-pooled NCA: median dose 24.76 mg/kg (IQR 22.51-30.24), median Cmax 26.05 ug/mL (IQR 21.72-34.85), median AUC0-8 141.88 mg*h/L (IQR 112.26-183.42). Cmax and AUC0-8 were significantly lower in children under 12 years compared to adolescents (Results “PZA” paragraph 1).
Assumptions and deviations
- Reference weight 14.3 kg. See the rifampicin vignette for the reference-weight derivation. The PZA typical-value CL/F = 1.6 L/h at 14.3 kg back-scales to 5.30 L/h at 70 kg via the estimated exponent 0.735, matching the published adult typical value (Alsultan 2017: 5.06 L/h at 70 kg).
-
Transit-compartment N rounded to 3. Horita 2018
Table 4 reports N = 3.13 derived from
N + 1 = MTT * Ktr(the footnote formula). The model implementation uses 3 integer transit compartments (transit1,transit2,transit3) following the Bienczak 2016 nevirapine pattern. The rate-constant interpretationdepot -> transit1 -> transit2 -> transit3 -> centralat rateKtrfor the first three transitions andkafor the final transition matches the paper’s “transit compartment absorption” structural choice; the effective MTT through the chain is3/Ktr ~ 0.24 h(compared to the paper’s reportedMTT = (N+1)/Ktr = 0.33 husing its non-integer-N accounting). The difference does not materially affect the shape of the absorption profile. -
MTT IIV folded into Ktr IIV. Horita 2018 Table 4
lists separate IIV omegas for
MTTandKtr(0.443 and 0.455 respectively). WhenNis fixed andMTT = (N+1)/Ktr, the two are not independently identifiable – the omega onlog(Ktr)already captures the variability the paper attributes toMTT. The model encodes the IIV onlog(Ktr)only (omega = 0.455). - Combined residual error mapped via the Pythagorean (combined-2) form. See the rifampicin vignette for the rationale.
- Simulated cohort. The per-band doses are taken from Horita 2018 Table 3 (the 20-ug/mL Cmax target attainment row).