Sutimlimab (Bartko 2018)
Source:vignettes/articles/Bartko_2018_sutimlimab.Rmd
Bartko_2018_sutimlimab.RmdModel and source
- Citation: Bartko J, Schoergenhofer C, Schwameis M, Firbas C, Beliveau M, Chang C, Marier JF, Nix D, Gilbert JC, Panicker S, Jilma B (2018). A Randomized, First-in-Human, Healthy Volunteer Trial of sutimlimab, a Humanized Antibody for the Specific Inhibition of the Classical Complement Pathway. Clin Pharmacol Ther 104(4):655-663. doi:10.1002/cpt.1111.
- Description: Population pharmacodynamic sigmoidal inhibitory Emax (Imax) model for sutimlimab (BIVV009 / TNT009), a humanized monoclonal IgG4 antibody against complement factor C1s, describing knockdown of classical complement pathway (CP) activity in healthy volunteers. The direct-effect model has no delay component: Bartko 2018 first checked for hysteresis, found none, and therefore time-matched each individual sutimlimab serum concentration with the CP activity measured in the same sample. PD-only model: the sutimlimab serum concentration is supplied as a time-varying covariate CP_SUTIMLIMAB_UGML (ug/mL). The source publication characterised sutimlimab PK by model-independent NCA only (Cmax / tmax / AUC / half-life in Table 2) and did not develop a structural population PK model, so the PD model has no coupled PK component. The authors note the PK is nonlinear below about 100 ug/mL, consistent with target-mediated elimination. Population: 48 healthy volunteers who received sutimlimab in a phase I, first-in-human, double-blind, randomized, placebo-controlled single- (part A) and multiple- (part B) ascending-dose trial (NCT02502903).
- Article: https://doi.org/10.1002/cpt.1111
Sutimlimab (BIVV009 / TNT009; now marketed as Enjaymo) is a humanized monoclonal IgG4 antibody directed against complement factor C1s. By binding C1s it blocks the enzymatic propagation of the classical complement pathway (CP) while leaving the alternative and lectin pathways, and the opsonic function of C1q, intact. Bartko 2018 is the first-in-human trial: a phase I, double-blind, randomized, placebo-controlled, single- (part A) and multiple- (part B) ascending-dose study in healthy volunteers (NCT02502903).
The packaged model is the trial’s pharmacodynamic model: a direct-effect sigmoidal inhibitory Emax (Imax) relationship between serum sutimlimab concentration and CP activity. Bartko 2018 first checked the concentration-effect relationship for hysteresis, found none, and therefore time-matched each individual serum concentration with the CP activity measured in the same sample (Methods, “PK/PD”).
There is no packaged PK model, because the paper does not contain one: the sutimlimab pharmacokinetics are characterised by model-independent NCA only (Table 2). See Assumptions and deviations below.
Population
Bartko 2018 enrolled 64 healthy volunteers at a single centre (Department of Clinical Pharmacology, Medical University of Vienna, Austria), of whom 48 received sutimlimab and 16 received placebo. Part A gave a single ~60-minute i.v. infusion of 0.3, 1, 3, 10, 30, 60, or 100 mg/kg (n = 3 active for the two lowest doses, n = 6 active for the rest, 3:1 active:placebo). Part B gave four once-weekly ~60-minute i.v. infusions of 30 or 60 mg/kg (n = 6 active per dose level) with a two-week follow-up.
Across the sutimlimab arms the median age was 32 years (range 19-59) in part A and 27 years (22-41) in part B; 22 of 48 (45.8%) were female; 46 of 48 (95.8%) were Caucasian and 2 (4.2%) African. Cohort mean body weights ran from 55 kg (the 100 mg/kg cohort, which had a 58 kg protocol weight cap) to 79 kg; all other cohorts were capped at 98 kg. Baseline CP activity was normal in every subject (part A sutimlimab 97 +/- 14%, part B sutimlimab 94 +/- 18%). Baseline demographics are Bartko 2018 Table 1.
The same demographics are exposed programmatically via the model’s
population metadata:
pop <- rxode2::rxode(readModelDb("Bartko_2018_sutimlimab"))$population
str(pop, max.level = 1)
#> List of 13
#>  $ species       : chr "human"
#>  $ n_subjects    : int 48
#>  $ n_studies     : int 1
#>  $ age_range     : chr "19-59 years (part A sutimlimab arms, median 32); 22-41 years (part B sutimlimab arms, median 27)"
#>  $ age_median    : chr "32 years (part A sutimlimab); 27 years (part B sutimlimab)"
#>  $ weight_range  : chr "not tabulated as a range; cohort means (SD) ran 55 (3) to 79 (4) kg. Protocol excluded body weight > 98 kg, and"| __truncated__
#>  $ weight_median : chr NA
#>  $ sex_female_pct: num 45.8
#>  $ race_ethnicity: Named num [1:2] 95.8 4.2
#>   ..- attr(*, "names")= chr [1:2] "Caucasian" "African"
#>  $ disease_state : chr "healthy volunteers (no complement-mediated disorder); all vaccinated against encapsulated bacterial pathogens before dosing"
#>  $ dose_range    : chr "Part A (single ascending dose): 0.3, 1, 3, 10, 30, 60, or 100 mg/kg sutimlimab or placebo as a single ~60-minut"| __truncated__
#>  $ regions       : chr "Single centre: Department of Clinical Pharmacology, Medical University of Vienna, Austria"
#>  $ notes         : chr "Baseline demographics are Bartko 2018 Table 1; 48 of the 64 enrolled volunteers received sutimlimab (36 in part"| __truncated__
Source trace
The per-parameter origin is recorded as in-file comments next to each
ini() entry in
inst/modeldb/specificDrugs/Bartko_2018_sutimlimab.R. The
table below collects them in one place for review. All four typical
values come from Supplementary Table S3, “PK/PD parameters of BIVV009
and CP activity - parts A and B”; the parenthesised figures in that
table are relative standard errors of the estimate (RSE%),
i.e. parameter precision, and are not interindividual
variability.
| Equation / parameter | Value (RSE%) | Source location |
|---|---|---|
E0 (le0 = log(94.8)) |
94.8% (1.1) | Bartko 2018 Supplementary Table S3 |
Imax (limax = log(90.2)) |
90.2 percentage points (1.1) | Bartko 2018 Supplementary Table S3; also Results, “PK/PD correlations” |
IC50 (lic50 = log(6.2)) |
6.2 ug/mL (27.5) | Bartko 2018 Supplementary Table S3; also Results, “PK/PD correlations” |
hill (lhill = log(2.4)) |
2.4 (19.9) | Bartko 2018 Supplementary Table S3; also Abstract and Results |
addSd = fixed(0) |
not reported | Not tabulated anywhere in Bartko 2018 or its five supplementary files – see Assumptions and deviations |
Sigmoidal Imax equation
CPactivity = e0 - imax * C^hill / (ic50^hill + C^hill)
|
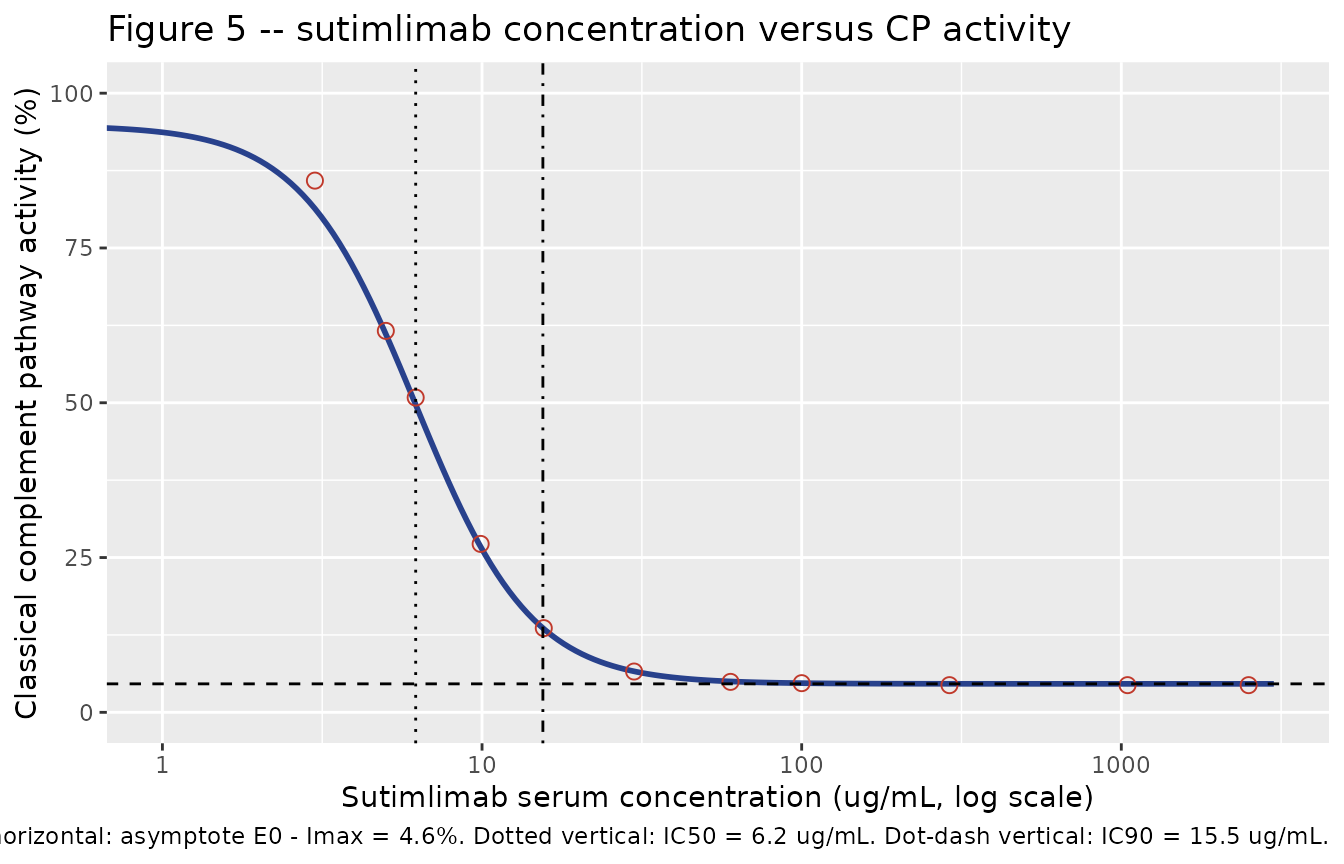
n/a | Bartko 2018 Methods, “PK/PD” (“inhibitory Emax model”), Results “PK/PD correlations”, and the fitted curve in Figure 5 |
| Direct effect (no effect compartment, no hysteresis) | n/a | Bartko 2018 Results, “PK/PD correlations” (“no delay was observed in CP activity”; concentrations and CP activity were time-matched) |
Driving covariate CP_SUTIMLIMAB_UGML
|
ug/mL | Bartko 2018 Methods, “Pharmacokinetics” (validated immunoassay, Vela Laboratories) |
| IC90 = 15.5 ug/mL (cross-check, not a model parameter) | 15.5 ug/mL | Bartko 2018 Abstract and Results, “PK/PD correlations” |
Internal consistency of the published parameter set
The paper reports an IC90 of 15.5 ug/mL separately from IC50 and the
Hill coefficient. Under the sigmoidal form, the concentration producing
90% of the maximum effect is IC50 * 9^(1/hill). That
identity over-determines the parameter set and validates all three
transcriptions at once:
Which Imax parameterisation?
Supplementary Table S3 reports E0 (%) = 94.8 and
Imax (%) = 90.2 without writing out the equation, which
leaves two readings of how Imax enters:
-
additive –
Imaxis in the same units asE0(percentage points), so the saturating asymptote isE0 - Imax = 4.6%; -
multiplicative –
Imaxis a fraction ofE0, so the asymptote isE0 * (1 - 0.902) = 9.29%.
The paper’s own fitted curve in Figure 5 settles it. Digitising the
blue “Predicted” line (300 dpi render of the published page; y-axis
calibrated on the 0/50/100/150 major ticks, x-axis on the
1/10/100/1000/10000 decade ticks) gives a curve that runs from 94.5% at
its left end down to a high-concentration plateau of 4.2-4.4%. That is a
span of 90.3 percentage points, which reproduces
Imax = 90.2 directly and is only possible under the
additive form.
# Anchor points read off the published Figure 5 "Predicted" curve.
fig5 <- tibble::tribble(
  ~conc,   ~digitised,
     3.0,       85.88,
     5.0,       61.61,
     6.2,       50.84,
     9.9,       27.20,
    15.6,       13.60,
    29.9,        6.59,
    59.9,        4.92,
   100.0,        4.71,
   290.0,        4.39,
  1045.9,        4.39,
  2502.2,        4.39
)

e0 <- 94.8; imax <- 90.2
frac <- function(cc) cc^hill / (ic50^hill + cc^hill)

fig5 <- fig5 |>
  dplyr::mutate(
    additive       = e0 - imax * frac(conc),
    multiplicative = e0 * (1 - (imax / 100) * frac(conc))
  )

knitr::kable(
  fig5 |>
    dplyr::mutate(dplyr::across(c(digitised, additive, multiplicative), \(x) round(x, 2))) |>
    dplyr::rename(
      "Sutimlimab (ug/mL)"       = conc,
      "Figure 5 (digitised, %)"  = digitised,
      "Additive form (%)"        = additive,
      "Multiplicative form (%)"  = multiplicative
    ),
  caption = "Published Figure 5 fitted curve versus the two candidate Imax parameterisations."
)| Sutimlimab (ug/mL) | Figure 5 (digitised, %) | Additive form (%) | Multiplicative form (%) |
|---|---|---|---|
| 3.0 | 85.88 | 81.36 | 82.06 |
| 5.0 | 61.61 | 61.09 | 62.84 |
| 6.2 | 50.84 | 49.70 | 52.05 |
| 9.9 | 27.20 | 26.74 | 30.28 |
| 15.6 | 13.60 | 13.48 | 17.71 |
| 29.9 | 6.59 | 6.62 | 11.21 |
| 59.9 | 4.92 | 4.99 | 9.66 |
| 100.0 | 4.71 | 4.71 | 9.40 |
| 290.0 | 4.39 | 4.61 | 9.30 |
| 1045.9 | 4.39 | 4.60 | 9.29 |
| 2502.2 | 4.39 | 4.60 | 9.29 |
# Root-mean-square disagreement with the published curve, over the anchors at
# or above 5 ug/mL (the left-most terminus of the drawn line is a rendering
# artefact and is excluded; see the narrative below).
keep <- fig5$conc >= 5
rmse <- c(
  additive       = sqrt(mean((fig5$digitised[keep] - fig5$additive[keep])^2)),
  multiplicative = sqrt(mean((fig5$digitised[keep] - fig5$multiplicative[keep])^2))
)
round(rmse, 3)
#>       additive multiplicative
#>          0.440          4.089

# The additive form must beat the multiplicative form by a wide margin. Both
# sides here are deterministic (fixed published constants against fixed
# digitised anchors), so an exact bound is appropriate.
stopifnot(
  rmse[["additive"]] < 1,
  rmse[["multiplicative"]] > 3,
  rmse[["multiplicative"]] > 4 * rmse[["additive"]]
)
Over the full digitised trace (403 sampled columns; the 349 at or above 5 ug/mL) the additive form reproduces the published curve with an RMSE of 0.35 percentage points and a maximum absolute error of 1.17, while the multiplicative form is systematically 3-5 percentage points high with an RMSE of 4.32. The two forms are nearly indistinguishable below ~3 ug/mL, so the left-most few pixels of the drawn line – where the published curve terminates at the lowest observed concentration and reads about 8 points above both candidate forms – cannot discriminate between them and is excluded above.
Virtual cohort
The model is algebraic and carries no interindividual variability and no residual error (see Assumptions and deviations), so it is fully deterministic: one “subject” evaluated over a concentration grid reproduces the population prediction exactly, and a larger cohort would add nothing. The grid below spans the range of serum concentrations actually observed in the trial, from below the IC50 up to the highest mean Cmax (2073 ug/mL, part B multiple 60 mg/kg; Table 2).
Simulation
mod <- readModelDb("Bartko_2018_sutimlimab")

sim <- rxode2::rxSolve(
  mod,
  events = events,
  keep   = "CP_SUTIMLIMAB_UGML"
) |>
  as.data.frame()

head(sim[, c("time", "CP_SUTIMLIMAB_UGML", "CPactivity")])
#>   time CP_SUTIMLIMAB_UGML CPactivity
#> 1    0          0.0000000   94.80000
#> 2    1          0.5000000   94.58622
#> 3    2          0.5223429   94.56264
#> 4    3          0.5456842   94.53645
#> 5    4          0.5700685   94.50740
#> 6    5          0.5955425   94.47514
Replicate published figures
Figure 5 – CP activity versus serum sutimlimab concentration
# Replicates the "Predicted" curve of Figure 5 of Bartko 2018.
sim |>
  dplyr::filter(CP_SUTIMLIMAB_UGML > 0) |>
  ggplot(aes(CP_SUTIMLIMAB_UGML, CPactivity)) +
  geom_line(linewidth = 1, colour = "#28418c") +
  geom_point(
    data = fig5, aes(conc, digitised),
    inherit.aes = FALSE, shape = 1, size = 2.5, colour = "#c0392b"
  ) +
  geom_hline(yintercept = 94.8 - 90.2, linetype = "dashed") +
  geom_vline(xintercept = 6.2,  linetype = "dotted") +
  geom_vline(xintercept = 15.5, linetype = "dotdash") +
  scale_x_log10(breaks = c(1, 10, 100, 1000, 10000)) +
  coord_cartesian(xlim = c(1, 3000), ylim = c(0, 100)) +
  labs(
    x       = "Sutimlimab serum concentration (ug/mL, log scale)",
    y       = "Classical complement pathway activity (%)",
    title   = "Figure 5 -- sutimlimab concentration versus CP activity",
    caption = paste(
      "Line: packaged model. Open circles: anchors digitised from the published",
      "Figure 5 curve. Dashed horizontal: asymptote E0 - Imax = 4.6%.",
      "Dotted vertical: IC50 = 6.2 ug/mL. Dot-dash vertical: IC90 = 15.5 ug/mL."
    )
  )
PD checks (no PKNCA)
Bartko 2018 characterises sutimlimab PK with model-independent NCA
only (Cmax, tmax, AUC0-inf, AUC0-168 and half-life by cohort in Table 2)
and does not fit a structural population PK model. The packaged model is
PD-only – driven by an externally supplied
CP_SUTIMLIMAB_UGML covariate – so there is no
model-predicted concentration-time profile to integrate and the PKNCA
validation pattern used elsewhere in the package does not apply. The
checks below take its place.
Closed-form agreement
Every quantity here is deterministic (no etas, residual error fixed to zero), so the solver output must match the closed form to numerical tolerance.
Published anchor points
anchor_conc <- c(0, 6.2, 15.5, 100, 1e5)
anchors <- rxode2::rxSolve(
  mod,
  events = tibble::tibble(
    id = 1L, time = seq_along(anchor_conc) - 1, evid = 0L, amt = 0,
    CP_SUTIMLIMAB_UGML = anchor_conc
  ),
  keep = "CP_SUTIMLIMAB_UGML"
) |>
  as.data.frame()

# Fraction of the maximum effect achieved at each anchor.
anchors$frac_of_imax <- (e0 - anchors$CPactivity) / imax

knitr::kable(
  anchors |>
    dplyr::transmute(
      "Sutimlimab (ug/mL)"    = CP_SUTIMLIMAB_UGML,
      "CP activity (%)"       = round(CPactivity, 3),
      "Fraction of Imax"      = round(frac_of_imax, 4),
      "Published anchor"      = c(
        "E0 = 94.8% (Table S3)",
        "IC50 = 6.2 ug/mL -> 50% of Imax (Table S3)",
        "IC90 = 15.5 ug/mL -> 90% of Imax (Abstract, Results)",
        "'concentrations above 100 ug/mL ... near-maximal knockdown' (Results)",
        "asymptote E0 - Imax = 4.6% (Table S3)"
      )
    ),
  caption = "Typical-value evaluation at the concentrations Bartko 2018 anchors explicitly."
)| Sutimlimab (ug/mL) | CP activity (%) | Fraction of Imax | Published anchor |
|---|---|---|---|
| 0.0 | 94.800 | 0.0000 | E0 = 94.8% (Table S3) |
| 6.2 | 49.700 | 0.5000 | IC50 = 6.2 ug/mL -> 50% of Imax (Table S3) |
| 15.5 | 13.605 | 0.9002 | IC90 = 15.5 ug/mL -> 90% of Imax (Abstract, Results) |
| 100.0 | 4.714 | 0.9987 | ‘concentrations above 100 ug/mL … near-maximal knockdown’ (Results) |
| 100000.0 | 4.600 | 1.0000 | asymptote E0 - Imax = 4.6% (Table S3) |
stopifnot(
  # Zero concentration returns the published baseline exactly.
  abs(anchors$CPactivity[1] - 94.8) < 1e-9,
  # IC50 delivers exactly half of Imax.
  abs(anchors$frac_of_imax[2] - 0.50) < 1e-9,
  # The paper's separately reported IC90 delivers 90% of Imax. This is the
  # strongest single check available: it ties the published IC90 to the
  # published IC50 and Hill coefficient without using any of them twice.
  abs(anchors$frac_of_imax[3] - 0.90) < 0.001,
  # 100 ug/mL is within a quarter of a percentage point of the asymptote,
  # which is what "near-maximal knockdown" means quantitatively.
  anchors$CPactivity[4] - (94.8 - 90.2) < 0.25,
  # The saturating asymptote is E0 - Imax, not E0 * (1 - Imax/100).
  abs(anchors$CPactivity[5] - (94.8 - 90.2)) < 1e-6
)
Comparison against published observations
Bartko 2018 reports no NCA of the PD endpoint, but it does make several quantitative claims about the depth of CP-activity knockdown at the observed exposures. Feeding the paper’s own mean Cmax values (Table 2) through the model reproduces them.
cmax_tab <- tibble::tribble(
  ~part,                        ~dose_mgkg, ~cmax_ugml,
  "A, single",                         3,          40,
  "A, single",                        10,         211,
  "A, single",                        30,         602,
  "A, single",                        60,        1464,
  "A, single",                       100,        2036,
  "B, single (first dose)",           30,         653,
  "B, single (first dose)",           60,        1252,
  "B, multiple (4th dose)",           30,         832,
  "B, multiple (4th dose)",           60,        2073
)

cmax_sim <- rxode2::rxSolve(
  mod,
  events = tibble::tibble(
    id = 1L, time = seq_len(nrow(cmax_tab)) - 1, evid = 0L, amt = 0,
    CP_SUTIMLIMAB_UGML = cmax_tab$cmax_ugml
  ),
  keep = "CP_SUTIMLIMAB_UGML"
) |>
  as.data.frame()

cmax_tab <- cmax_tab |>
  dplyr::mutate(
    cp_at_cmax  = cmax_sim$CPactivity,
    suppression = 100 * (e0 - cp_at_cmax) / e0
  )

knitr::kable(
  cmax_tab |>
    dplyr::transmute(
      "Part"                        = part,
      "Dose (mg/kg)"                = dose_mgkg,
      "Published mean Cmax (ug/mL)" = cmax_ugml,
      "Predicted CP activity (%)"   = round(cp_at_cmax, 2),
      "Suppression vs E0 (%)"       = round(suppression, 1)
    ),
  caption = paste(
    "Predicted CP activity at each cohort's published mean Cmax",
    "(Bartko 2018 Table 2)."
  )
)| Part | Dose (mg/kg) | Published mean Cmax (ug/mL) | Predicted CP activity (%) | Suppression vs E0 (%) |
|---|---|---|---|---|
| A, single | 3 | 40 | 5.62 | 94.1 |
| A, single | 10 | 211 | 4.62 | 95.1 |
| A, single | 30 | 602 | 4.60 | 95.1 |
| A, single | 60 | 1464 | 4.60 | 95.1 |
| A, single | 100 | 2036 | 4.60 | 95.1 |
| B, single (first dose) | 30 | 653 | 4.60 | 95.1 |
| B, single (first dose) | 60 | 1252 | 4.60 | 95.1 |
| B, multiple (4th dose) | 30 | 832 | 4.60 | 95.1 |
| B, multiple (4th dose) | 60 | 2073 | 4.60 | 95.1 |
stopifnot(
  # "complete inhibition, defined by CP activity < 10%, was achieved in all
  # subjects who received a sutimlimab dose of 3 mg/kg or higher" (Discussion).
  all(cmax_tab$cp_at_cmax < 10),
  # "A single infusion of 3, 10, 30, 60, and 100 mg/kg sutimlimab suppressed CP
  # activity by > 90% within 1 hour after the start of the infusion" (Results,
  # Pharmacodynamics).
  all(cmax_tab$suppression > 90)
)
Every cohort’s mean Cmax sits far above the IC90 of 15.5 ug/mL – the lowest, 40 ug/mL at 3 mg/kg, is already 2.6-fold above it – so the model predicts CP activity between 4.6% and 5.6% at peak in every cohort, i.e. 94-95% suppression. That is consistent with both published claims, and with the observation that the 0.3 and 1 mg/kg cohorts (whose serum concentrations were below the limit of quantification throughout) showed “little effect on CP activity”.
The model deliberately says nothing about the duration of suppression, which the paper reports as ranging from 8 hours at 3 mg/kg to 14 days at 100 mg/kg. Duration is a function of the concentration-time profile, and reproducing it would require a PK model that Bartko 2018 does not provide.
Assumptions and deviations
-
No structural PK model, by construction. Bartko
2018 characterises sutimlimab PK with model-independent NCA only
(Methods, “Pharmacokinetics”; Table 2) and explicitly reports that
elimination is nonlinear below about 100 ug/mL, consistent with
target-mediated disposition: AUC0-168 rose 12.2-fold from 3 to 10 mg/kg
and 7.7-fold from 10 to 30 mg/kg, but only 2.5- and 1.6-fold over 30-60
and 60-100 mg/kg, and mean half-life lengthened from 19 to 132 hours
across the 10-100 mg/kg range. A linear compartmental model would not
capture that, and the paper fits none. The packaged model is therefore
PD-only: users must supply their own
CP_SUTIMLIMAB_UGMLtrajectory (observed concentrations, or a PK model from another source). No sutimlimab population PK model currently exists in the nlmixr2lib registry. -
Imaxenters additively; established by digitising the published Figure 5. Supplementary Table S3 givesE0 (%)andImax (%)without the equation. The additive reading (asymptoteE0 - Imax= 4.6%) and the multiplicative reading (asymptoteE0 * (1 - Imax/100)= 9.29%) are both grammatical. The published fitted curve spans 94.5% down to a 4.2-4.4% plateau – a 90.3-percentage-point span that reproducesImax = 90.2– and matches the additive form with an RMSE of 0.35 percentage points against 4.32 for the multiplicative form. The digitisation is used only to choose between two readings of the paper’s own printed parameters; no parameter value is taken from the figure. See the section “Which Imax parameterisation?” above. -
No interindividual variability and no residual error are
reported, so none are invented. Supplementary Table S3 lists
exactly four values, each with an RSE% (parameter precision, not IIV):
E0 94.8 (1.1), Imax 90.2 (1.1), IC50 6.2 (27.5), H 2.4 (19.9). No omega,
no sigma, and no residual-error model appear anywhere in the paper or in
any of its five supplementary files.
addSdis therefore encoded asfixed(0)rather than given an invented magnitude, and the model predicts typical values only. A user fitting this model to new data should estimate both IIV and residual error from that data. Note that the paper’s own Figure 5 shows substantial scatter around the fitted line, particularly in the dense low-concentration column, so real between-subject and residual variability is clearly non-zero – it is simply not quantified in the source. -
Supplementary Table S3 is a separate file from the article
PDF. The four parameter values are not printed in the main text
as a set; the main text quotes Imax (90.2%), IC50 (6.2 ug/mL), the Hill
coefficient (2.4) and the IC90 (15.5 ug/mL) in prose, but the baseline
E0 = 94.8%and all four RSE% figures appear only in Supplementary Table S3. That file (CPT-104-655-s003.docx) is part of the supplementary material published with the open-access article (PMC6175298). - Direct effect, no hysteresis. Bartko 2018 states that exploratory analysis found “no delay … in CP activity” and that individual concentrations and CP activities were therefore time-matched (Results, “PK/PD correlations”). The packaged model has no effect compartment. The supporting hysteresis analysis itself is described as “results retained on file” and is not reproducible from the publication.
- Healthy volunteers only. The trial’s part C, in patients with a complement-mediated disorder (cold agglutinin disease, warm autoimmune hemolytic anemia, bullous pemphigoid, or antibody-mediated transplant rejection), was ongoing at publication and is not reported here. The paper cautions that PD may differ in the target populations. The packaged model’s parameters are healthy-volunteer estimates.
- Anti-drug antibodies are not modelled. Confirmed ADA was detected in two part A subjects (42 and 28 ng/mL) and in four part B subjects. The paper argues the measured ADA concentrations were 500-1000-fold below the drug levels needed for a PD effect and reports no distinguishable CP-activity difference, so no ADA covariate is included. One part B 30 mg/kg subject with pre-existing ADA did show faster CP-activity reversal (Figure S1); that individual behaviour is not captured by a typical-value model.
- Body weight is not a covariate. Figure 3 shows negative regression slopes of AUClast, Cmax, and half-life against body weight, but the authors deliberately did not perform a formal covariate analysis (fewer than 50 subjects), and describe those plots as exploratory only. No weight effect is encoded. Note also that dosing was already mg/kg, so body size is partly accounted for in the dose.
-
Observation variable name
CPactivity(notCc).checkModelConventions()warns thatCPactivityis not a canonical single-output observation name. The convention defaultCcis reserved for drug concentrations; the Bartko 2018 observation is classical complement pathway activity expressed as a percentage of the assay’s normal reference, not a concentration. The paper’s own term is retained for source-trace fidelity, no rename is performed, and no new canonical is registered. This is the same accepted deviation carried byWeber_1993_remikiren(observationAPR), the closest structural sibling in the registry. -
Units of CP activity. CP activity is a
semiquantitative readout of the commercial WIESLAB Complement System
Classical Pathway enzyme immunoassay (Euro Diagnostica, Malmo, Sweden),
reported as a percentage of the assay’s normal reference. Values above
100% are therefore possible and are visible in Figure 5; the model’s
E0of 94.8% is the fitted population baseline, close to but not identical with the observed group means (97% part A, 94% part B).