4GI glucose regulation with liraglutide (Bosch 2022)
Source:vignettes/articles/Bosch_2022_liraglutide_qsp.Rmd
Bosch_2022_liraglutide_qsp.RmdModel and source
- Citation: Bosch R, Petrone M, Arends R, Vicini P, Sijbrands EJG, Hoefman S, Snelder N. A novel integrated QSP model of in vivo human glucose regulation to support the development of a glucagon/GLP-1 dual agonist. CPT Pharmacometrics Syst Pharmacol. 2022;11(3):302-317. doi:10.1002/psp4.12752.
- Description: QSP. Integrated four-hormone-plus-glucose (4GI) model of human glucose regulation coupling glucose, insulin, GLP-1, glucagon, and glucose-dependent insulinotropic peptide (GIP) dynamics after meal and drug perturbation, with liraglutide (GLP-1RA) PK+PD baked in as the training drug. Glucose disposition is a two-compartment model with insulin-dependent and -independent elimination fed by an oral-meal dose compartment plus a buffer and three serial gut transit compartments; insulin, GLP-1, glucagon, and GIP each have one-compartment (GIP two-compartment) turnover with steady-state baseline production. Feedbacks: glucose stimulates insulin production (amplified by GLP-1 and GIP); insulin drives insulin-dependent glucose clearance through an effect compartment; glucose inhibits glucagon production (a below-baseline glucose-on-glucagon effect is estimable in healthy volunteers only); glucagon and GIP each stimulate glucagon and glucose production; GLP-1 inhibits gastric emptying and glucagon production, and stimulates insulin secretion. Liraglutide PK is the Watson 2010 body-weight-scaled one-compartment model (KAdrug 0.154 /h, CL/F 0.013 L/h/kg, V/F 0.16 L/kg, fu 0.005) and drives the three GLP-1 receptor pathways via unbound-liraglutide EC50s derived from the in vitro EC50 ratio between endogenous GLP-1 (1.919 pM) and liraglutide (6 pM). Population-mean fits only (no IIV per Bosch 2022 Methods; five proportional residual errors, one per biomarker output). Healthy volunteer (HV) vs type 2 diabetes mellitus (T2DM) subjects differ in glucose clearance, insulin-dependent glucose clearance, the below-baseline glucose-on-glucagon exponent, and the GIP-on-insulin-secretion exponent, switched by the DIS_DIAB indicator (1 = T2DM, 0 = HV). 18 ODE states; 5 outputs.
- Article (open access): https://doi.org/10.1002/psp4.12752
- Supplementary NONMEM code: https://doi.org/10.1002/psp4.12752 (Appendix S1)
The 4GI model integrates five signalling species (glucose, insulin, GLP-1, glucagon, GIP) coupled by mass-action ODEs and Emax/Hill drug-effect saturation. It is a mechanistic decision-support tool developed by Bosch et al. (2022) at LAP&P Consultants / AstraZeneca for the development of the GLP-1/glucagon dual agonist cotadutide; the paper trains it on liraglutide plus a large mix of nonpharmacological perturbations and externally validates the model against dulaglutide and semaglutide arms.
Population
The model was calibrated to a pooled mean-per-study dataset digitized from twelve published clinical studies covering healthy volunteers, healthy obese subjects, and adults with type 2 diabetes mellitus (T2DM), spanning IV glucose provocations, oral meals, IV GLP-1 / GIP / glucagon infusions, and up to 52 weeks of once-daily subcutaneous liraglutide (LEAD-3 / LEAD-6 / AWARD-6). Because Bosch et al. digitized published mean profiles rather than individual-level data, no between-subject variability (BSV) or between-occasion variability (BOV) is estimated and every simulation from this model is a typical-value prediction.
The full study list is in the model’s
population$disease_state metadata:
mod_meta <- readModelDb("Bosch_2022_liraglutide_qsp")()
mod_meta$population$disease_state |> strwrap(width = 70) |> writeLines()
#> Pooled healthy volunteers, healthy obese volunteers, and adults with
#> type 2 diabetes mellitus from 12 published clinical studies used as
#> development data (10 studies: Silber 2007 IVGTT +/- insulin in HV and
#> T2DM; Jauslin 2011 24-h meal profiles in T2DM; Landersdorfer 2011
#> 24-h meal profiles in T2DM; Tan 2012 IV GLP-1 +/- glucagon in healthy
#> obese; Edholm 2010 meal + IV GLP-1 or GIP in HV; Vilsboll 2006 IV GIP
#> in HV and T2DM; Vilsboll 2002 IV glucose + GLP-1 or GIP in HV and
#> obese T2DM; Larsen 2001 meal + IV GLP-1 in T2DM; Schneck 2013 meal in
#> T2DM; Camastra 2013 meal in morbidly-obese T2DM and non-diabetic
#> controls) and 3 long-term liraglutide studies (LEAD-3 52 weeks,
#> LEAD-6 40 weeks, AWARD-6 26 weeks); validation is against the
#> dulaglutide arms of AWARD-6 and the dulaglutide + semaglutide arms of
#> SUSTAIN-7 (also 40 weeks).
Two covariates are consumed by the model in a downstream simulation:
-
DIS_DIAB(binary, 1 = T2DM, 0 = healthy volunteer). Switches the fixed glucose disposition parameters and disables the HV-only below-baseline glucose-on-glucagon and GIP-on-insulin-secretion effects. -
WT(kg). Scales the Watson 2010 body-weight-normalized liraglutide PK (CL/F = 0.013 L/h/kg; V/F = 0.16 L/kg). Only used when liraglutide is co-dosed; endogenous-only simulations can pass any positive value.
Source trace
Every ini() parameter is annotated in
inst/modeldb/specificDrugs/Bosch_2022_liraglutide_qsp.R
with the source Table / equation. The table below is the collected
view.
| Equation / parameter | Value | Source |
|---|---|---|
| Glucose disposition CLglc T2DM = 1.72 L/h, HV = 5.36 L/h | fixed | Bosch 2022 Table 3 (fixed to Silber 2007 / Jauslin 2011) |
| Insulin-dep. glucose clearance CLglci T2DM = 0.0256, HV = 0.072 | fixed | Bosch 2022 Table 3 |
| Glucose Qglc, VCglc, VPglc | 26.5 L/h, 9.33 L, 8.56 L | Bosch 2022 Table 3 (fixed) |
| Glucose absorption KAglc, Keglc, Kelglc | 0.853, 0.281, 1.93 /h | Bosch 2022 Table 3 (estimated) |
| Insulin CLins, VCins | 73.2 L/h, 6.09 L (fixed) | Bosch 2022 Table 3 |
| Insulin effect-comp Ke0ins | 0.85 /h | Bosch 2022 Table 3 |
| GLP-1 VCglp, VMGLP, KMGLP | 16 L, 2893 pmol/L*h, 136 pmol/L | Bosch 2022 Table 3 |
| Glucagon CLglg, VCglg | 453 L/h, 64.6 L | Bosch 2022 Table 3 |
| GIP CLgip, VCgip, Qgip, VPgip | 86.8, 9.21, 49.4, 22.8 (fixed) | Bosch 2022 Table 3 |
| Food effect FDGLP, FDGLP_2, FDGIP, FDGLG | 0.0102, 3.88, 0.0343, 0.00329 | Bosch 2022 Table 4 |
| Glucose stim of insulin GLCINS_S | 2.46 | Bosch 2022 Table 4 |
| Glucose-on-glucagon POW_2H, POW_2L (HV) | 0.925, 0.327; T2DM 0 | Bosch 2022 Table 4 |
| GLP-1 insulin EMAX_1, EC50_1, HILL_1 | 10.7, 26.6 pM, 1.79 | Bosch 2022 Table 4 |
| GLP-1 absorption EMAX_2, EC50_2, HILL_2 | 1 (fix), 144 pM, 1 (fix) | Bosch 2022 Table 4 |
| GLP-1 glucagon EMAX_3, EC50_3, HILL_3 | 1 (fix), 99.5 pM, 1 (fix) | Bosch 2022 Table 4 |
| Glucagon glucose EMAX_4, EC50_4, HILL_4 | 6.73, 98.5 pM (fixed Wendt), 1 (fix) | Bosch 2022 Table 4 |
| GIP effects POW_3, POW_4 | 0.286 (HV), 0.109 | Bosch 2022 Table 4 |
| Liraglutide PK KA, CL/BW, V/BW | 0.154 /h, 0.013 L/h/kg, 0.16 L/kg | Watson 2010 (via Bosch 2022 supplement Appendix S1) |
| Liraglutide fu | 0.005 | Bosch 2022 Table 2 (Flint 2013) / supplement |
| In vitro EC50 endo GLP-1, liraglutide | 1.919 pM, 6 pM | Bosch 2022 Table 2 (in-house) |
| Baselines BSLglc, BSLins, BSLglp, BSLglg, BSLgip | 4.65 mM, 49.1 pM, 4.61 pM, 8.85 pM, 5 pM | Table S1 (HV Jauslin) + physiologic HV GIP |
| Proportional res. err. Cglc, Cins, Cglp, Cglg, Cgip | 0.0211, 0.305, 0.0602, 0.0348, 0.109 | Bosch 2022 Table 3 |
| Eq. 1-2 (KAglc2 = KAglc * (1 - GLPGLU_AI)) | n/a | Bosch 2022 Eqs. 1-2 |
| Eq. 3 (glucose central mass balance) | n/a | Bosch 2022 Eq. 3 |
| Eq. 5-7 (glucagon-on-glucose Hill Emax) | n/a | Bosch 2022 Eqs. 5-7 |
| Eq. 8-12 (insulin production + incretin amplification) | n/a | Bosch 2022 Eqs. 8-12 |
| Eq. 13-16 (GLP-1 disposition + food effect) | n/a | Bosch 2022 Eqs. 13-16 |
| Eq. 17-24 (glucagon disposition + food + GLP-1 + GIP + glcEFFglg) | n/a | Bosch 2022 Eqs. 17-24 |
| Eq. 25-27 (GIP disposition + food effect) | n/a | Bosch 2022 Eqs. 25-27 |
| Eq. 28-30 (drug + endogenous Emax combination + EC50 scaling) | n/a | Bosch 2022 Eqs. 28-30 |
Dimensional analysis
All ODE states carry mass amounts (mmol for glucose, pmol for
hormones and liraglutide), with concentrations recovered algebraically
as amount / volume. Time is in hours throughout. The three drug-effect
Hill terms are dimensionless because Cdrugf and each
ECGLP_lira derive by scaling the endogenous in-vivo EC50
with the ratio of the drug’s in-vitro EC50 to the endogenous in-vitro
EC50 – both in pM – so the drug-vs-endogenous comparison is in matched
pM.
| Term | Units |
|---|---|
glc_central amount |
mmol |
Cglc = glc_central / VCglc |
mmol/L |
kinglc = BSLglc * (CLglc + CLglci * BSLins) |
mmol/L * (L/h) = mmol/h |
(CLglci * ins_effect / VCglc) * glc_central |
((L/h)/pM) * pM / L * mmol = mmol/h |
ins_central amount |
pmol |
Cins = ins_central / VCins |
pmol/L (pM) |
KINins * (1 + STglc * Cglc^GLCINS_S) |
pmol/h * dimensionless = pmol/h |
lira_central amount |
pmol |
Cdrug = lira_central / VCdrug |
pmol/L (pM) |
Cdrugf = fu * Cdrug |
pM (same as EC50s) |
Steady-state check
With no meal or drug and the endogenous initial conditions preset
from the baselines, all five biomarker concentrations should hold at
their baselines. This confirms the derivation of the baseline production
fluxes (KINglc, KINins, KINglp,
KINglg, KINgip) matches the paper’s equations
4, 9, 14, 18, 26.
mod <- readModelDb("Bosch_2022_liraglutide_qsp")

ev_ss <- data.frame(
  id       = 1L,
  time     = seq(0, 48, by = 1),
  evid     = 0L,
  amt      = 0,
  cmt      = "Cglc",
  DIS_DIAB = 0L,
  WT       = 70
)

sim_ss <- rxode2::rxSolve(mod, ev_ss, keep = c("DIS_DIAB", "WT")) |>
  as.data.frame()

ss_tbl <- sim_ss |>
  dplyr::select(time, Cglc, Cins, Cglp, Cglg, Cgip) |>
  dplyr::filter(time %in% c(0, 24, 48)) |>
  dplyr::rename(
    "Time (h)"       = time,
    "Glucose (mM)"   = Cglc,
    "Insulin (pM)"   = Cins,
    "GLP-1 (pM)"     = Cglp,
    "Glucagon (pM)" = Cglg,
    "GIP (pM)"       = Cgip
  )
knitr::kable(ss_tbl, digits = 3,
caption = "Baseline hold in a healthy volunteer with no meal or drug.")| Time (h) | Glucose (mM) | Insulin (pM) | GLP-1 (pM) | Glucagon (pM) | GIP (pM) |
|---|---|---|---|---|---|
| 0 | 4.65 | 49.1 | 4.61 | 8.85 | 5 |
| 24 | 4.65 | 49.1 | 4.61 | 8.85 | 5 |
| 48 | 4.65 | 49.1 | 4.61 | 8.85 | 5 |
stopifnot(
  abs(range(sim_ss$Cglc)[2] - range(sim_ss$Cglc)[1]) < 1e-4,
  abs(range(sim_ss$Cins)[2] - range(sim_ss$Cins)[1]) < 1e-2,
  abs(range(sim_ss$Cglp)[2] - range(sim_ss$Cglp)[1]) < 1e-3,
  abs(range(sim_ss$Cglg)[2] - range(sim_ss$Cglg)[1]) < 1e-2,
  abs(range(sim_ss$Cgip)[2] - range(sim_ss$Cgip)[1]) < 1e-2
)
Meal challenge: HV vs T2DM
The paper’s central use case is predicting biomarker time-courses
after a mixed meal. Simulate a single 75 g oral glucose challenge (75 g
glucose / 180.16 g/mol = 416 mmol; times the per-meal Fb
bioavailability factor Fb_Jauslin = 0.446 gives 186 mmol
effective dose) at time 0 in one healthy volunteer and one T2DM
subject.
mmol_glucose <- 75 / 180.16 * 1000  # 75 g / MW * 1000 = mmol
Fb           <- 0.446                # NONMEM $THETA(89) = 0.446 (Fb_Jauslin)
dose_mmol    <- mmol_glucose * Fb    # effective dose entering the dose compartment

ev_meal <- rxode2::et(id = 1:2) |>
  rxode2::et(amt = dose_mmol, cmt = "glc_dose", time = 0) |>
  rxode2::et(seq(0, 5, by = 0.05), cmt = "Cglc") |>
  as.data.frame() |>
  dplyr::mutate(
    DIS_DIAB = ifelse(id == 1, 0L, 1L),
    WT       = 70,
    cohort   = ifelse(id == 1, "Healthy volunteer", "T2DM")
  )

# BSLglc override for the T2DM arm: use the Landersdorfer study T2DM
# baseline 10.8 mM (Table 3 supplement) instead of the packaged HV
# default 4.65 mM. rxode2 accepts baseline overrides via inits =.
sim_meal_hv <- rxode2::rxSolve(
  mod,
  events = ev_meal |> dplyr::filter(id == 1),
  keep   = c("DIS_DIAB", "WT", "cohort")
) |> as.data.frame()

# Rebuild the model with T2DM-appropriate baselines for the T2DM arm.
# The cleanest way is to construct a second event table and pass params.
sim_meal_t2dm <- rxode2::rxSolve(
  mod,
  events = ev_meal |> dplyr::filter(id == 2) |>
    dplyr::mutate(id = 1L),
  params = c(lbslglc = log(10.8), lbslins = log(131)),
  keep   = c("DIS_DIAB", "WT", "cohort")
) |> as.data.frame() |>
  dplyr::mutate(id = 2L)

sim_meal <- dplyr::bind_rows(sim_meal_hv, sim_meal_t2dm)

ggplot(sim_meal, aes(time, Cglc, colour = cohort)) +
  geom_line(linewidth = 0.8) +
  labs(x = "Time (h)", y = "Glucose (mmol/L)",
       colour = "Population",
       title  = "Postprandial glucose after 75 g oral glucose",
       caption = "Simulated typical-individual profile per Bosch 2022 4GI model.") +
  theme_bw()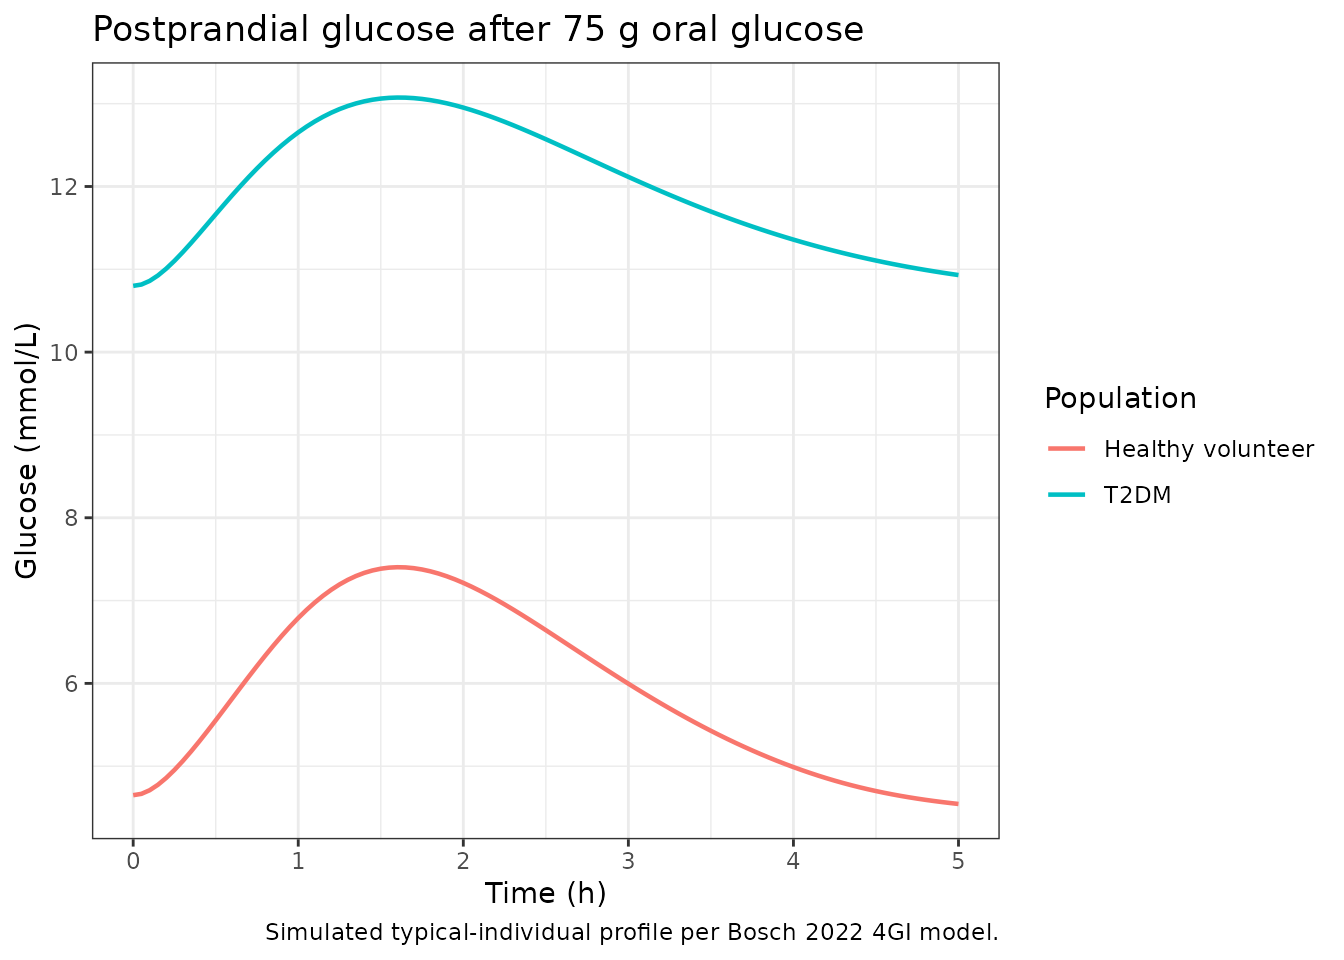
sim_meal |>
  dplyr::select(time, cohort, Cglc, Cins, Cglp, Cglg, Cgip) |>
  tidyr::pivot_longer(-c(time, cohort), names_to = "biomarker",
                      values_to = "concentration") |>
  dplyr::mutate(biomarker = factor(biomarker,
                                   levels = c("Cglc", "Cins", "Cglp",
                                              "Cglg", "Cgip"),
                                   labels = c("Glucose (mM)",
                                              "Insulin (pM)",
                                              "Active GLP-1 (pM)",
                                              "Glucagon (pM)",
                                              "GIP (pM)"))) |>
  ggplot(aes(time, concentration, colour = cohort)) +
  geom_line(linewidth = 0.7) +
  facet_wrap(~biomarker, scales = "free_y", ncol = 2) +
  labs(x = "Time (h)", y = NULL, colour = "Population",
       title  = "4GI biomarkers after a 75 g oral glucose meal") +
  theme_bw()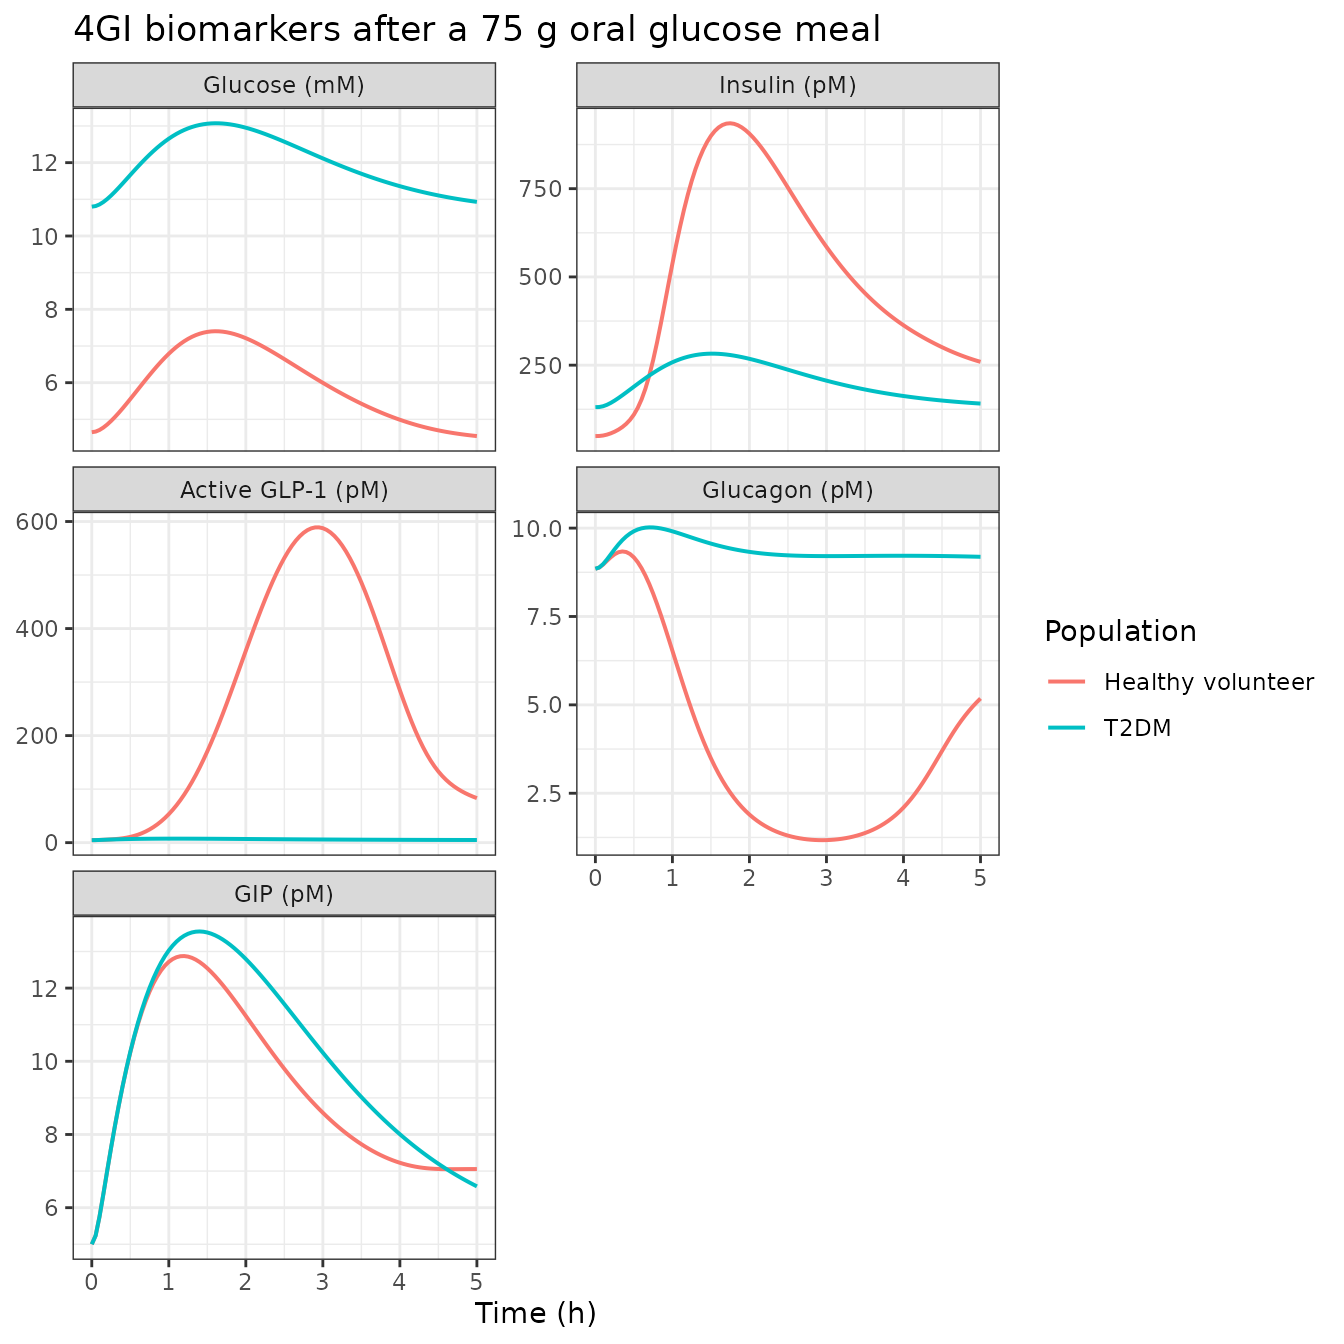
The HV time-course shows the expected postprandial pattern: a glucose peak around 30-60 min followed by a return toward the 4.65 mmol/L baseline; an amplified insulin secretion driven by the glucose surge and the incretin (GLP-1 + GIP) rise; and a suppressed glucagon during the postprandial window. The T2DM arm shows a higher and slower glucose peak (reflecting the fixed lower CLglc and CLglci per Silber 2007 / Jauslin 2011), a smaller GIP contribution to insulin (POW_3 = 0 in T2DM), and no below-baseline glucagon stimulation (POW_2L = 0 in T2DM).
Liraglutide effect on postprandial glucose
Reproduce the paper’s overall claim that once-daily liraglutide reduces postprandial glucose excursion via three GLP-1 pathways (insulin stimulation, glucagon inhibition, gastric-emptying inhibition). Simulate a T2DM subject at steady-state liraglutide (approximating LEAD-3 chronic dosing after several weeks) by loading the depot with 1.8 mg SC once daily.
lira_mg_dose <- 1.8
lira_pmol    <- lira_mg_dose / 3.7512 * 1e9  # mg -> nmol -> pmol via MW 3751.2

ev_lira <- rxode2::et(id = 1) |>
  rxode2::et(amt = lira_pmol, cmt = "lira_depot", time = 0) |>
  rxode2::et(amt = lira_pmol, cmt = "lira_depot", time = 24) |>
  rxode2::et(amt = lira_pmol, cmt = "lira_depot", time = 48) |>
  rxode2::et(amt = lira_pmol, cmt = "lira_depot", time = 72) |>
  rxode2::et(amt = lira_pmol, cmt = "lira_depot", time = 96) |>
  rxode2::et(amt = lira_pmol, cmt = "lira_depot", time = 120) |>
  rxode2::et(amt = lira_pmol, cmt = "lira_depot", time = 144) |>
  # Test meal on day 8 (after ~ steady-state)
  rxode2::et(amt = dose_mmol, cmt = "glc_dose", time = 168) |>
  rxode2::et(seq(168, 173, by = 0.05), cmt = "Cglc") |>
  as.data.frame() |>
  dplyr::mutate(DIS_DIAB = 1L, WT = 70)

sim_lira <- rxode2::rxSolve(
  mod,
  events = ev_lira,
  params = c(lbslglc = log(10.8), lbslins = log(131)),
  keep   = c("DIS_DIAB", "WT")
) |>
  as.data.frame() |>
  dplyr::filter(time >= 168) |>
  dplyr::mutate(time_since_meal = time - 168, arm = "T2DM + liraglutide 1.8 mg QD")

# Rebuild the no-drug T2DM comparator so the meal happens at the same
# 168-h nominal time (allow the endogenous system to hold at steady state
# with no drug prior to the meal).
ev_nodrug <- rxode2::et(id = 1) |>
  rxode2::et(amt = dose_mmol, cmt = "glc_dose", time = 168) |>
  rxode2::et(seq(168, 173, by = 0.05), cmt = "Cglc") |>
  as.data.frame() |>
  dplyr::mutate(DIS_DIAB = 1L, WT = 70)

sim_nodrug <- rxode2::rxSolve(
  mod,
  events = ev_nodrug,
  params = c(lbslglc = log(10.8), lbslins = log(131)),
  keep   = c("DIS_DIAB", "WT")
) |>
  as.data.frame() |>
  dplyr::filter(time >= 168) |>
  dplyr::mutate(time_since_meal = time - 168, arm = "T2DM (no drug)")

sim_cmp <- dplyr::bind_rows(sim_lira, sim_nodrug)

ggplot(sim_cmp, aes(time_since_meal, Cglc, colour = arm)) +
  geom_line(linewidth = 0.8) +
  labs(x = "Time since meal (h)", y = "Glucose (mmol/L)",
       colour = "Arm",
       title  = "Postprandial glucose in T2DM with or without liraglutide",
       caption = "Simulated typical-individual profile per Bosch 2022 4GI model.") +
  theme_bw()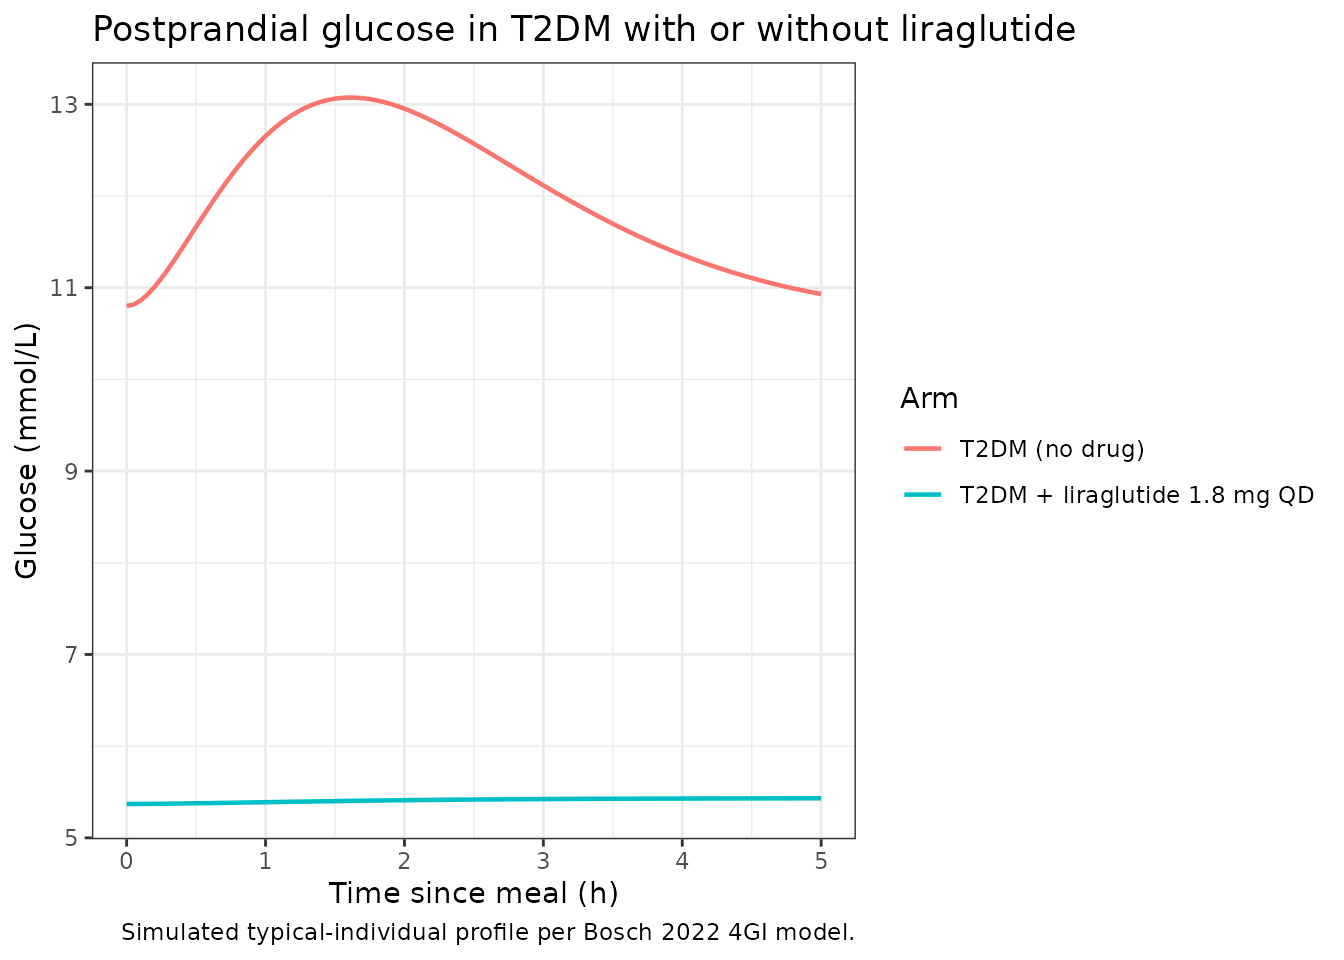
peaks <- sim_cmp |>
  dplyr::group_by(arm) |>
  dplyr::summarise(
    glucose_peak_mM  = max(Cglc),
    glucose_auc_5h   = sum(diff(time_since_meal) * (head(Cglc, -1) + tail(Cglc, -1)) / 2),
    insulin_peak_pM  = max(Cins),
    glp1_peak_pM     = max(Cglp),
    glucagon_min_pM  = min(Cglg),
    .groups = "drop"
  )

knitr::kable(peaks, digits = 2,
caption = "Peak / AUC summaries for the meal challenge in T2DM.")| arm | glucose_peak_mM | glucose_auc_5h | insulin_peak_pM | glp1_peak_pM | glucagon_min_pM |
|---|---|---|---|---|---|
| T2DM (no drug) | 13.07 | 60.03 | 282.60 | 7.45 | 8.85 |
| T2DM + liraglutide 1.8 mg QD | 5.43 | 27.05 | 195.39 | 4.67 | 0.04 |
Liraglutide reduces the postprandial glucose peak and AUC in T2DM through the three-pathway GLP-1 mechanism the model was designed around. This is consistent with the paper’s Figures S12-S13 (52-week LEAD-3 and 26-week LEAD-6 fasting-plasma-glucose lowering) and Figure S14 (24-h SMBG on the liraglutide arm of AWARD-6).
Assumptions and deviations
-
No inter-individual variability. Bosch 2022 fits
typical-value population means (per-study digitized-figure means), so
the packaged model has no
etarandom effects. All simulations here are typical individuals. Users who need to bracket predictions with parameter uncertainty should draw from the paper’s reported RSEs (Table 3 / 4) rather than from an eta OMEGA (which does not exist). -
Baselines are study-specific. The packaged defaults
are the Jauslin HV cohort ($THETA(52) 4.65 mM etc.); the T2DM arm above
overrides
lbslglcandlbslinsto the Landersdorfer T2DM values (10.8 mM and 131 pM) viarxSolve(params = ...). Bosch 2022 supplementary Table S1 lists per-study baselines; users targeting a specific paper should override accordingly. -
GIP baseline default is a physiologic mid-range
value. Bosch 2022 uses per-study
IBGIP(individual data column) for BSLgip and does not publish a single default. The packaged default of 5 pmol/L is a typical HV fasting GIP from the Vilsboll 2006 data the paper’s GIP disposition parameters were fit to; override per study when relevant. -
Total-to-active GLP-1 factor (
factor total GLP= 3.8). Bosch 2022 Table 3 reports a per-study conversion factor for datasets that measured total GLP-1 rather than active GLP-1. It is not part of the ODE system and is documented as a comment in the model file rather than anini()parameter; users comparing simulation output to a total-GLP-1 assay should multiplyCglpby 3.8. -
FDGLP_2 (delayed gut GLP-1 effect) is HV-only and fixed to
3.88. Table 4 reports 3.88 with an RSE dash (fixed); the
supplementary NONMEM code in Appendix S1 shows
$THETA(23) = (0) FIX = 0, which contradicts the table. Per the standard rule, the paper table takes precedence and 3.88 is encoded here. The effect is additionally gated to DIS_DIAB = 0 to match the NONMEM codeIF (A(15).GT.0.AND.PAT.EQ.1)guard (PAT = 1 = HV in the paper’s convention). -
DIS_DIAB sign convention. The paper’s NONMEM code
uses
PAT = 1for healthy volunteers; the canonicalDIS_DIAB = 1in nlmixr2lib means T2DM. The model file inverts the sign soDIS_DIAB = 0gives the HV parameter set andDIS_DIAB = 1gives the T2DM parameter set, which is the pattern every other T2DM covariate follows in the library (seeinst/references/covariate-columns.md). -
No PKNCA validation. This is an
endogenous/mechanistic model without a monotonic drug PK profile as its
primary readout. PKNCA is not applicable to a glucose-clamp postprandial
curve; the appropriate validation is a steady-state hold and a
meal-challenge reproduction (this vignette). The Watson 2010 liraglutide
popPK arm has its own PKNCA validation via
Watson_2010_liraglutide.Rin the library. - External validation vs internal fit. Bosch 2022 externally validates against dulaglutide (AWARD-6, SUSTAIN-7) and semaglutide (SUSTAIN-7). The packaged model bakes in the liraglutide EC50 = 6 pM and Watson 2010 PK; dulaglutide (in vitro EC50 = 80 pM per Table 2) and semaglutide (dev-code specific) can be exercised by rescaling the drug potency block via the paper’s Eq. 29 – see the reference for the recommended scaling.