Drug-induced intestinal epithelium toxicity (Gall 2023)
Source:vignettes/articles/Gall_2023_intestinal_epithelium_toxicity.Rmd
Gall_2023_intestinal_epithelium_toxicity.RmdModel and source
Gall 2023 is a quantitative systems toxicology model of the small-intestinal epithelium that integrates cell dynamics, plasma citrulline kinetics, a logistic diarrhea-risk model and p53-pathway gene transcription to predict oncotherapeutic-induced intestinal toxicity. A mouse-specific version was fitted to 5-fluorouracil (5-FU) and doxorubicin data; a human-specific version was then used to translate the mouse-quantified cytotoxic activity into clinical diarrhea incidence.
The paper contributes four model files to nlmixr2lib,
mirroring the authors’ species-by-drug structure:
Gall_2023_fluorouracil_mouse— mouse 5-FU (PK + metabolism + epithelium + citrulline + diarrhea + genes).Gall_2023_doxorubicin_mouse— mouse doxorubicin (PK + epithelium + citrulline + diarrhea).Gall_2023_fluorouracil_human— human 5-FU (metabolism driven by an external plasma-5-FU covariate).Gall_2023_doxorubicin_human— human doxorubicin (driven by an external plasma-doxorubicin covariate).Citation: Gall L, Jardi F, Lammens L, Pinero J, Souza TM, Rodrigues D, Jennen DGJ, de Kok TM, Coyle L, Chung SW, Ferreira S, Jo H, Beattie KA, Kelly C, Duckworth CA, Pritchard DM, Pin C. (2023). A dynamic model of the intestinal epithelium integrates multiple sources of preclinical data and enables clinical translation of drug-induced toxicity. CPT Pharmacometrics Syst Pharmacol 12(10):1511-1528. doi:10.1002/psp4.13029. Numeric values are from the authors’ MATLAB code deposited at BioModels (MODEL2212120003), which generated the published figures and agrees with Gall 2023 Tables 1 and 2 to the precision printed there.
Article: CPT Pharmacometrics Syst Pharmacol 12(10):1511-1528
Model code and figures deposited at BioModels (MODEL2212120003).
The epithelium is modelled as a two-dimensional crypt-villus cell
strip with four physical compartments — stem cells (S), proliferative
crypt progenitors (P), non-proliferative/differentiated crypt cells (D)
and villus cells (V) — plus arrested and apoptotic crypt
(carr, capo) and villus (varr,
vapo) compartments that appear under drug challenge. A
villus-to-crypt feedback drives compensatory crypt proliferation after
damage. FUTP (for 5-FU) or unbound doxorubicin drives cell-cycle arrest
and apoptosis of proliferative cells, which in turn reduces villus
integrity, lowers plasma citrulline and raises the probability of
diarrhea.
Population
The mouse models were fitted to C57BL/6J mouse small-intestinal data (Gall 2023, Table 1). The 5-FU epithelial, citrulline, diarrhea and gene-transcription parameters come from Jardi et al. (2022), in which mice received 20 or 50 mg/kg 5-FU twice daily for 4 days followed by a 2-day recovery; the doxorubicin epithelial and citrulline data (5 or 10 mg/kg daily for 2 days) were newly generated in Gall 2023. 5-FU and doxorubicin plasma PK and the 5-FU metabolite rate constants were fitted to Simcyp mouse predictions and measured mouse metabolite concentrations.
The human model keeps the mouse structure but is parametrised for the human ileum (cell composition and proliferation rates from published human data, Gall 2023 Table 1), with the feedback strength, migration shape coefficient, drug-effect parameters and metabolite rate constants assumed from the mouse fit. Human plasma drug exposures were simulated with Simcyp for clinical regimens.
readModelDb("Gall_2023_fluorouracil_mouse")()$population$dose_range
#> [1] "20 or 50 mg/kg intravenously every 12 h for 4 days, then a 2-day recovery period (Jardi et al. 2022, the source of the mouse cell-count, citrulline, diarrhea and transcriptomic data)"
readModelDb("Gall_2023_fluorouracil_human")()$population$dose_range
#> [1] "Simulated clinical regimens: 46-hour intravenous 5-FU infusion every 2 weeks (AUC 18 or 28 mg.h/L); 450 mg intravenous bolus daily for 5 days every 28 days"
Source trace
The per-parameter origin is recorded as an in-file comment next to
each ini() entry in each model file under
inst/modeldb/specificDrugs/. The equations are S1-S24 of
the Gall 2023 Supplementary Material; the table below collects the key
structural choices.
| Equation / parameter | Value | Source location |
|---|---|---|
5-FU plasma PK (central, peripheral1) |
2-cmt, concentration-based | Table 2 (5-FU PK model), Eqs S1-S2 |
5-FU metabolism fump -> fudp -> futp
|
KFUMP..KeFUTP |
Table 2, Eqs S3-S5 |
| Epithelial cell dynamics | S, P, D, V + arrest/apoptosis | Table 1, Eqs S10-S18 |
| Villus-to-crypt feedback | gamma = 3.41 |
Table 1, Eq S14 |
| FUTP drug effect (Hill) |
C50 = 1318, hill = 5
|
Table 1, Eqs S19-S20 |
| Doxorubicin drug effect (linear) |
k_inhib, k_kill x unbound conc |
Table 1, Eqs S19-S20 (doxo branch) |
| Plasma citrulline | kCitru * V^2 - ClCitru * Citru |
Table 1, Eq S21 |
| Probability of diarrhea | logistic in villus-cell loss | Table 1, Eqs S22-S23 |
| p53-pathway gene z-scores | linear in apoptotic/arrested fraction | Table 1, Eq S24 |
All numeric values are taken from the authors’ deposited MATLAB code (BioModels MODEL2212120003), which generated the published figures and agrees with Table 1 / Table 2 to the precision printed there (see “Assumptions and deviations” for the two values that differ from the rounded table beyond rounding).
Steady-state check
With no drug, every model must hold its biological baseline
indefinitely: the homeostatic cell numbers and citrulline level are an
asymptotically stable equilibrium (Gall 2023, bifurcation analysis). The
probability of diarrhea at homeostasis is near zero (beta_0
is fixed to achieve this).
hold <- function(model, extra = NULL, tmax = 500) {
  mod <- readModelDb(model)
  ev <- rxode2::et(seq(0, tmax, by = 1))
  if (!is.null(extra)) {
    ev <- as.data.frame(ev)
    ev[[names(extra)]] <- extra[[1]]
  }
  as.data.frame(rxode2::rxSolve(mod, ev, atol = 1e-10, rtol = 1e-8))
}

ss_fu_m <- hold("Gall_2023_fluorouracil_mouse")
ss_dx_m <- hold("Gall_2023_doxorubicin_mouse")
ss_fu_h <- hold("Gall_2023_fluorouracil_human", extra = list(CP_5FU_NGML = 0))
ss_dx_h <- hold("Gall_2023_doxorubicin_human", extra = list(CP_DOXORUBICIN_NGML = 0))

# Villus and citrulline stay pinned at baseline; diarrhea risk stays ~0.
stopifnot(
  diff(range(ss_fu_m$villus)) < 1e-6,
  diff(range(ss_fu_m$citr)) < 1e-4,
  max(ss_fu_m$prob_diarrhea) < 0.03,
  diff(range(ss_dx_m$villus)) < 1e-6,
  diff(range(ss_fu_h$villus)) < 1e-6,
  diff(range(ss_dx_h$villus)) < 1e-6,
  max(ss_fu_h$prob_diarrhea) < 0.03
)
cat("All four models hold baseline with no drug.\n")
#> All four models hold baseline with no drug.
Mouse 5-FU: injury and recovery
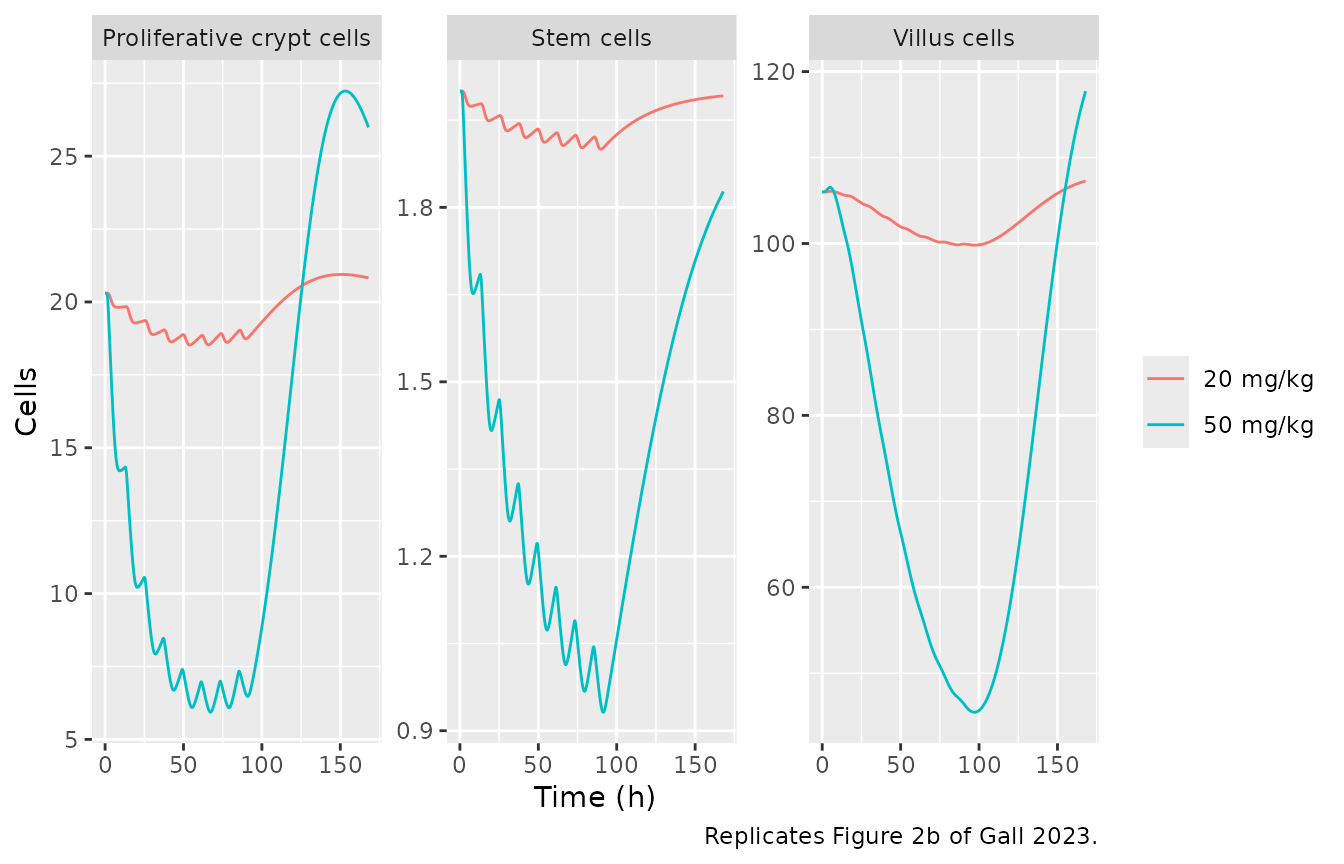
Mice received 5-FU 20 or 50 mg/kg intravenously every 12 h for 4 days
(eight doses) followed by a 2-day recovery. The dose in mg/kg is
converted to its plasma-concentration increment through
f(central).
mod_fu_m <- readModelDb("Gall_2023_fluorouracil_mouse")

sim_fu_m <- lapply(c(20, 50), function(dose) {
  ev <- rxode2::et(amt = dose, time = seq(0, 84, by = 12), cmt = "central") |>
    rxode2::et(seq(0, 168, by = 0.25))
  s <- as.data.frame(rxode2::rxSolve(mod_fu_m, ev, atol = 1e-10, rtol = 1e-8))
  s$dose <- paste0(dose, " mg/kg")
  s
}) |> dplyr::bind_rows()
Replicates Figure 2b of Gall 2023 (stem, proliferative-crypt and villus cell counts): the 50 mg/kg arm drives a deep depletion with delayed stem-cell recovery, while the 20 mg/kg arm is mild.
sim_fu_m |>
  dplyr::mutate(
    `Stem cells` = stem,
    `Proliferative crypt cells` = stem + prolif,
    `Villus cells` = villus + varr + vapo
  ) |>
  dplyr::select(time, dose, `Stem cells`, `Proliferative crypt cells`, `Villus cells`) |>
  tidyr::pivot_longer(-c(time, dose)) |>
  ggplot(aes(time, value, colour = dose)) +
  geom_line() +
  facet_wrap(~name, scales = "free_y") +
  labs(
    x = "Time (h)", y = "Cells", colour = NULL,
    caption = "Replicates Figure 2b of Gall 2023."
  )
Replicates Figure 3b (plasma citrulline and probability of diarrhea):
sim_fu_m |>
  dplyr::select(time, dose, Citrulline = citr, `P(diarrhea)` = prob_diarrhea) |>
  tidyr::pivot_longer(-c(time, dose)) |>
  ggplot(aes(time, value, colour = dose)) +
  geom_line() +
  facet_wrap(~name, scales = "free_y") +
  labs(x = "Time (h)", y = NULL, colour = NULL,
       caption = "Replicates Figure 3b of Gall 2023.")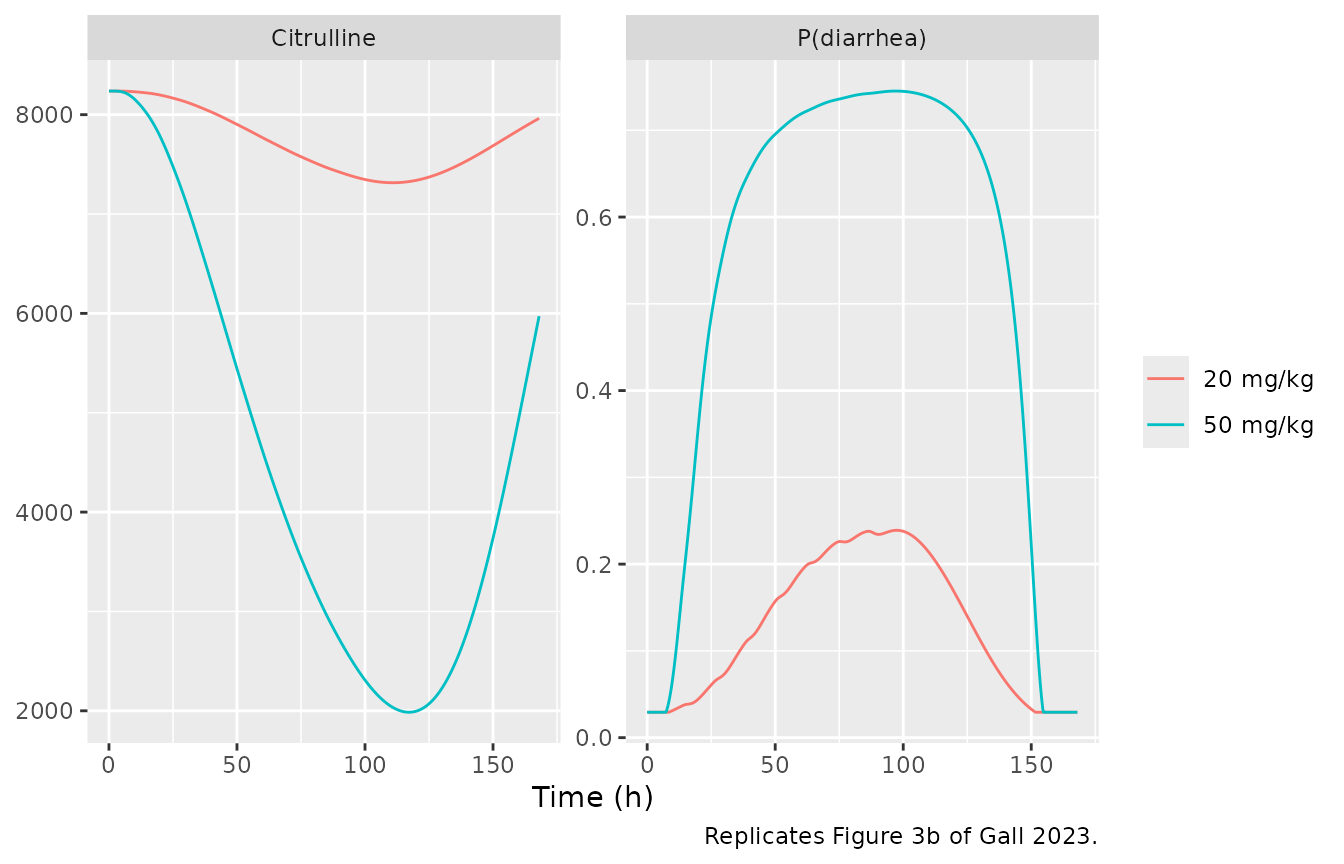
Replicates Figure 3a (p53-pathway gene z-scores at 50 mg/kg):
sim_fu_m |>
  dplyr::filter(dose == "50 mg/kg") |>
  dplyr::select(time, P53 = z_p53, Bax = z_bax, P21 = z_p21,
                MDM2 = z_mdm2, PIDD1 = z_pidd1, SESN2 = z_sesn2) |>
  tidyr::pivot_longer(-time) |>
  ggplot(aes(time, value)) +
  geom_line(colour = "#3b4cc0") +
  facet_wrap(~name, scales = "free_y") +
  labs(x = "Time (h)", y = "z-score",
       caption = "Replicates Figure 3a of Gall 2023 (50 mg/kg).")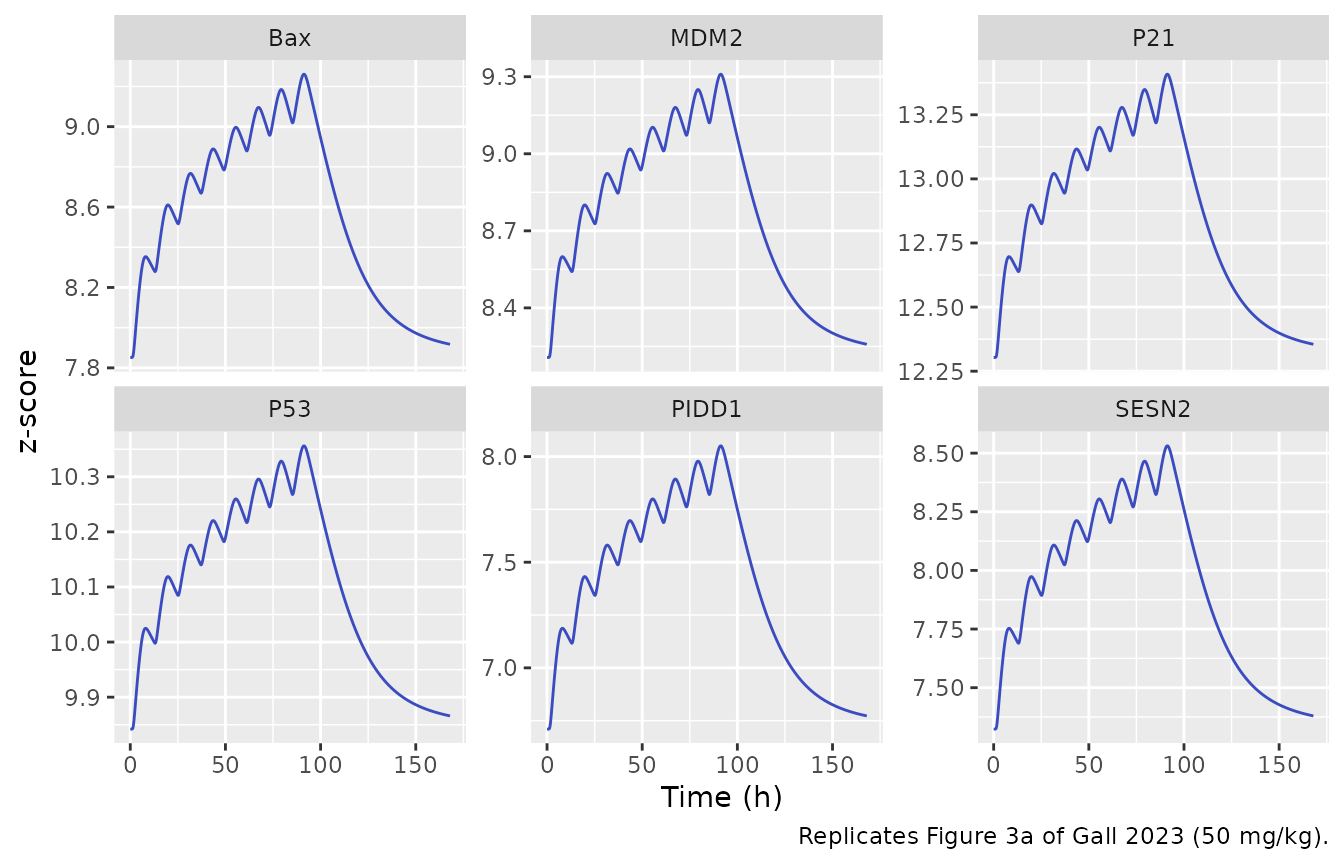
Quantitative gates (deterministic model, so exact nadirs are reproducible). The values below match the authors’ deposited code and the published figures.
gate_fu_m <- sim_fu_m |>
  dplyr::group_by(dose) |>
  dplyr::summarise(
    stem_nadir = min(stem),
    villus_nadir = min(villus + varr + vapo),
    diarrhea_max = max(prob_diarrhea),
    citr_nadir = min(citr),
    .groups = "drop"
  )
gate_fu_m
#> # A tibble: 2 × 5
#>   dose     stem_nadir villus_nadir diarrhea_max citr_nadir
#>   <chr>         <dbl>        <dbl>        <dbl>      <dbl>
#> 1 20 mg/kg      1.90          99.8        0.239      7315.
#> 2 50 mg/kg      0.932         45.5        0.745      1986.

stopifnot(
  # 50 mg/kg: deep villus depletion (~45 cells from 106) and high diarrhea risk
  with(gate_fu_m[gate_fu_m$dose == "50 mg/kg", ],
       villus_nadir > 42 && villus_nadir < 50 &&
       stem_nadir < 1.0 && diarrhea_max > 0.70),
  # 20 mg/kg: mild, villus barely perturbed
  with(gate_fu_m[gate_fu_m$dose == "20 mg/kg", ],
       villus_nadir > 95 && diarrhea_max < 0.35)
)
Mouse doxorubicin: milder injury
Mice received doxorubicin 5 or 10 mg/kg intravenously daily for 2 days followed by recovery.
mod_dx_m <- readModelDb("Gall_2023_doxorubicin_mouse")

sim_dx_m <- lapply(c(5, 10), function(dose) {
  ev <- rxode2::et(amt = dose, time = c(0, 24), cmt = "central") |>
    rxode2::et(seq(0, 168, by = 0.25))
  s <- as.data.frame(rxode2::rxSolve(mod_dx_m, ev, atol = 1e-10, rtol = 1e-8))
  s$dose <- paste0(dose, " mg/kg")
  s
}) |> dplyr::bind_rows()
Replicates Figure 2d (villus cells) and Figure 3c (plasma citrulline):
sim_dx_m |>
  dplyr::select(time, dose, `Villus cells` = villus, Citrulline = citr) |>
  dplyr::mutate(`Villus cells` = sim_dx_m$villus + sim_dx_m$varr + sim_dx_m$vapo) |>
  tidyr::pivot_longer(-c(time, dose)) |>
  ggplot(aes(time, value, colour = dose)) +
  geom_line() +
  facet_wrap(~name, scales = "free_y") +
  labs(x = "Time (h)", y = NULL, colour = NULL,
       caption = "Replicates Figures 2d and 3c of Gall 2023.")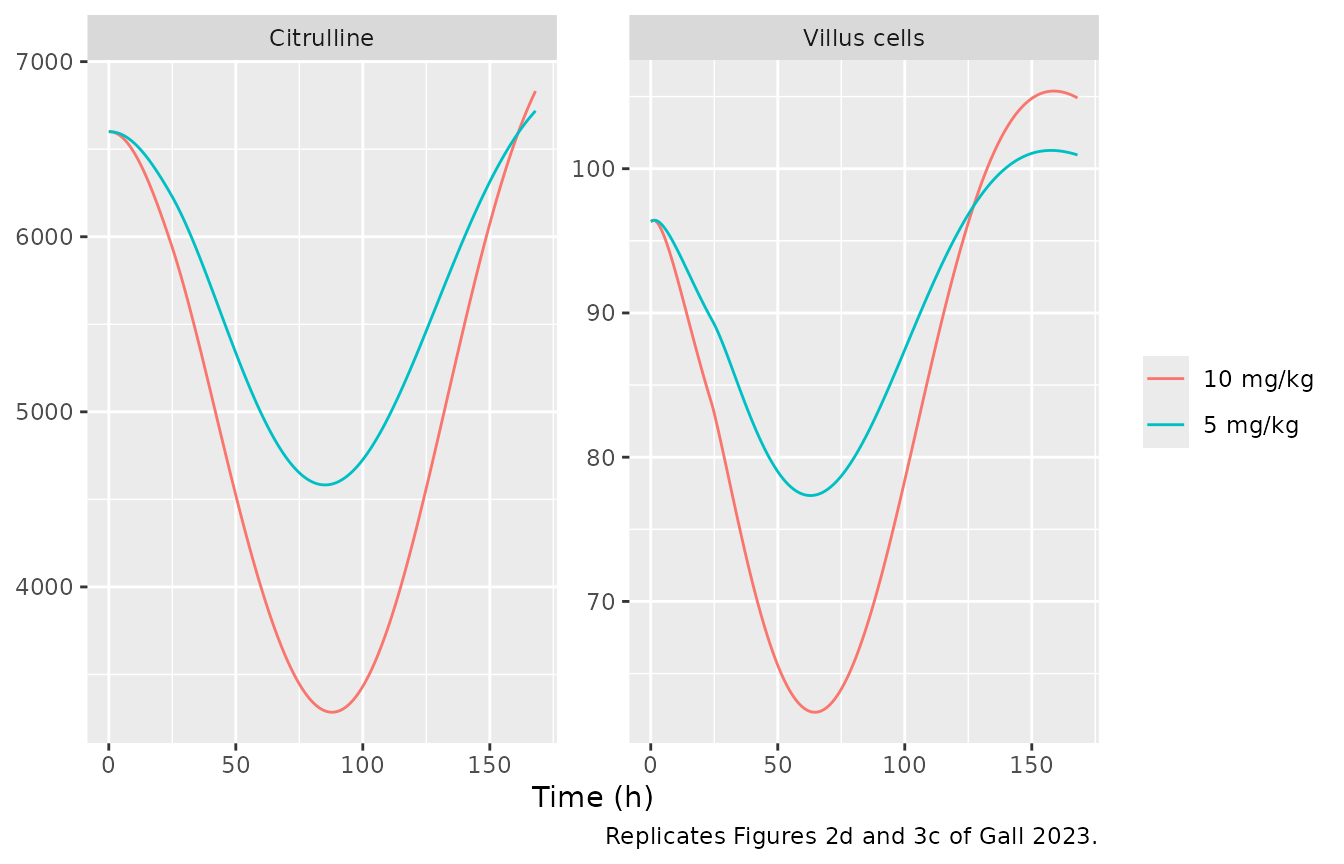
gate_dx_m <- sim_dx_m |>
  dplyr::group_by(dose) |>
  dplyr::summarise(
    villus_nadir = min(villus + varr + vapo),
    citr_nadir = min(citr),
    .groups = "drop"
  )
gate_dx_m
#> # A tibble: 2 × 3
#>   dose     villus_nadir citr_nadir
#>   <chr>           <dbl>      <dbl>
#> 1 10 mg/kg         62.3      3284.
#> 2 5 mg/kg          77.3      4583.

stopifnot(
  # 10 mg/kg villus dips to ~62 (from 96) and citrulline to ~3300 -- the
  # "limited" doxorubicin effect the paper contrasts with 5-FU.
  with(gate_dx_m[gate_dx_m$dose == "10 mg/kg", ],
       villus_nadir > 58 && villus_nadir < 68 && citr_nadir < 3600),
  with(gate_dx_m[gate_dx_m$dose == "5 mg/kg", ],
       villus_nadir > 72 && villus_nadir < 82)
)
Human 5-FU: clinical diarrhea translation
The headline clinical-translation result (Gall 2023, Figure 4a) is
the predicted diarrhea incidence for the fortnightly 46-hour 5-FU
infusion regimens that define plasma AUC exposures of 18 and 28 mg.h/L.
Because 5-FU is delivered as a constant 46-hour infusion, its plasma
concentration is a plateau equal to AUC / 46 h, which drives the
intracellular metabolite cascade supplied through
CP_5FU_NGML.
mod_fu_h <- readModelDb("Gall_2023_fluorouracil_human")

infusion_profile <- function(plateau, n_cycles = 3, period = 336, inf_dur = 46) {
  tt <- sort(unique(c(
    seq(0, period * n_cycles, by = 0.5),
    as.vector(outer(c(0, inf_dur, inf_dur + 0.01), seq_len(n_cycles) * period - period, "+"))
  )))
  data.frame(time = tt, CP_5FU_NGML = ifelse(tt %% period <= inf_dur, plateau, 0))
}

human_5fu <- lapply(c("AUC 18" = 18000, "AUC 28" = 28000), function(auc) {
  df <- infusion_profile(auc / 46)
  s <- as.data.frame(rxode2::rxSolve(mod_fu_h, df, covsInterpolation = "linear",
                                     atol = 1e-9, rtol = 1e-7, maxsteps = 1e6))
  data.frame(
    diarrhea_incidence_pct = round(100 * max(s$prob_diarrhea), 1),
    villus_loss_pct = round(100 * (1 - min(s$villus + s$varr + s$vapo) / (4 * 32.6)), 0),
    citr_nadir = round(min(s$citr))
  )
}) |> dplyr::bind_rows(.id = "regimen")
human_5fu
#>   regimen diarrhea_incidence_pct villus_loss_pct citr_nadir
#> 1  AUC 18                    5.1               1       7033
#> 2  AUC 28                   27.7               7       6135
The predicted incidences (about 5% and 28%) are in good agreement with Gall 2023’s reported 4% and 25% and with the clinical incidence (22% after the first cycle, reduced to ~12% after dose adjustment, in a 155-patient study).
stopifnot(
  # AUC 18: low diarrhea risk, villus barely perturbed
  human_5fu$diarrhea_incidence_pct[human_5fu$regimen == "AUC 18"] < 10,
  # AUC 28: moderate diarrhea risk, matching the paper's 25%
  human_5fu$diarrhea_incidence_pct[human_5fu$regimen == "AUC 28"] > 18 &
    human_5fu$diarrhea_incidence_pct[human_5fu$regimen == "AUC 28"] < 35
)
Human doxorubicin: clinical diarrhea translation
For 75 mg/m2 intravenous doxorubicin every 3 weeks (Gall 2023, Figure
4b), the plasma doxorubicin profile was simulated with Simcyp; the
deposited profile (BioModels Pk_Doxo_Hu.mat, two cycles) is
supplied here through CP_DOXORUBICIN_NGML.
mod_dx_h <- readModelDb("Gall_2023_doxorubicin_human")

doxo_profile <- utils::read.csv(
  file.path("data", "Gall_2023_doxorubicin_human_simcyp.csv")
) |>
  dplyr::rename(time = Hours, CP_DOXORUBICIN_NGML = Doxongml)

sim_dx_h <- as.data.frame(rxode2::rxSolve(
  mod_dx_h, doxo_profile, covsInterpolation = "linear",
  atol = 1e-9, rtol = 1e-7, maxsteps = 1e6
))

doxo_incidence_pct <- round(100 * max(sim_dx_h$prob_diarrhea), 1)
doxo_incidence_pct
#> [1] 12.5

# Gall 2023 Figure 4b predicts 10%-15% doxorubicin diarrhea incidence.
stopifnot(doxo_incidence_pct > 8 & doxo_incidence_pct < 18)
sim_dx_h |>
  dplyr::select(time, `Villus cells` = villus, Citrulline = citr,
                `P(diarrhea)` = prob_diarrhea) |>
  tidyr::pivot_longer(-time) |>
  ggplot(aes(time, value)) +
  geom_line(colour = "#3b4cc0") +
  facet_wrap(~name, scales = "free_y") +
  labs(x = "Time (h)", y = NULL,
       caption = "Replicates Figure 4b of Gall 2023 (75 mg/m2 every 3 weeks).")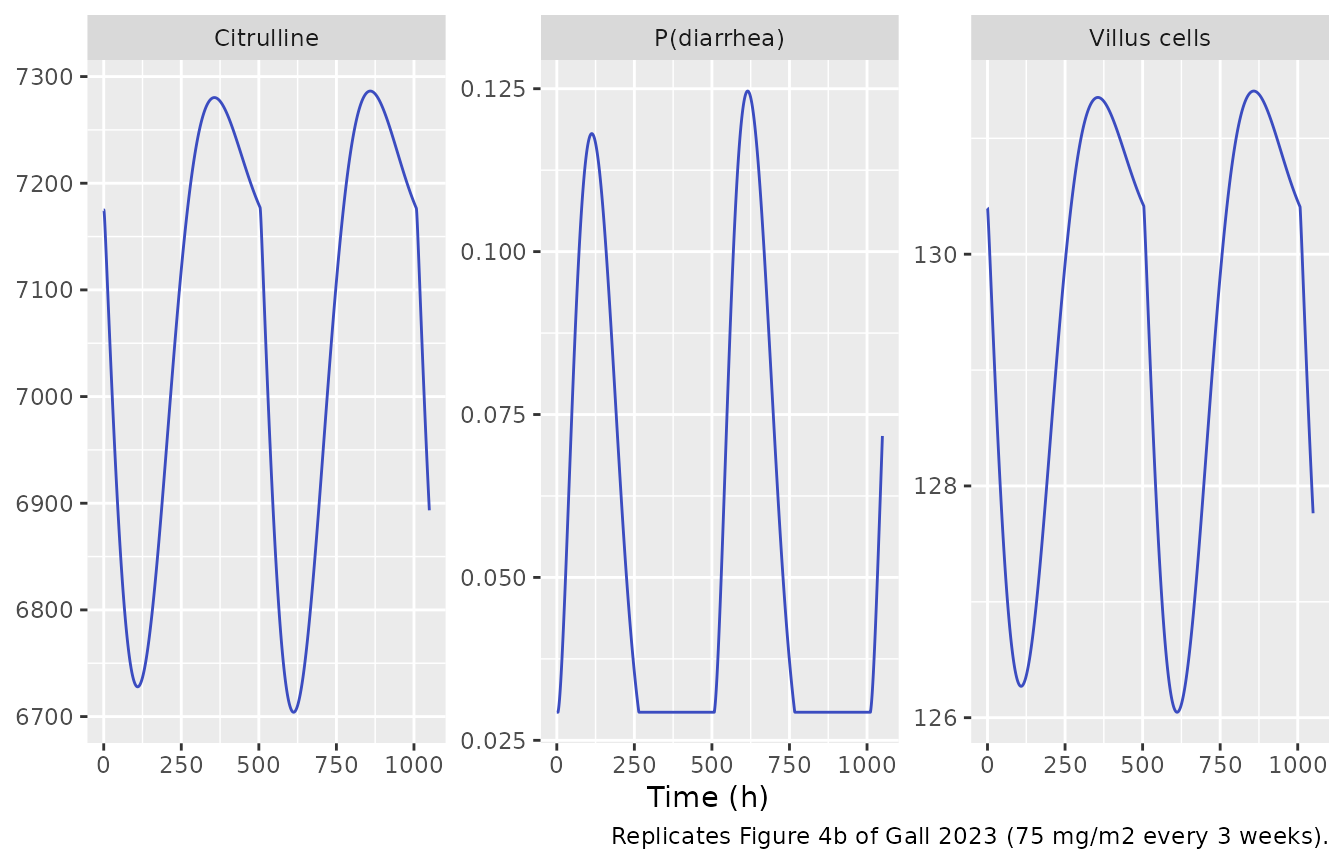
Assumptions and deviations
-
Numeric values come from the authors’ deposited MATLAB
code (BioModels MODEL2212120003), which generated the published
figures. These agree with Gall 2023 Table 1 / Table 2 to the precision
printed there. Two values differ from the rounded table beyond rounding,
and the code value (which reproduces the figures) is used:
-
k_p53 = 4.5405in the mouse 5-FU model (Table 1 prints the p53 z-score slope as 5.540 +/- 1.041). The maintainers used the code value so the p53 panel of Figure 3a is reproduced; the five other gene slopes match the table exactly. -
kcitru = 0.022521in the mouse doxorubicin model (Table 1 prints 0.0232).
-
-
Deterministic typical-value models. Gall 2023
reports standard errors but fits a single typical-value trajectory with
no inter-individual variability and no residual-error model, so the
model files carry no
etaor residual-error parameters. The assertions above are therefore exact rather than distributional. -
Human drug exposures are external covariates. The
human 5-FU and doxorubicin plasma profiles were simulated by the authors
with Simcyp (a whole-body PBPK platform not reproduced in nlmixr2). The
46-hour 5-FU infusion plateau is reconstructed analytically (plasma
concentration = AUC / 46 h, which matches the deposited profile), and
the doxorubicin profile is the deposited Simcyp curve
(
Pk_Doxo_Hu.mat). The 450 mg 5-FU daily-bolus regimen of Figure 4a (predicted ~70% incidence) is not reproduced here because its sharp Simcyp bolus spikes require the full deposited profile; the two infusion regimens are the paper’s primary clinical-translation gate. - Human drug-effect and metabolite parameters are assumed from the mouse fit (Gall 2023, Table 1, “Assumed from mouse”). The human translation keeps the mouse-quantified cytotoxic potency and 5-FU metabolite kinetics, changing only the human-ileum cell composition, proliferation rates and citrulline clearance.
- Doxorubicin effect is linear in the unbound plasma concentration (not a Hill function), because the mild doxorubicin exposures studied did not identify saturation; the model should not be extrapolated to higher doxorubicin doses (Gall 2023, Supplementary Material).
- No correction notice for this article was found as of 2026-10-27.