Kanamycin lung PBPK for tuberculosis (Humphries 2021)
Source:vignettes/articles/Humphries_2021_tb_lung_pbpk.Rmd
Humphries_2021_tb_lung_pbpk.RmdModel and source
Humphries and colleagues (Certara Simcyp and the Critical Path
Institute) built Simcyp V16 physiologically-based pharmacokinetic (PBPK)
models for eleven standard-of-care and newer antituberculosis compounds,
and predicted both plasma and lung concentrations. Every compound was
placed in the multicompartment permeability-limited lung model of Gaohua
et al. 2015 (the paper’s reference 7, packaged here as
Gaohua_2015_lung_pbpk_*). The paper’s own contribution is
the set of compound files (Supplementary Tables S1 and S2) and a virtual
Black South African tuberculosis population.
One of the eleven compounds is packaged: kanamycin, which the paper describes as one of two compounds whose PBPK model is “the first to be published in the literature”.
mod <- readModelDb("Humphries_2021_kanamycin")
ui <- rxode2::rxode(mod)
length(ui$state)
#> [1] 25
ui$state
#>  [1] "depot"         "lung_rt_fluid" "lung_rt_mass"  "lung_rt_blood"
#>  [5] "lung_rm_fluid" "lung_rm_mass"  "lung_rm_blood" "lung_rl_fluid"
#>  [9] "lung_rl_mass"  "lung_rl_blood" "lung_lt_fluid" "lung_lt_mass"
#> [13] "lung_lt_blood" "lung_ll_fluid" "lung_ll_mass"  "lung_ll_blood"
#> [17] "lung_la_fluid" "lung_la_mass"  "lung_la_blood" "lung_ua_fluid"
#> [21] "lung_ua_mass"  "lung_ua_blood" "lung_pbr"      "arterial"
#> [25] "central"- Citation: Humphries H, Almond L, Berg A, Gardner I, Hatley O, Pan X, Small B, Zhang M, Jamei M, Romero K. Development of physiologically-based pharmacokinetic models for standard of care and newer tuberculosis drugs. CPT Pharmacometrics Syst Pharmacol. 2021;10(11):1382-1395. doi:10.1002/psp4.12707. Lung model structure and lung physiology: Gaohua L, Wedagedera J, Small BG, Almond L, Romero K, Hermann D, Hanna D, Jamei M, Gardner I. Development of a Multicompartment Permeability-Limited Lung PBPK Model and Its Application in Predicting Pulmonary Pharmacokinetics of Antituberculosis Drugs. CPT Pharmacometrics Syst Pharmacol. 2015;4(10):605-613. doi:10.1002/psp4.12034 (reference 7 of Humphries 2021), with reference physiology from Jamei M et al. Clin Pharmacokinet. 2014;53:73-87, Electronic Supplementary Material 1.
- Article: https://doi.org/10.1002/psp4.12707
- Supplement (Tables S1-S5, Figures S1-S4, the South African population description): https://doi.org/10.1002/psp4.12707
Why only kanamycin
The lung layer of every compound is fully published (it is the Gaohua
2015 model). The systemic layer is not: the paper embeds the lung in a
Simcyp full PBPK whose tissue:plasma partition coefficients are computed
inside the platform and never printed. Following the treatment of Gaohua
2015, the systemic side is reduced to one well-stirred compartment at
the compound file’s own Vss, absorption and clearance, and
the reduction is tested against the paper’s own predictions before it is
used. That needs three things per compound: an absorption rate and
extent, a clearance in L/h, and a Vss near body water (so
that the plasma profile is close to one-compartmental). Only kanamycin
has all three.
| Compound | Disposition | Reason |
|---|---|---|
| Kanamycin | packaged | IM ka 2 1/h and fa 1 printed (Table S1);
renal clearance 4.74 L/h is the only route (Table S2); Vss
0.236 L/kg |
| Isoniazid | already packaged | Every Table S1/S2 value equals the Gaohua 2015 compound file
(Gaohua_2015_lung_pbpk_isoniazid) |
| Pyrazinamide | already packaged | Every Table S1/S2 value equals the Gaohua 2015 compound file
(Gaohua_2015_lung_pbpk_pyrazinamide) |
| Ethambutol | already packaged, one value differs | Equal to Gaohua_2015_lung_pbpk_ethambutol except lung
fu mass 0.359 (Gaohua 0.451); oral
ka/fa are not reprinted |
| Linezolid | not packaged | Oral ka/fa not printed; the IV arm fails
the one-compartment test (below) |
| Cycloserine, rifampicin | not packaged | “First Order” absorption with no ka or fa
printed; hepatic clearance given only as microsomal CLint
(needs unpublished scaling) |
| Ethionamide, rifapentine | not packaged | ADAM absorption model; FMO3-scaled or per-pmol-CYP2E1
CLint; CYP3A4 induction (rifapentine) |
| Bedaquiline, N-desmethyl bedaquiline, clofazimine | not packaged |
Vss 9.4, 18.0 and 47.8 L/kg (extensively tissue-bound,
so not one-compartmental); oral ka/fa not
printed; an extra adipose-like organ (bedaquiline) |
The three “already packaged” rows are checked below against the
packaged Gaohua 2015 models, using every value Humphries 2021 prints for
them in Tables S1 and S2 (Humphries does not reprint the oral
ka and fa).
humphries <- data.frame(
  drug = rep(c("isoniazid", "ethambutol", "pyrazinamide"), each = 6),
  param = rep(c("bp", "fup", "lvc", "lcl_renal", "peffLung", "fuMass"), 3),
  humphries = c(0.825, 0.95, log(0.50), log(2.76), 0.21e-4, 0.984,
                1.3, 0.75, log(1.23), log(25.55), 0.479e-4, 0.359,
                0.63, 0.9, log(0.46), log(0.11), 0.0138e-4, 0.985)
)
gaohua <- dplyr::bind_rows(lapply(c("isoniazid", "ethambutol", "pyrazinamide"),
  function(d) {
    th <- rxode2::rxode(readModelDb(paste0("Gaohua_2015_lung_pbpk_", d)))$theta
    data.frame(drug = d, param = names(th), gaohua = unname(th))
  }))
identity_tab <- dplyr::left_join(humphries, gaohua, by = c("drug", "param")) |>
  dplyr::mutate(same = abs(humphries - gaohua) <= 1e-9 * pmax(1, abs(gaohua)))
knitr::kable(dplyr::filter(identity_tab, !same), digits = 4,
caption = "The only value that differs from the packaged Gaohua 2015 compound files.")| drug | param | humphries | gaohua | same |
|---|---|---|---|---|
| ethambutol | fuMass | 0.359 | 0.451 | FALSE |
stopifnot(
  sum(!identity_tab$same) == 1L,
  identity_tab$drug[!identity_tab$same] == "ethambutol",
  identity_tab$param[!identity_tab$same] == "fuMass"
)
The ethambutol lung fu mass can be applied to the
packaged model with ini(fuMass = 0.359). Table S2 labels
0.359 as the final value. The Methods, however, say that ethambutol
fu mass was lowered up to 10-fold in a sensitivity analysis
and that “optimal values” were selected, and Figure 2A shows 0.036 and
0.072. The paper does not resolve which value it used for its final
ethambutol lung predictions. The virtual South African tuberculosis
population (supplement) consists of demographic regressions (height on
age, weight on height, body surface area) layered on Simcyp’s default
North European Caucasian physiology; it has no model structure of its
own to package.
The linezolid one-compartment test
Linezolid is the only other compound with an intravenous arm (375 mg
over 30 min, Table S4). Its hepatic clearance is printed only as a
microsomal CLint, but the total clearance can be
back-solved from the paper’s own predicted AUC0-inf (55.3
mg*h/L). A one-compartment body at the printed Vss (0.56
L/kg) then under-predicts the paper’s own end-of-infusion
Cmax (12.94 mg/L) at every plausible body weight: the
platform’s plasma profile is multi-compartmental and the volume that
sets Cmax is not published.
lzd <- data.frame(WT = c(60, 70, 80, 90)) |>
  dplyr::mutate(
    cl = 375 / 55.3,
    v = 0.56 * WT,
    k = cl / v,
    cmax = (375 / 0.5) / cl * (1 - exp(-k * 0.5)),
    ratio_to_table_s4 = cmax / 12.94
  )
knitr::kable(lzd, digits = 3)| WT | cl | v | k | cmax | ratio_to_table_s4 |
|---|---|---|---|---|---|
| 60 | 6.781 | 33.6 | 0.202 | 10.616 | 0.820 |
| 70 | 6.781 | 39.2 | 0.173 | 9.164 | 0.708 |
| 80 | 6.781 | 44.8 | 0.151 | 8.062 | 0.623 |
| 90 | 6.781 | 50.4 | 0.135 | 7.196 | 0.556 |
Population
The paper’s kanamycin simulations used Simcyp library populations matched to two studies (Supplementary Table S3 and the Figure 5 caption):
- Plasma verification: Cabana and Taggart 1973, 24 healthy men aged 21-48 years, 500 mg intramuscular single dose; simulated as 10 trials in the Sim-Healthy Volunteer population.
- Lung: the lesion study of Prideaux et al. 2015 (kanamycin data published by Strydom et al. 2019), 15 tuberculosis patients aged 23-59 years, 33% women, 1000 mg single dose; simulated as 10 trials of 15 Sim-North European Caucasian subjects.
str(mod()$population)
#> List of 9
#>  $ species       : chr "human"
#>  $ n_subjects    : int 390
#>  $ n_studies     : int 2
#>  $ age_range     : chr "21-59 years"
#>  $ sex_female_pct: num 12.8
#>  $ disease_state : chr "virtual healthy adults (Simcyp library populations) matched to healthy-volunteer and tuberculosis-patient studies"
#>  $ dose_range    : chr "500 mg single intramuscular dose (plasma verification); 1000 mg single dose (lung)"
#>  $ regions       : chr "Simcyp Sim-Healthy Volunteer and Sim-North European Caucasian virtual populations"
#>  $ notes         : chr "Supplementary Table S3: the plasma verification simulation matched Cabana and Taggart 1973 (24 healthy men, 21-"| __truncated__
The paper publishes no between-subject variability for its compound files (the variability lives inside the platform’s population generator), so the packaged model is deterministic and the simulations below use one typical 70 kg adult per arm.
Source trace
| Quantity | Value | Source |
|---|---|---|
| Lung model structure (25 ODEs) | – | Gaohua 2015 Appendix S1 (Humphries 2021 ref 7, Figure S1) |
| Lung physiology (volumes, flows, ventilation, surface areas, pH) | see model file | Gaohua 2015 Methods; Jamei 2014 ESM1 |
bp |
0.644 | Table S1 “BP” |
fup |
0.99 | Table S1 “f u,p” |
pka1 |
9.5 (monoprotic base) | Table S1 “pKa”, “Compound Type” |
lka, lfdepot
|
log(2), log(1) | Table S1 “Absorption Model”: im (venous blood, fa 1, ka 2 h) |
lvc |
log(0.236) L/kg | Table S2 “V SS” (optimized against clinical data) |
lcl_renal |
log(4.74) L/h | Table S2 “CL R”; “Elimination” 0 |
peffLung |
0.00617e-4 cm/s | Table S2 “Lung effective permeability” |
fuMass |
0.999 | Table S2 “fu mass” |
henry |
2.95e-33 Pa*m^3/mol | Table S2 “Henry’s Constant” |
kaf |
henry / (8.314 * tempK) |
Gaohua 2015 Appendix S1 eq 1 |
tempK |
310.15 K | not printed; 37 degC assumed |
fuFluid |
1 | not printed; Gaohua 2015 Table S2 value |
ratioPdBasal |
1 | not printed; basal = apical permeability, as for Gaohua 2015 |
addSd |
0 | no residual error reported |
Plasma: the systemic reduction against Table S4
Supplementary Table S4 reports, for the 500 mg intramuscular dose,
the paper’s predicted and the observed Cmax,
tmax and AUC0-12.
WT_REF <- 70

solve_arm <- function(dose, times, wt = WT_REF) {
  ev <- rxode2::et(amt = dose, cmt = "depot") |>
    rxode2::et(times) |>
    as.data.frame()
  ev$WT <- wt
  as.data.frame(rxode2::rxSolve(mod, ev, returnType = "data.frame"))
}

plasma <- solve_arm(500, sort(unique(c(0, seq(0, 2, by = 0.02),
                                        seq(2, 48, by = 0.25)))))
sim_conc <- data.frame(id = 1L, treatment = "500 mg IM",
                       time = plasma$time, Cc = plasma$Cc)
ggplot(sim_conc, aes(time, Cc)) +
  geom_line(linewidth = 0.8) +
  annotate("point", x = 1.0, y = 20.6, shape = 21, size = 3) +
  labs(x = "Time (h)", y = "Plasma kanamycin (mg/L)") +
  coord_cartesian(xlim = c(0, 12)) +
  theme_bw()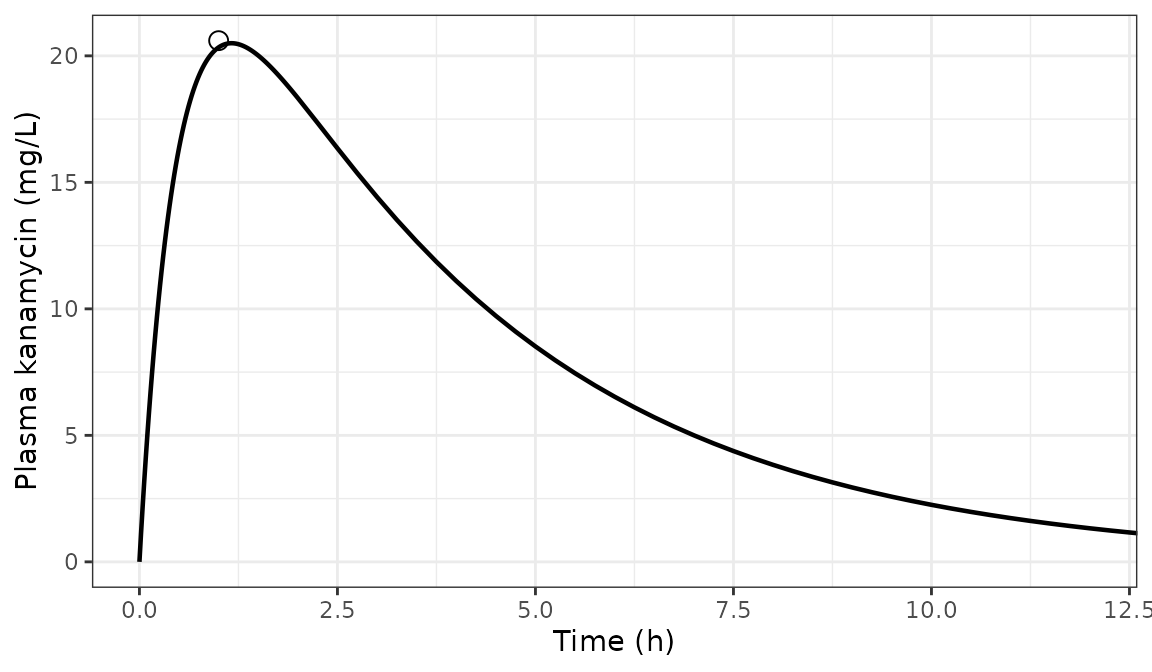
Typical-value plasma kanamycin after 500 mg IM (70 kg). The point is the Table S4 observed Cmax at its tmax.
dose_df <- data.frame(id = 1L, treatment = "500 mg IM", time = 0, amt = 500)
conc_obj <- PKNCA::PKNCAconc(sim_conc, Cc ~ time | treatment + id,
                             concu = "mg/L", timeu = "h")
dose_obj <- PKNCA::PKNCAdose(dose_df, amt ~ time | treatment + id,
                             doseu = "mg")
intervals <- data.frame(start = 0, end = 12,
                        cmax = TRUE, tmax = TRUE, auclast = TRUE)
nca <- PKNCA::pk.nca(PKNCA::PKNCAdata(conc_obj, dose_obj,
                                      intervals = intervals))
sim_nca <- as.data.frame(nca) |>
  dplyr::select(PPTESTCD, PPORRES)

# The same simulated values compared with both Table S4 columns.
simulated <- dplyr::bind_rows(
  dplyr::mutate(sim_nca, comparator = "Table S4 predicted (Simcyp)"),
  dplyr::mutate(sim_nca, comparator = "Table S4 observed")
)
reference <- data.frame(
  comparator = c("Table S4 predicted (Simcyp)", "Table S4 observed"),
  cmax = c(19.4, 20.6),
  tmax = c(0.94, 1.0),
  auclast = c(95.39, 90)
)
cmp <- nlmixr2lib::ncaComparisonTable(
  simulated, reference, by = "comparator",
  units = c(cmax = "mg/L", tmax = "h", auclast = "mg*h/L"),
  tolerance_pct = 20
)
knitr::kable(cmp, caption = "Simulated NCA (0-12 h) vs Supplementary Table S4, kanamycin 500 mg single IM dose.")| NCA parameter | comparator | Reference | Simulated | % diff |
|---|---|---|---|---|
| Cmax (mg/L) | Table S4 predicted (Simcyp) | 19.4 | 20.5 | +5.7% |
| Cmax (mg/L) | Table S4 observed | 20.6 | 20.5 | -0.5% |
| Tmax (h) | Table S4 predicted (Simcyp) | 0.94 | 1.16 | +23.4%* |
| Tmax (h) | Table S4 observed | 1 | 1.16 | +16.0% |
| AUClast (mg*h/L) | Table S4 predicted (Simcyp) | 95.4 | 100 | +4.8% |
| AUClast (mg*h/L) | Table S4 observed | 90 | 100 | +11.1% |
Against the paper’s own predictions the reduction reproduces
Cmax and AUC0-12 to about 5%.
tmax is about 0.2 h later than the platform’s. A
distribution phase is the usual cause: in the full PBPK some drug leaves
plasma for the tissues early, so the peak comes earlier and is slightly
lower. The effect is small because kanamycin’s Vss (0.236
L/kg) is close to extracellular water. Against the observed study mean,
Cmax agrees to 1% and AUC0-12 is about 11%
high, close to the platform’s own 6% over-prediction.
pct <- function(sim, ref) 100 * (sim - ref) / ref
s <- setNames(sim_nca$PPORRES, sim_nca$PPTESTCD)
stopifnot(
  abs(pct(s[["cmax"]], 19.4)) < 10,
  abs(pct(s[["auclast"]], 95.39)) < 10,
  pct(s[["tmax"]], 0.94) > 0,
  pct(s[["tmax"]], 0.94) < 35
)
The Sim-Healthy Volunteer body weight is not reported, so the
sensitivity to the assumed 70 kg is shown here. Only Cmax
and tmax move appreciably; AUC0-inf is fixed
by the weight-independent renal clearance.
sweep <- dplyr::bind_rows(lapply(c(60, 70, 80, 90), function(w) {
  p <- solve_arm(500, seq(0, 12, by = 0.02), wt = w)
  data.frame(WT = w, cmax = max(p$Cc), tmax = p$time[which.max(p$Cc)])
}))
knitr::kable(sweep, digits = 2)| WT | cmax | tmax |
|---|---|---|
| 60 | 22.92 | 1.10 |
| 70 | 20.50 | 1.16 |
| 80 | 18.56 | 1.22 |
| 90 | 16.96 | 1.26 |
Lung: Figure 5
Figure 5 compares the predicted kanamycin concentration in the right lower lobe tissue mass after a 1000 mg single dose with the lesion data of Prideaux et al. 2015. The mean simulated line (thick black) was digitised by the maintainers. The Figure 5 caption does not state the route; the compound file’s only absorption model is intramuscular, so the dose is given IM here.
fig5 <- data.frame(
  time = c(0.5, 1, 1.5, 2, 2.5, 6.5, 7, 7.5, 14, 15, 16, 17, 18, 19, 20,
           21, 24.5),
  fig5_mean = c(1.7, 4.1, 6.6, 8.6, 10.2, 16.5, 17.0, 17.1, 16.3, 15.8,
                15.8, 15.0, 14.6, 14.5, 13.9, 13.9, 12.3)
)
lung <- solve_arm(1000, sort(unique(c(seq(0, 25, by = 0.1), fig5$time))))
lung_long <- dplyr::bind_rows(
  data.frame(time = lung$time, conc = lung$Cc, output = "Plasma"),
  data.frame(time = lung$time, conc = lung$Cmass_rl,
             output = "Lung tissue mass (right lower lobe)"),
  data.frame(time = lung$time, conc = lung$Celf_rl,
             output = "ELF (right lower lobe)")
)
ggplot(dplyr::filter(lung_long, time > 0), aes(time, conc, colour = output)) +
  geom_line(linewidth = 0.8) +
  geom_point(data = fig5, aes(time, fig5_mean), inherit.aes = FALSE,
             shape = 21, size = 2) +
  scale_y_log10() +
  labs(x = "Time (h)", y = "Kanamycin (mg/L)", colour = NULL) +
  theme_bw() +
  theme(legend.position = "bottom")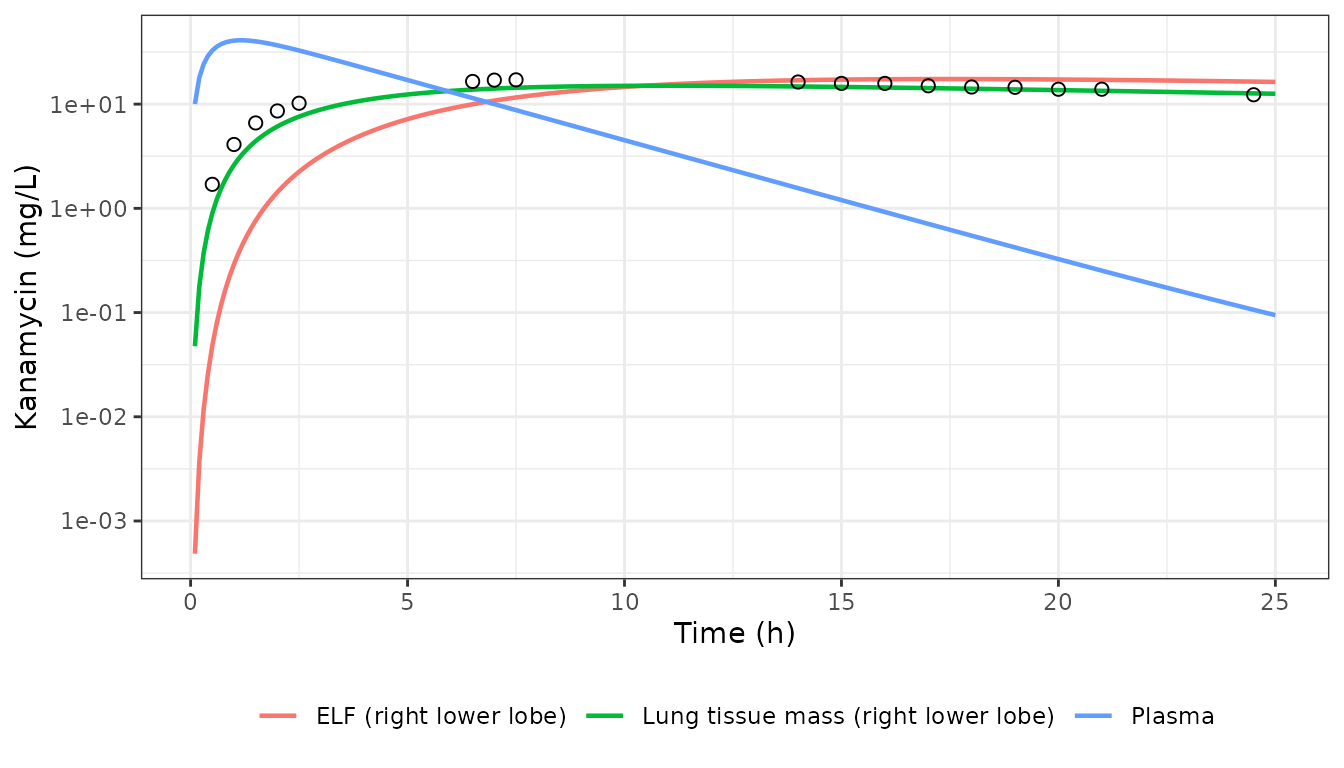
Replicates the kanamycin panel of Figure 5 of Humphries 2021: 1000 mg single dose. Points are the digitised mean simulated line of the paper.
lung_cmp <- fig5 |>
  dplyr::left_join(
    data.frame(time = lung$time, simulated = lung$Cmass_rl),
    by = "time"
  ) |>
  dplyr::mutate(ratio = simulated / fig5_mean)
knitr::kable(lung_cmp, digits = 2)| time | fig5_mean | simulated | ratio |
|---|---|---|---|
| 0.5 | 1.7 | 0.90 | 0.53 |
| 1.0 | 4.1 | 2.61 | 0.64 |
| 1.5 | 6.6 | 4.42 | 0.67 |
| 2.0 | 8.6 | 6.10 | 0.71 |
| 2.5 | 10.2 | 7.59 | 0.74 |
| 6.5 | 16.5 | 13.79 | 0.84 |
| 7.0 | 17.0 | 14.10 | 0.83 |
| 7.5 | 17.1 | 14.36 | 0.84 |
| 14.0 | 16.3 | 14.77 | 0.91 |
| 15.0 | 15.8 | 14.61 | 0.92 |
| 16.0 | 15.8 | 14.44 | 0.91 |
| 17.0 | 15.0 | 14.25 | 0.95 |
| 18.0 | 14.6 | 14.05 | 0.96 |
| 19.0 | 14.5 | 13.84 | 0.95 |
| 20.0 | 13.9 | 13.63 | 0.98 |
| 21.0 | 13.9 | 13.42 | 0.97 |
| 24.5 | 12.3 | 12.68 | 1.03 |
late <- lung_cmp$time >= 6
stopifnot(
  # Plateau and slow decline: the permeability-limited retention the paper
  # describes is reproduced.
  all(abs(lung_cmp$ratio[late] - 1) < 0.2),
  # The rise is slower than the paper's (see Assumptions and deviations);
  # gated in both directions so a later change cannot silently move it.
  all(lung_cmp$ratio[!late] > 0.4),
  all(lung_cmp$ratio[!late] < 0.85)
)

# Tissue peak time and the plasma concentration at that time.
lung_peak <- lung$time[which.max(lung$Cmass_rl)]
plasma_at_peak <- lung$Cc[which.max(lung$Cmass_rl)]
c(lung_peak = lung_peak, plasma_at_peak = plasma_at_peak)
#>      lung_peak plasma_at_peak
#>      11.000000       3.457226
stopifnot(lung_peak > 8, lung_peak < 16,
          plasma_at_peak < 0.15 * max(lung$Cc))
From 6.5 h to 24.5 h the packaged model lies within 20% of the paper’s mean line. Kanamycin’s lung permeability is very low (0.00617e-4 cm/s), so drug enters the lung tissue slowly and stays there long after plasma has cleared. That is why the tissue concentration peaks only at about 11 h, when plasma has already fallen to under a tenth of its own peak. Over the first 2.5 h the packaged model is 26-47% below the paper’s line.
Assumptions and deviations
-
Systemic reduction. The Simcyp full PBPK
(perfusion-limited tissues with Rodgers-Rowland
Kpscaled by an optimizedKpscalar of 0.2) is replaced by one well-stirred compartment at the optimizedVssof 0.236 L/kg. The per-tissueKpvalues are not published. The reduction reproduces the paper’s own predicted plasmaCmaxandAUC0-12to about 5% (tmax about 0.2 h late). - Early lung rise. The right-lower-lobe tissue concentration rises more slowly than the paper’s mean line over the first 2.5 h (ratio 0.53-0.74). It matches from 6.5 h onward. The paper’s line is a mean over a virtual population whose lung permeability, surface area and volumes vary between individuals (Gaohua 2015 CVs of 10-50%). A typical-value solve does not reproduce that mean on a steep rising limb. The early plasma profile of the full PBPK may also differ from the reduced one.
- Lung physiology is taken from Gaohua 2015. Humphries 2021 states that it reused that lung model (Simcyp V16 rather than V14) and reports no changed physiology.
-
Basal permeability equals the apical permeability
(
ratioPdBasal = 1). Table S2 gives a single lung effective permeability, as for Gaohua 2015. -
ELF binding (
fuFluid = 1) is not printed for kanamycin. The Gaohua 2015 value is used; with a plasma unbound fraction of 0.99 it has little effect. - Henry’s constant is printed; body temperature is not, so 37 degC is used. The resulting air:fluid partition coefficient (about 1e-36) removes the ventilation terms entirely.
-
Figure 5 route. The route of the 1000 mg dose is
not stated; the compound file’s intramuscular absorption
(
ka2 1/h,fa1) is used. - Body weight. Simulations use 70 kg; the Simcyp population weights are not reported. The weight sweep above shows the sensitivity.
-
No variability. The paper’s variability comes from
the Simcyp population generator and is not published as parameters, so
the model is deterministic (
addSdfixed at 0). - The other ten compounds are not packaged, for the reasons tabulated under “Why only kanamycin”.