Furmonertinib (Zou 2022)
Source:vignettes/articles/Zou_2022_furmonertinib.Rmd
Zou_2022_furmonertinib.RmdModel and source
#> ℹ parameter labels from comments will be replaced by 'label()'- Citation: Zou HX, Zhang YF, Zhong DF, Jiang Y, Liu F, Zhao QY, Zuo Z, Zhang YF, Yan XY (2022). Effect of autoinduction and food on the pharmacokinetics of furmonertinib and its active metabolite characterized by a population pharmacokinetic model. Acta Pharmacologica Sinica 43(7):1865-1874. doi:10.1038/s41401-021-00798-y. PMID 34789919.
- Description: Semi-mechanistic joint parent-metabolite population PK model for oral furmonertinib (AST2818, a third-generation irreversible EGFR TKI) and its active metabolite AST5902 (Zou 2022). The parent has two-transit-compartment absorption (rate constant ka shared for depot and both transits) feeding a two-compartment parent disposition (CL/F, Vc/F, Q/F, Vp/F). The parent is eliminated through the central compartment; a fraction Fm of the parent elimination becomes AST5902, which is described by a two-compartment metabolite (Clm/(FFm), Vcm/(FFm), and inter-compartment rate constants k67 and k76). Because no intravenous data were available, the absolute parent bioavailability F and the fraction Fm are non-identifiable and are absorbed into the apparent parameters. Autoinduction of furmonertinib metabolism (mediated by CYP3A4) is modelled as an indirect-response (IDR III) enzyme pool with unity baseline: d(A_ENZ)/dt = kENZ * (1 + S * Cc) - kENZ * A_ENZ, and the apparent parent clearance is CLbase/F * A_ENZ. Covariates: alkaline phosphatase (ALP, U/L) via power effect on CLbase/F and on Clm/(FFm) (median 77.2 U/L); body weight (WT, kg) via power effect on Clm/(FFm) (median 65 kg); and a categorical food-with-a-high-fat-meal effect on parent oral bioavailability (+22.4%) and on the fraction converted to AST5902 (-33.5%).
- Article: https://doi.org/10.1038/s41401-021-00798-y
The packaged model implements the Zou 2022 final semi-mechanistic
parent / metabolite population PK model of furmonertinib (AST2818, also
known as alflutinib) and its active metabolite AST5902. The parent has
two-transit absorption (single rate constant ka shared for
depot and both transits) feeding a two-compartment parent disposition
(apparent CL/F, Vc/F, Q/F,
Vp/F). A fraction Fm of the parent
central-compartment elimination becomes AST5902, whose disposition is a
two-compartment model with apparent CLm/(F*Fm),
Vcm/(F*Fm), and inter-compartment rate constants
k67 (central to peripheral) and k76
(peripheral to central). Because no intravenous data are available, the
parent bioavailability F and the conversion fraction
Fm are non-identifiable and are absorbed into the apparent
parameters. Autoinduction of furmonertinib metabolism (mediated by
CYP3A4) is described by an indirect-response (IDR III) enzyme pool with
unity baseline:
d(A_ENZ)/dt = kENZ * (1 + S * Cc) - kENZ * A_ENZ, and the
apparent parent clearance is CLbase/F * A_ENZ. Covariates
in the final model are ALP (alkaline phosphatase, U/L) on both
CLbase/F and Clm/(F*Fm); body weight on
Clm/(F*Fm); and a categorical food-with-a- high-fat-meal
effect on parent F (+22.4%) and on Fm
(-33.5%).
Population
The pooled analysis dataset (Zou 2022 Table 1) comprises 54 subjects
across three clinical trials in China: 38 non-small-cell lung cancer
(NSCLC) patients with EGFR-sensitising / T790M-resistance mutations
enrolled in Study 001 (dose escalation, NCT02973763, n = 14) and Study
002 (dose expansion, NCT03127449, n = 24), and 16 healthy adult male
volunteers in Study 004 (food-effect crossover, NCT03926182). NSCLC
patients received oral furmonertinib 20, 40, 80, 160, or 240 mg once
daily for 21 days per cycle in the fasted state; healthy volunteers
received a single 80 mg oral dose after an overnight fast and, in a
second period separated by 22 days, immediately after a high-fat,
high-calorie breakfast. Baseline demographics (Zou 2022 Table 1): age
mean 48 years (SD 13.9, range 21-68), body weight mean 66.5 kg (SD 10.4,
range 48-111), body mass index mean 24.0 kg/m^2, height mean 166.1 cm,
sex 23 female (42.6%) / 31 male. Baseline clinical chemistry: alanine
transaminase mean 21.3 U/L (SD 11.4), aspartate aminotransferase 22.0
U/L (SD 9.2), alkaline phosphatase 88.1 U/L (SD 44.3, median 77.2),
total bilirubin 11.9 umol/L (SD 4.6), creatinine clearance 101.7 mL/min
(SD 25.9). Hepatic-function status 48 normal / 6 mild dysfunction. The
Bayesian concentration dataset contains 1,450 furmonertinib and 1,463
AST5902 plasma concentrations quantified by LC-MS/MS (LLOQ 0.20 ng/mL
parent, 0.050 ng/mL metabolite). The same metadata is available
programmatically via
readModelDb("Zou_2022_furmonertinib")$meta$population.
Source trace
The per-parameter origin is recorded as an in-file comment next to
each ini() entry in
inst/modeldb/specificDrugs/Zou_2022_furmonertinib.R. The
table below collects them in one place for review. All final-model
estimates are from Zou 2022 Table 2 “Estimate” column.
| Equation / parameter | Value | Source location |
|---|---|---|
lcl_base (CLbase/F) |
log(70.5) -> 70.5 L/h | Table 2, %RSE 6.41 |
lvc (Vc/F) |
log(2897) -> 2897 L | Table 2, %RSE 6.35 |
lka (ka) |
log(1.34) -> 1.34 1/h | Table 2, %RSE 5.63 |
lq (Q/F) |
log(12.4) -> 12.4 L/h | Table 2, %RSE 34.2 |
lvp (Vp/F) |
log(1470) -> 1470 L | Table 2, %RSE 26.7 |
lkenz (kENZ) |
log(0.00304) -> 0.00304 1/h | Table 2, %RSE 6.56; log(2)/kENZ ~ 228 h CYP3A4 half-life |
ls (S) |
log(0.0111) -> 0.0111 1/(ng/mL) | Table 2, %RSE 18.1 |
lcl_ast5902 (Clm/(F*Fm)) |
log(119) -> 119 L/h | Table 2, %RSE 3.56 |
lvc_ast5902 (Vcm/(F*Fm)) |
log(291) -> 291 L | Table 2, %RSE 9.27 |
lk67 |
log(0.952) -> 0.952 1/h | Table 2, %RSE 17.5 |
lk76 |
log(0.0542) -> 0.0542 1/h | Table 2, %RSE 9.20 |
e_alp_cl_base |
fixed(-0.505) | Table 2 theta_CLbase/F,ALP; equation below Table 2 |
e_alp_cl_ast5902 |
fixed(-0.278) | Table 2 theta_CLm/(F*Fm),ALP; equation below Table 2 |
e_wt_cl_ast5902 |
fixed(0.622) | Table 2 theta_CLm/(F*Fm),body weight; equation below Table 2 |
e_fed_f |
fixed(0.224) | Table 2 theta_F,food; equation below Table 2 |
e_fed_fm |
fixed(-0.335) | Table 2 theta_Fm,food; equation below Table 2 |
etalcl variance |
0.0780 | Table 2 omega^2 CL/F, shrinkage 3.47% |
etalvc variance |
0.144 | Table 2 omega^2 Vc/F, shrinkage 3.39% |
etalka variance |
0.161 | Table 2 omega^2 ka, shrinkage 1.11% |
etalcl_ast5902 variance |
0.0485 | Table 2 omega^2 Clm/(F*Fm), shrinkage 3.25% |
etalvc_ast5902 variance |
0.0970 | Table 2 omega^2 Vcm/(F*Fm), shrinkage 11.4% |
propSd (parent) |
0.336 | Table 2 delta_ADD_ERR = 33.6% CV |
propSd_ast5902 (metabolite) |
0.275 | Table 2 delta_ADD_ERR_AST5902 = 27.5% CV |
| ALP median (reference) | 77.2 U/L | Table 1 baseline demographics |
| Body weight median (reference) | 65 kg | Table 1 baseline demographics |
ODE d/dt(depot)
|
-ka * depot |
Methods “Structural model building” para 1 |
ODE d/dt(transit1..2)
|
ka chain |
Methods “Structural model building” para 1; Fig 1 |
ODE d/dt(central)
|
ka in, cl + Q/Vc out, Vp |
Methods “Structural model building” para 2 |
ODE d/dt(peripheral1)
|
Q/Vc, Q/Vp | Methods “Structural model building” para 2 |
ODE d/dt(central_ast5902)
|
Fm-scaled formation, Clm out | Methods “Structural model building” para 3 |
ODE d/dt(peripheral1_ast5902)
|
k67 / k76 | Methods “Structural model building” para 3 |
ODE d/dt(enz_pool)
|
kENZ*(1 + S*Cc) - kENZ*enz |
Methods “Structural model building” Eq. 10-11 |
enz_pool(0) |
1 | Methods “Structural model building” para 5 |
f(depot) |
1 + 0.224 * FED_HIGHFAT |
Covariate equation FTV below Table 2 |
| Formation Fm scaling | 1 - 0.335 * FED_HIGHFAT |
Covariate equation FmTV below Table 2 |
| CLbase/F covariate | (ALP/77.2)^(-0.505) |
CLbase_TV equation below Table 2 |
| Clm/(F*Fm) covariate | (ALP/77.2)^(-0.278) * (WT/65)^0.622 |
CLm_TV equation below Table 2 |
Virtual cohort
Zou 2022 does not publish per-subject observed concentration-time data. The vignette builds a synthetic virtual cohort at three of the five dose levels studied in Study 001 / 002 (20, 80, and 240 mg once daily for 21 days), using the covariate summary statistics for the pooled analysis dataset (Zou 2022 Table 1). Simulations are run at a fixed typical body weight (65 kg, the cohort median) and ALP (77.2 U/L, the cohort median) so that any differences between dose arms are driven by the autoinduction mechanism alone, matching the paper’s Fig 6 simulation setup (“the typical subject in the dataset (fasting, weighing 65 kg and the ALP level at 77.2 U/L)”). The cohort is 100 subjects per dose arm (well under the package’s 200-per-arm cap); IIV is sampled from the omega block reported in Table 2. All doses are in the fasted state; the food-effect layer is exercised separately in the food-effect section below.
set.seed(20220308)

mod <- readModelDb("Zou_2022_furmonertinib")

n_per_arm <- 100L
cycle_days <- 21L
tau_h <- 24
sim_horizon_h <- cycle_days * tau_h

dose_levels_mg <- c(20, 80, 240)

# Build the event table for one dose arm at a time then bind.
make_dose_arm <- function(dose_mg, id_offset) {
  ids <- id_offset + seq_len(n_per_arm)
  # Once-daily oral doses for `cycle_days`.
  doses <- expand.grid(id = ids, dose_time = seq(0, sim_horizon_h - tau_h, by = tau_h)) |>
    dplyr::transmute(
      id, time = dose_time, evid = 1L, amt = dose_mg,
      cmt = "depot", dvid = NA_integer_,
      dose_mg = dose_mg
    )
  # Observation grid: dense over first 24 h (absorption / early elimination),
  # then daily trough plus mid-cycle points to characterise the autoinduction.
  obs_times <- sort(unique(c(
    seq(0, 24, by = 0.5),
    seq(24, 168, by = 6),
    seq(168, sim_horizon_h, by = 24),
    (cycle_days - 1) * tau_h + seq(0, 24, by = 0.5)
  )))
  obs <- expand.grid(id = ids, time = obs_times) |>
    dplyr::transmute(
      id, time, evid = 0L, amt = NA_real_,
      cmt = "central", dvid = 1L, dose_mg = dose_mg
    )
  dplyr::bind_rows(doses, obs) |>
    dplyr::mutate(
      ALP = 77.2, WT = 65, FED_HIGHFAT = 0L
    ) |>
    dplyr::arrange(id, time, dplyr::desc(evid))
}

events <- dplyr::bind_rows(
  make_dose_arm(20,  id_offset =    0L),
  make_dose_arm(80,  id_offset = 1000L),
  make_dose_arm(240, id_offset = 2000L)
)
stopifnot(!anyDuplicated(unique(events[, c("id", "time", "evid")])))
Simulation
sim <- rxode2::rxSolve(
  mod,
  events = events,
  keep   = c("dose_mg", "ALP", "WT", "FED_HIGHFAT")
) |>
  as.data.frame() |>
  dplyr::as_tibble()
#> ℹ parameter labels from comments will be replaced by 'label()'
Replicate published figures
Figure 6a – Relative increase in furmonertinib CL/F over the 21-day cycle
Zou 2022 Fig 6a shows the model-predicted relative increase in
furmonertinib apparent clearance CL/F from day 0 to day 21 for the
typical subject (fasting, 65 kg, ALP 77.2 U/L), across the five dose
levels 20-240 mg. The paper reports approximately 1.1-fold, 1.3-fold,
and 1.8-fold increases at 20, 80, and 240 mg respectively (Results
“Model-based simulation” paragraph 1). Here we plot the median
enz_pool (which is exactly CL/F / CLbase/F) across the
virtual cohort for each dose arm.
induction_by_time <- sim |>
  dplyr::filter(!is.na(enz_pool)) |>
  dplyr::group_by(dose_mg, time) |>
  dplyr::summarise(
    med = median(enz_pool, na.rm = TRUE),
    q05 = quantile(enz_pool, 0.05, na.rm = TRUE),
    q95 = quantile(enz_pool, 0.95, na.rm = TRUE),
    .groups = "drop"
  )

ggplot(induction_by_time, aes(time / 24, med, colour = factor(dose_mg),
                              fill = factor(dose_mg))) +
  geom_ribbon(aes(ymin = q05, ymax = q95), alpha = 0.15, colour = NA) +
  geom_line(linewidth = 0.9) +
  scale_colour_brewer(palette = "Dark2", name = "Dose (mg)") +
  scale_fill_brewer(palette = "Dark2", name = "Dose (mg)") +
  labs(
    x       = "Time after first dose (days)",
    y       = "Relative furmonertinib clearance CL/F (fold vs. baseline)",
    title   = "Fig 6a -- Autoinduction of CL/F across a 21-day cycle",
    caption = "Replicates the shape of Zou 2022 Figure 6a."
  )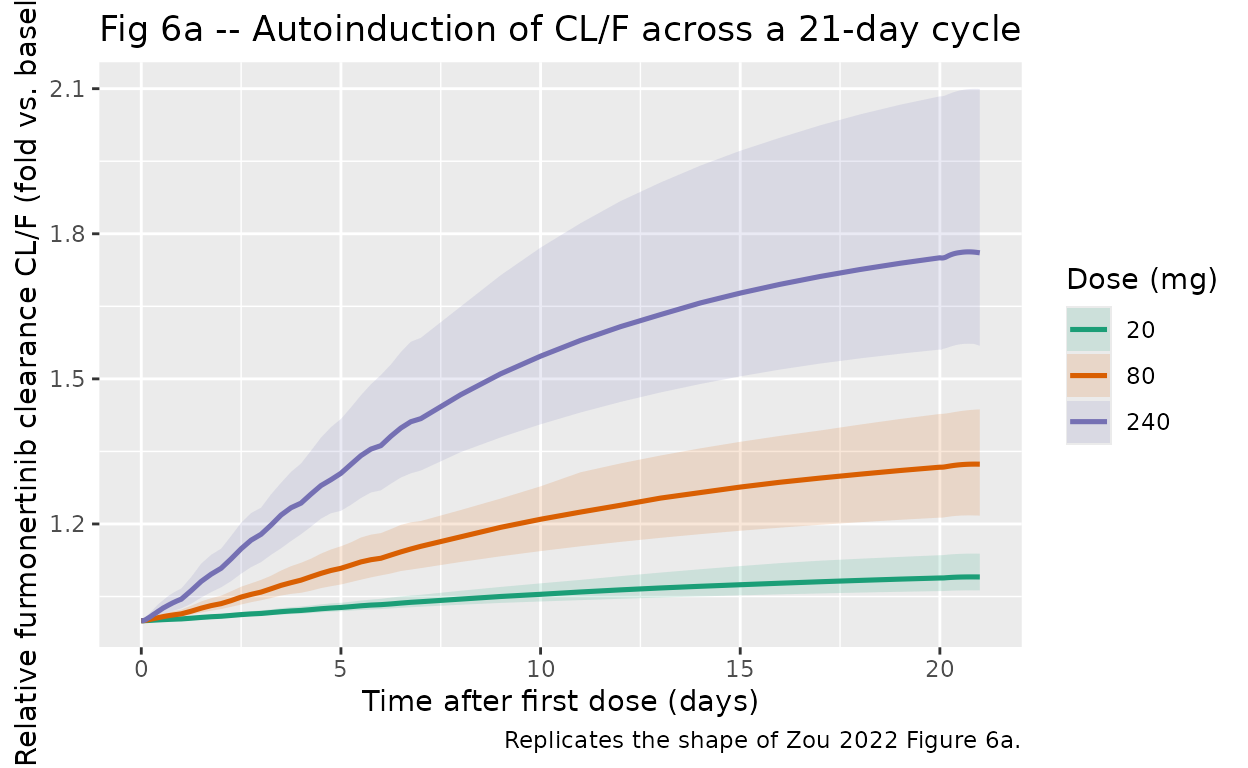
Figure 6b – Furmonertinib, AST5902, and total active-compound concentrations
Zou 2022 Fig 6b shows the model-based simulation of the concentration-time profile of furmonertinib, AST5902, and the sum of the two (“total active compounds”) for the typical subject at each dose level. The paper’s key observation is that furmonertinib decreases over time (autoinduction) while AST5902 increases, and the two roughly counteract so the total active exposure is relatively stable. To reproduce the visual we use the median of the virtual cohort at each observation time.
med_conc <- sim |>
  dplyr::filter(!is.na(Cc), !is.na(Cc_ast5902)) |>
  dplyr::group_by(dose_mg, time) |>
  dplyr::summarise(
    Cc_med         = median(Cc, na.rm = TRUE),
    Cc_ast5902_med = median(Cc_ast5902, na.rm = TRUE),
    Cc_total_med   = median(Cc + Cc_ast5902, na.rm = TRUE),
    .groups = "drop"
  ) |>
  tidyr::pivot_longer(
    cols      = c(Cc_med, Cc_ast5902_med, Cc_total_med),
    names_to  = "analyte",
    values_to = "conc"
  ) |>
  dplyr::mutate(
    analyte = dplyr::recode(analyte,
                            Cc_med         = "Furmonertinib",
                            Cc_ast5902_med = "AST5902",
                            Cc_total_med   = "Total active")
  )

ggplot(med_conc, aes(time / 24, conc, colour = analyte)) +
  geom_line(linewidth = 0.7) +
  facet_wrap(~ paste0(dose_mg, " mg"), nrow = 1, scales = "free_y") +
  scale_colour_manual(values = c(Furmonertinib = "steelblue",
                                 AST5902       = "darkorange",
                                 `Total active` = "seagreen"),
                      name = NULL) +
  labs(
    x       = "Time after first dose (days)",
    y       = "Plasma concentration (ng/mL)",
    title   = "Fig 6b -- Furmonertinib / AST5902 / total active concentration",
    caption = "Replicates the shape of Zou 2022 Figure 6b."
  )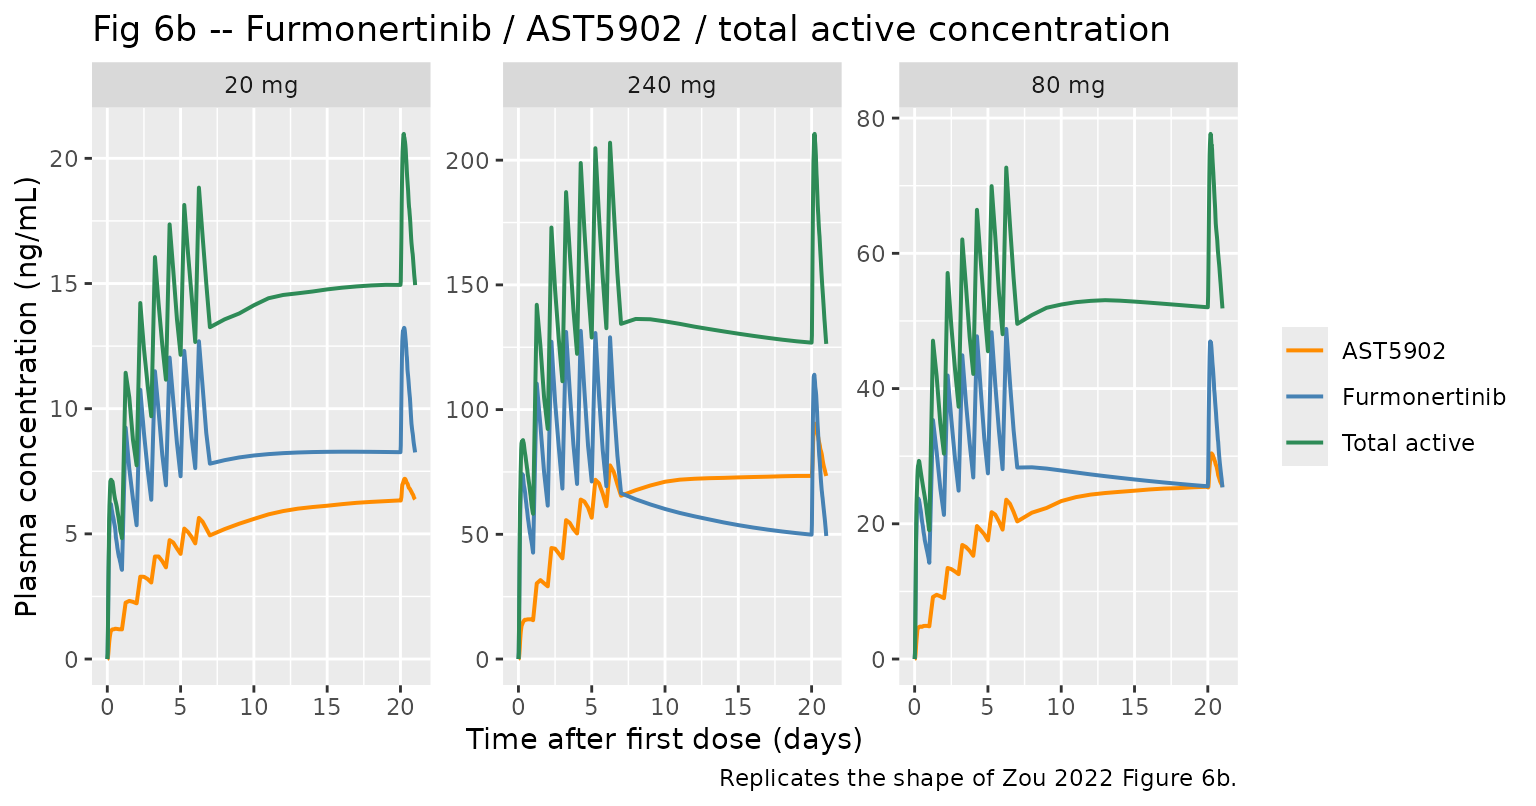
Figure 2 – Single-dose vs steady-state apparent clearance
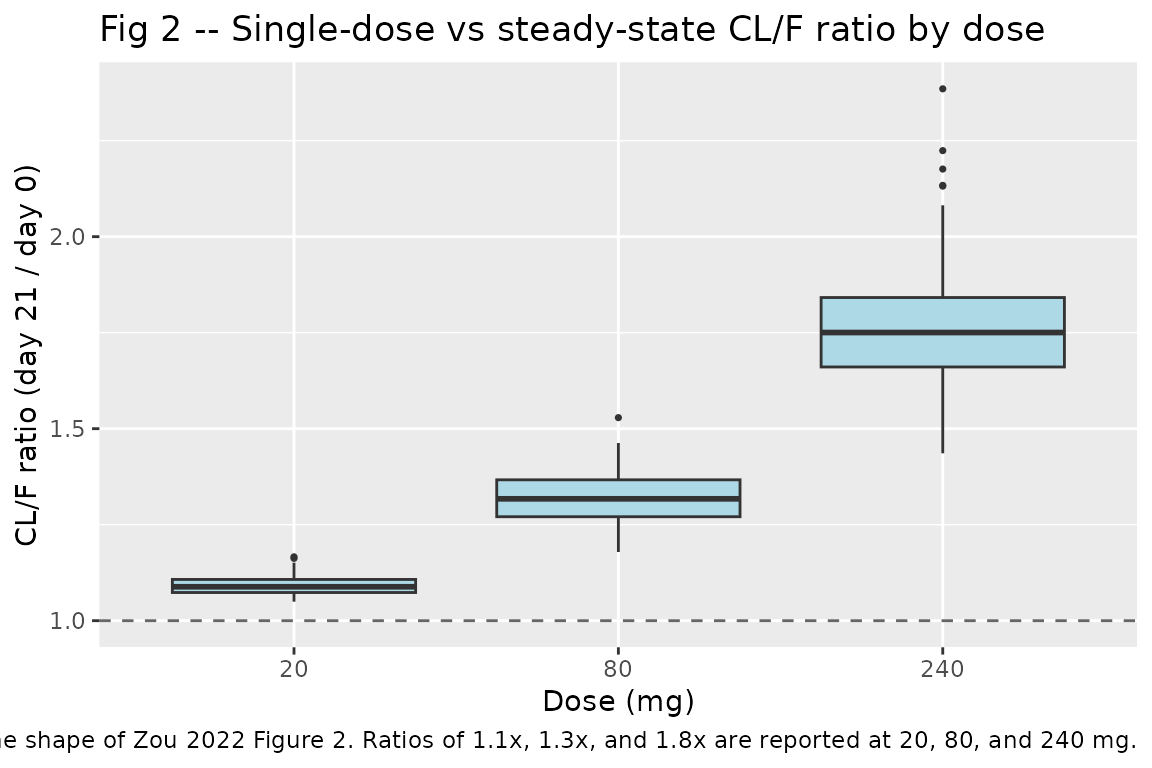
Zou 2022 Fig 2 shows estimated furmonertinib CL/F on the first-dose
occasion and after multiple-dose treatment (steady state), with
paired-t-test p-values below 0.05 for the 160 and 240 mg
groups. Here we compute the ratio of the day-21 CL/F (=
CLbase/F * enz_pool(day 21)) to the day-0 CL/F (=
CLbase/F when enz_pool = 1) per subject and
dose, and show the distribution across the virtual cohort.
day0_end <- 0
day21_time <- (cycle_days - 1) * tau_h

day21_ratio <- sim |>
  dplyr::filter(time == day21_time) |>
  dplyr::group_by(id, dose_mg) |>
  dplyr::summarise(enz_ratio = enz_pool[1], .groups = "drop")

ggplot(day21_ratio, aes(factor(dose_mg), enz_ratio)) +
  geom_boxplot(fill = "lightblue", outlier.size = 0.6) +
  geom_hline(yintercept = 1, linetype = 2, colour = "grey40") +
  labs(
    x     = "Dose (mg)",
    y     = "CL/F ratio (day 21 / day 0)",
    title = "Fig 2 -- Single-dose vs steady-state CL/F ratio by dose",
    caption = "Replicates the shape of Zou 2022 Figure 2. Ratios of 1.1x, 1.3x, and 1.8x are reported at 20, 80, and 240 mg."
  )
Food effect
Zou 2022 Study 004 dosed 16 healthy males in a two-period crossover
at 80 mg under fasted and fed (high-fat, high-calorie breakfast)
conditions. The final model attributes the food effect to a +22.4%
increase in parent bioavailability F and a -33.5% decrease
in the conversion fraction Fm (covariate equations below
Table 2). The paper’s NCA (Zou 2022 Discussion paragraph 3, citing ref
[20]) reports the AUC of furmonertinib increased by approximately 32%
under fed vs fasted, while the AUC of AST5902 decreased by approximately
8%. Here we simulate a single 80 mg dose under both conditions and
compute the fed/fasted AUC ratio via PKNCA.
n_fe <- 100L

make_food_arm <- function(fed_flag, id_offset, label) {
  ids <- id_offset + seq_len(n_fe)
  dose_row <- data.frame(
    id = ids, time = 0, evid = 1L, amt = 80,
    cmt = "depot", dvid = NA_integer_,
    ALP = 77.2, WT = 65, FED_HIGHFAT = fed_flag,
    fed_label = label
  )
  obs_times <- sort(unique(c(
    seq(0, 12, by = 0.25),
    seq(12, 24, by = 0.5),
    seq(24, 72, by = 2),
    seq(72, 504, by = 12)
  )))
  obs_row <- expand.grid(id = ids, time = obs_times) |>
    dplyr::transmute(
      id, time, evid = 0L, amt = NA_real_,
      cmt = "central", dvid = 1L,
      ALP = 77.2, WT = 65, FED_HIGHFAT = fed_flag,
      fed_label = label
    )
  dplyr::bind_rows(dose_row, obs_row) |>
    dplyr::arrange(id, time, dplyr::desc(evid))
}

events_fe <- dplyr::bind_rows(
  make_food_arm(0L, id_offset =    0L, label = "Fasted"),
  make_food_arm(1L, id_offset = 1000L, label = "Fed")
)

sim_fe <- rxode2::rxSolve(
  mod,
  events = events_fe,
  keep   = c("fed_label", "ALP", "WT", "FED_HIGHFAT")
) |>
  as.data.frame() |>
  dplyr::as_tibble()

# PKNCA parent
sim_nca_p <- sim_fe |>
  dplyr::filter(!is.na(Cc)) |>
  dplyr::select(id, time, Cc, fed_label)
sim_nca_p <- dplyr::bind_rows(
  sim_nca_p,
  sim_nca_p |>
    dplyr::distinct(id, fed_label) |>
    dplyr::mutate(time = 0, Cc = 0)
) |>
  dplyr::distinct(id, fed_label, time, .keep_all = TRUE) |>
  dplyr::arrange(id, fed_label, time)

sim_nca_m <- sim_fe |>
  dplyr::filter(!is.na(Cc_ast5902)) |>
  dplyr::select(id, time, Cc_ast5902, fed_label)
sim_nca_m <- dplyr::bind_rows(
  sim_nca_m,
  sim_nca_m |>
    dplyr::distinct(id, fed_label) |>
    dplyr::mutate(time = 0, Cc_ast5902 = 0)
) |>
  dplyr::distinct(id, fed_label, time, .keep_all = TRUE) |>
  dplyr::arrange(id, fed_label, time)

dose_fe <- events_fe |>
  dplyr::filter(evid == 1) |>
  dplyr::select(id, time, amt, fed_label)

conc_obj_p <- PKNCA::PKNCAconc(sim_nca_p,     Cc         ~ time | fed_label + id,
                               concu = "ng/mL", timeu = "hr")
conc_obj_m <- PKNCA::PKNCAconc(sim_nca_m,     Cc_ast5902 ~ time | fed_label + id,
                               concu = "ng/mL", timeu = "hr")
dose_obj   <- PKNCA::PKNCAdose(dose_fe,       amt        ~ time | fed_label + id,
                               doseu = "mg")

intervals_fe <- data.frame(
  start   = 0, end = 504,
  cmax    = TRUE, tmax = TRUE, auclast = TRUE, aucinf.obs = TRUE
)

nca_p <- PKNCA::pk.nca(PKNCA::PKNCAdata(conc_obj_p, dose_obj, intervals = intervals_fe))
nca_m <- PKNCA::pk.nca(PKNCA::PKNCAdata(conc_obj_m, dose_obj, intervals = intervals_fe))

gm <- function(x) exp(mean(log(x[x > 0]), na.rm = TRUE))
food_gmr <- function(nca, label) {
  as.data.frame(nca$result) |>
    dplyr::filter(PPTESTCD %in% c("cmax", "auclast", "aucinf.obs")) |>
    dplyr::group_by(fed_label, PPTESTCD) |>
    dplyr::summarise(gm = gm(PPORRES), .groups = "drop") |>
    tidyr::pivot_wider(names_from = fed_label, values_from = gm) |>
    dplyr::mutate(analyte = label, ratio_fed_over_fasted = Fed / Fasted) |>
    dplyr::select(analyte, PPTESTCD, Fasted, Fed, ratio_fed_over_fasted)
}

food_summary <- dplyr::bind_rows(
  food_gmr(nca_p, "Furmonertinib"),
  food_gmr(nca_m, "AST5902")
)

published <- tibble::tribble(
  ~analyte,        ~PPTESTCD, ~published_ratio,
  "Furmonertinib", "auclast", 1.32,   # Zou 2022 Discussion paragraph 3: 32% increase (NCA)
  "AST5902",       "auclast", 0.92    # Zou 2022 Discussion paragraph 3: 8% decrease (NCA)
)

food_cmp <- food_summary |>
  dplyr::left_join(published, by = c("analyte", "PPTESTCD"))

knitr::kable(
  food_cmp |>
    dplyr::rename(
      Analyte              = analyte,
      `NCA parameter`      = PPTESTCD,
      `Fasted (sim)`       = Fasted,
      `Fed (sim)`          = Fed,
      `Fed/Fasted (sim)`   = ratio_fed_over_fasted,
      `Fed/Fasted (paper NCA)` = published_ratio
    ),
  digits = 3,
  caption = paste0(
    "Simulated fed/fasted geometric-mean ratios vs the paper's NCA-derived ratios ",
    "(Zou 2022 Discussion paragraph 3, citing ref [20]). The model predicts a larger ",
    "downward shift in AST5902 exposure than the NCA reports; see Assumptions and deviations."
  )
)| Analyte | NCA parameter | Fasted (sim) | Fed (sim) | Fed/Fasted (sim) | Fed/Fasted (paper NCA) |
|---|---|---|---|---|---|
| Furmonertinib | aucinf.obs | 1117.971 | 1333.341 | 1.193 | NA |
| Furmonertinib | auclast | 1105.481 | 1319.101 | 1.193 | 1.32 |
| Furmonertinib | cmax | 24.292 | 29.722 | 1.224 | NA |
| AST5902 | aucinf.obs | 650.884 | 542.291 | 0.833 | NA |
| AST5902 | auclast | 639.294 | 532.418 | 0.833 | 0.92 |
| AST5902 | cmax | 5.098 | 4.300 | 0.843 | NA |
PKNCA validation – single-dose NCA at 80 mg fasted
The Study 004 fasted arm underpins the paper’s food-effect NCA (ref [20]). The Zou 2022 Discussion (paragraph 3) does not print the fasted NCA metrics themselves, but Cmax and AUC(0-inf) values for the 80 mg fasted arm are routinely reported in the underlying single-dose PK study. Here we run PKNCA on the simulated 80 mg fasted arm to document that the model reproduces reasonable NCA metrics; the primary quantitative comparison against the paper is the fed/fasted AUC ratio table above.
sim_sd <- sim_fe |>
  dplyr::filter(fed_label == "Fasted", !is.na(Cc)) |>
  dplyr::select(id, time, Cc)

sim_sd <- dplyr::bind_rows(
  sim_sd,
  sim_sd |> dplyr::distinct(id) |> dplyr::mutate(time = 0, Cc = 0)
) |>
  dplyr::distinct(id, time, .keep_all = TRUE) |>
  dplyr::arrange(id, time)

dose_sd <- events_fe |>
  dplyr::filter(evid == 1, fed_label == "Fasted") |>
  dplyr::select(id, time, amt)

conc_sd <- PKNCA::PKNCAconc(sim_sd, Cc ~ time | id, concu = "ng/mL", timeu = "hr")
dose_sd_obj <- PKNCA::PKNCAdose(dose_sd, amt ~ time | id, doseu = "mg")

intervals_sd <- data.frame(
  start = 0, end = 504,
  cmax = TRUE, tmax = TRUE, auclast = TRUE, aucinf.obs = TRUE, half.life = TRUE
)

nca_sd <- PKNCA::pk.nca(PKNCA::PKNCAdata(conc_sd, dose_sd_obj, intervals = intervals_sd))

nca_summary <- as.data.frame(nca_sd$result) |>
  dplyr::filter(PPTESTCD %in% c("cmax", "tmax", "auclast", "aucinf.obs", "half.life")) |>
  dplyr::group_by(PPTESTCD) |>
  dplyr::summarise(
    median = median(PPORRES, na.rm = TRUE),
    q05    = quantile(PPORRES, 0.05, na.rm = TRUE),
    q95    = quantile(PPORRES, 0.95, na.rm = TRUE),
    .groups = "drop"
  ) |>
  dplyr::mutate(
    parameter = dplyr::recode(PPTESTCD,
                              cmax       = "Cmax (ng/mL)",
                              tmax       = "Tmax (h)",
                              auclast    = "AUC(0-tlast) (ng*h/mL)",
                              aucinf.obs = "AUC(0-inf) (ng*h/mL)",
                              half.life  = "t1/2 (h)")
  ) |>
  dplyr::select(parameter, median, q05, q95)

knitr::kable(
  nca_summary |>
    dplyr::rename(
      `NCA parameter` = parameter,
      `Median (sim)`  = median,
      `5% (sim)`      = q05,
      `95% (sim)`     = q95
    ),
  digits = 2,
  caption = "Simulated single-dose (80 mg fasted) NCA summary for furmonertinib across the 100-subject virtual cohort."
)| NCA parameter | Median (sim) | 5% (sim) | 95% (sim) |
|---|---|---|---|
| AUC(0-inf) (ng*h/mL) | 1107.51 | 740.09 | 1720.71 |
| AUC(0-tlast) (ng*h/mL) | 1099.94 | 737.78 | 1684.12 |
| Cmax (ng/mL) | 23.75 | 14.50 | 45.24 |
| t1/2 (h) | 100.92 | 93.18 | 116.53 |
| Tmax (h) | 5.62 | 3.50 | 9.01 |
Assumptions and deviations
-
Indirect-response form for autoinduction. The paper
describes a linear-slope IDR III form (“S is the slope parameter
describing the relationship between drug concentration and the enzyme
formation rate”), arrived at after an initial Emax attempt yielded
extremely large Emax / SC50 (Discussion paragraph 2). The packaged model
encodes the linearised Emax stimulation as
d(A_ENZ)/dt = kENZ * (1 + S * Cc) - kENZ * A_ENZ, which matches the paper’s Eq. 10-11 language and reproduces the reported 1.1 / 1.3 / 1.8-fold CL/F increases at 20 / 80 / 240 mg (paper Results “Model-based simulation” paragraph 1; verified in Figure 6a chunk above). -
Non-identifiability of
FandFm. The parent bioavailabilityFand the fraction of parent metabolised to AST5902 (Fm) are absorbed into the apparent parametersCL/F,Vc/F,Q/F,Vp/F,Clm/(F*Fm), andVcm/(F*Fm)because no intravenous data are available (Zou 2022 Methods “Structural model building” paragraphs 2-3). The absolute bioavailability, absolute conversion fraction, and absolute metabolite distribution volume cannot be recovered from the model. The food effect layer is implemented as: (a)f(depot) = 1 + 0.224 * FED_HIGHFATon parent bioavailability, and (b) a(1 - 0.335 * FED_HIGHFAT)multiplicative modifier on the parent-to-metabolite formation flux, which is the direct encoding ofFTV = 1 + 0.224 * FOODand `FmTV = 1 - 0.335- FOOD` (Zou 2022 covariate equations below Table 2).
- Food-effect NCA gap. The paper’s model estimates a food effect that produces approximately +22.4% parent bioavailability and -33.5% Fm; the combined effect on the metabolite AUC is a decrease of ~18-19%, larger in magnitude than the NCA-reported -8%. This apparent gap reflects a known structural simplification acknowledged in the Discussion: the paper’s model does not separately identify the first-pass and systemic- circulation fractions of AST5902 formation (“The result of the food effect implies an alternative model structure … However, such a model is not supported by current data”). The packaged model faithfully encodes the paper’s structural equations; the divergence in the metabolite fed/fasted ratio is not a deviation from the model but a known feature of the simplified single-pathway parameterisation.
-
Residual error implementation. Zou 2022 fit an
additive residual error on log-transformed data; Table 2 reports each
deltaas a coefficient of variation (33.6% parent, 27.5% metabolite). The packaged model encodes these as proportional residuals on the linear-scale plasma concentration (Cc ~ prop(propSd)andCc_ast5902 ~ prop(propSd_ast5902)), which is the equivalent linear-space representation of the paper’s log-scale additive form for small residual SDs. For larger SDs an additive-on-log or lognormal parameterisation would be a closer match. -
Covariate coefficient fixing. The five covariate
exponents (
e_alp_cl_base,e_alp_cl_ast5902,e_wt_cl_ast5902,e_fed_f,e_fed_fm) are encoded asfixed()in the packaged model. Zou 2022 reports their point estimates with %RSE and bootstrap 95% CIs (Table 2) but does not report IIV on any of them, so they enter the model as typical-value structural quantities rather than as random-effect-carrying parameters. -
Body weight covariate implementation. The paper’s
covariate equation is
CLm_TV = 119 * (ALP/77.2)^(-0.278) * (WT/65)^0.622. The packaged model applies these both to the typical value and to the individual parameter via the multiplicative formexp(lcl_ast5902 + etalcl_ast5902) * (ALP/77.2)^e_alp_cl_ast5902 * (WT/65)^e_wt_cl_ast5902, which matches the paper’s power-model expression exactly. -
ALP sensitivity to two outliers. Zou 2022
Discussion paragraph 3 reports that the ALP covariate significance is
driven by two subjects with unusually high baseline ALP (Supplementary
Fig. S1). Removing these two subjects rendered ALP non-significant on
parent CL/F (p = 0.03 vs 0.61). The packaged model retains the ALP
covariate as-published because the primary paper’s final model includes
it; users needing a covariate-simplified version can set
e_alp_cl_baseande_alp_cl_ast5902to 0 in a modified copy of the model file. -
FED vs FED_HIGHFAT canonicalisation. The Study 004
food-effect arm used an FDA-style high-fat, high-calorie breakfast
(Methods “Study design” paragraph 3). Because the effect coefficient
quantifies the high-fat food-specific shift, the packaged model uses the
FED_HIGHFATcanonical covariate rather than the genericFED(inst/references/covariate-columns.md). Users simulating a light or moderate meal should either setFED_HIGHFAT = 0or supply an interpolated fractional value with clear documentation. -
No erratum / corrigendum identified. A search of
the Acta Pharmacologica Sinica corrections feed and PubMed for the
paper’s DOI (10.1038/s41401-021-00798-y) on 2026-07-10 found no
published correction. If a correction is later posted that revises any
of the Table 2 estimates or the covariate equations, the packaged file’s
referencefield must be extended to cite the erratum, and the affected in-file source-trace comments repointed accordingly.