Beta-lactam and beta-lactamase-inhibitor PBP binding in Pseudomonas aeruginosa (Lopez-Arguello 2023)
Source:vignettes/articles/LopezArguello_2023_pbp_binding_pseudomonas.Rmd
LopezArguello_2023_pbp_binding_pseudomonas.RmdOverview
Lopez-Arguello and colleagues measured the time course of covalent penicillin-binding protein (PBP) inactivation by 15 beta-lactams and beta-lactamase inhibitors (BLIs) in Pseudomonas aeruginosa PAO1, in two parallel assays:
- Intact (whole) cells – drug must first cross the outer membrane (OM) to reach the periplasmic PBPs, so the observed binding reflects the net rate of influx and PBP access (influx minus efflux minus beta-lactamase hydrolysis).
- Lysed cells (isolated PBP-containing membranes) – the OM barrier is absent and drug is present in vast excess, so the observed binding reflects intrinsic PBP affinity alone.
A quantitative and systems pharmacology (QSP) model was fit simultaneously to both assays. The difference between them identifies the rate of net influx and PBP access, and the model implements a periplasmic mass balance: every drug molecule that binds a PBP is consumed, so the six PBPs compete for the same finite periplasmic pool. Because PBP5/6 accounts for 71% of all PBP molecules per cell, it acts as a decoy target (sink) that soaks up slowly penetrating drugs before they can reach the essential PBPs 1a, 1b, 2 and 3.
This vignette reproduces the published model for all 15 drugs and validates it against the paper’s own non-compartmental summary of PBP occupancy (Tables 2 and 3).
Models in this family
The paper reports one common model structure with drug-specific
parameters (Table 1 and Table S1), so the extraction is one
.R file per drug and one vignette for the paper.
MIC and Conc (the studied extracellular
concentration, 2x MIC for the beta-lactams and a fixed 4
mg/L for the BLIs) are columns 3 and 4 of Table 1. Conc is
the value supplied to each model’s CONC_<CODE>_MGL
covariate below.
pbp_drugs <- tibble::tribble(
  ~Drug,           ~Code, ~Class,          ~MIC,  ~Conc,
  "imipenem",      "IPM", "Carbapenem",       1,      2,
  "doripenem",     "DOR", "Carbapenem",       1,      2,
  "meropenem",     "MEM", "Carbapenem",     0.5,      1,
  "ertapenem",     "ETP", "Carbapenem",       4,      8,
  "ceftazidime",   "CAZ", "Cephalosporin",    1,      2,
  "cefepime",      "FEP", "Cephalosporin",    1,      2,
  "cefoxitin",     "FOX", "Cephalosporin", 1024,   2048,
  "aztreonam",     "ATM", "Monobactam",       4,      8,
  "piperacillin",  "PIP", "Penicillin",       4,      8,
  "carbenicillin", "CAR", "Penicillin",      48,     96,
  "ticarcillin",   "TIC", "Penicillin",      24,     48,
  "avibactam",     "AVI", "DBO-BLI",         NA,      4,
  "relebactam",    "REL", "DBO-BLI",         NA,      4,
  "sulbactam",     "SUL", "BLI",             NA,      4,
  "tazobactam",    "TZB", "BLI",             NA,      4
) |>
  mutate(
    Model    = paste0("LopezArguello_2023_", Drug, "_qsp"),
    ConcCol  = paste0("CONC_", Code, "_MGL")
  )

knitr::kable(
  pbp_drugs |> select(Model, Drug, Code, Class, `MIC (mg/L)` = MIC, `Conc (mg/L)` = Conc),
  caption = "The 15 model files contributed by this paper, with the MIC and studied extracellular concentration from Table 1."
)| Model | Drug | Code | Class | MIC (mg/L) | Conc (mg/L) |
|---|---|---|---|---|---|
| LopezArguello_2023_imipenem_qsp | imipenem | IPM | Carbapenem | 1.0 | 2 |
| LopezArguello_2023_doripenem_qsp | doripenem | DOR | Carbapenem | 1.0 | 2 |
| LopezArguello_2023_meropenem_qsp | meropenem | MEM | Carbapenem | 0.5 | 1 |
| LopezArguello_2023_ertapenem_qsp | ertapenem | ETP | Carbapenem | 4.0 | 8 |
| LopezArguello_2023_ceftazidime_qsp | ceftazidime | CAZ | Cephalosporin | 1.0 | 2 |
| LopezArguello_2023_cefepime_qsp | cefepime | FEP | Cephalosporin | 1.0 | 2 |
| LopezArguello_2023_cefoxitin_qsp | cefoxitin | FOX | Cephalosporin | 1024.0 | 2048 |
| LopezArguello_2023_aztreonam_qsp | aztreonam | ATM | Monobactam | 4.0 | 8 |
| LopezArguello_2023_piperacillin_qsp | piperacillin | PIP | Penicillin | 4.0 | 8 |
| LopezArguello_2023_carbenicillin_qsp | carbenicillin | CAR | Penicillin | 48.0 | 96 |
| LopezArguello_2023_ticarcillin_qsp | ticarcillin | TIC | Penicillin | 24.0 | 48 |
| LopezArguello_2023_avibactam_qsp | avibactam | AVI | DBO-BLI | NA | 4 |
| LopezArguello_2023_relebactam_qsp | relebactam | REL | DBO-BLI | NA | 4 |
| LopezArguello_2023_sulbactam_qsp | sulbactam | SUL | BLI | NA | 4 |
| LopezArguello_2023_tazobactam_qsp | tazobactam | TZB | BLI | NA | 4 |
Experimental system
The population metadata of every model file records the
same in vitro system.
pop <- rxode2::rxode2(readModelDb("LopezArguello_2023_imipenem_qsp"))$meta$population
tibble::tibble(Field = names(pop), Value = unlist(lapply(pop, paste, collapse = "; "))) |>
knitr::kable(caption = "Experimental system (identical across the 15 model files except for the drug-specific concentration and estimation dataset).")| Field | Value |
|---|---|
| species | in vitro (Pseudomonas aeruginosa PAO1 reference strain) |
| n_subjects | 1 |
| n_studies | 1 |
| disease_state | Wild-type P. aeruginosa PAO1; imipenem MIC 1 mg/L (CLSI broth microdilution) |
| model_system | Covalent PBP-binding assay in intact cells and in lysed cells (isolated membranes). Late exponential-phase cultures (7.6 log10 CFU/mL) in cation-adjusted Mueller-Hinton broth at 37 degrees C were sampled at 0, 15, 30 and 60 min; unbound PBPs were then labelled with 25 uM Bocillin FL and quantified by SDS-PAGE band intensity. |
| dose_range | imipenem at a static extracellular concentration of 2 mg/L (2x the MIC of 1 mg/L); no dosing events |
| notes | Estimated by population modelling in S-ADAPT v1.57 (importance sampling, pmethod=4); the intact-cell and lysed-cell data were fit simultaneously. The 15 drugs were split into five estimation datasets of four drugs each with imipenem as the shared backbone drug; the Noise, Fini and residual-error parameters in this file are those of dataset 1 (IPM, DOR, MEM, ETP) (Table S2). Imipenem was the backbone drug of all five datasets and Table S1 reports a single set of imipenem acylation rate constants; dataset 1 was selected here for the nuisance parameters, which the paper does not attribute to a particular dataset for imipenem (the maintainers’ decision). The total number of PBP molecules per cell (1,731) was borrowed from published Escherichia coli data and split across the six PBPs using the P. aeruginosa relative band intensities (Materials and Methods, Mass balance equations; Table S3). |
Late exponential-phase PAO1 cultures (7.6 log10 CFU/mL) in cation-adjusted Mueller-Hinton broth at 37 C were exposed to each beta-lactam at 2x its MIC (BLIs: a fixed 4 mg/L). Membranes were harvested at 0, 15, 30 and 60 min, and the unbound PBPs were then labelled with 25 uM Bocillin FL and quantified by SDS-PAGE band intensity. A normalised band intensity of 1.0 means no binding and 0.0 means complete inactivation.
Source trace
Every model equation and every ini() entry, with its
location in the source.
tibble::tribble(
  ~Component, ~Source,
  "Rate_Influx/access = Rate_Influx/access,scaled x C_drug", "Main text, Materials and Methods, Eq 1 (image `aac.01603-22-m001`); Fig. S8 line 67",
  "MM_i = K_i x N_peri / (Km + N_peri)", "Fig. S8 lines 14-19 (authoritative); main-text Eq 2 (`m002`) writes the equivalent Vmax/(Km+N_peri) form",
  "d(N_PBPi)/dt = -MM_i x N_PBPi", "Fig. S8 lines 21-26; main-text Eq 3 (`m003`)",
  "d(N_peri)/dt = Rate_Influx/access - sum_i MM_i x N_PBPi", "Fig. S8 line 28; main-text Eq 4 (`m004`)",
  "Intact assay: influx active, N_peri(0) = 0", "Fig. S8 lines 66-68",
  "Lysed assay: influx = 0, N_peri(0) = 1e7 molecules", "Fig. S8 lines 69-72; supplement Results",
  "Acylation constants rescaled by 1/1000 (Table S1 is in 1e-3 /min)", "Fig. S8 lines 75-80",
  "Initial conditions N_PBPi(0) = N_i x (1 - Noise_i) x Fini_i", "Fig. S8 lines 84-89",
  "Output Y_i = N_PBPi + N_i x Noise_i x Fini_i", "Fig. S8 lines 102-107",
  "Negative-state guard max(N_PBPi, 0)", "Fig. S8 lines 94-100",
  "Residual variance V_i = (SDin_i + SDsl_i x Y_i)^2 -> combined1()", "Fig. S8 lines 111-116",
  "rate_influx_scaled (per drug)", "Table 1, column 'Rate_Influx/access,scaled (SE%)'",
  "CONC_<CODE>_MGL covariate (per drug)", "Table 1, column 'Studied extracellular drug conc. in PBP binding assays'",
  "CELLS_INTACT covariate", "Fig. S8 line 66 `IF (INTACT.EQ.1)`; canonical name ratified by the maintainers",
  "k2_1a ... k2_5 (per drug); `fixed()` where footnote a applies", "Table S1 (footnote a = fixed after sensitivity analysis; footnote b = relebactam PBP2 shared with avibactam)",
  "km_pbp = 1000 drug molecules (fixed)", "Main text, Materials and Methods: \"The Km was fixed to 1,000 drug molecules\"",
  "n_pbp1a_0 = 153, 1b = 118, 2 = 50, 3 = 79, 4 = 99, 5/6 = 1232", "Main text, Materials and Methods, Mass balance equations (1,731 total PBP molecules per cell borrowed from E. coli; split by P. aeruginosa relative band intensity, Table S3)",
  "noise_*, fini_*, addSd_*, propSd_*", "Table S2, per estimation dataset"
) |>
knitr::kable(caption = "Source trace for the model structure and parameters.")| Component | Source |
|---|---|
| Rate_Influx/access = Rate_Influx/access,scaled x C_drug | Main text, Materials and Methods, Eq 1 (image
aac.01603-22-m001); Fig. S8 line 67 |
| MM_i = K_i x N_peri / (Km + N_peri) | Fig. S8 lines 14-19 (authoritative); main-text Eq 2
(m002) writes the equivalent Vmax/(Km+N_peri) form |
| d(N_PBPi)/dt = -MM_i x N_PBPi | Fig. S8 lines 21-26; main-text Eq 3
(m003) |
| d(N_peri)/dt = Rate_Influx/access - sum_i MM_i x N_PBPi | Fig. S8 line 28; main-text Eq 4
(m004) |
| Intact assay: influx active, N_peri(0) = 0 | Fig. S8 lines 66-68 |
| Lysed assay: influx = 0, N_peri(0) = 1e7 molecules | Fig. S8 lines 69-72; supplement Results |
| Acylation constants rescaled by 1/1000 (Table S1 is in 1e-3 /min) | Fig. S8 lines 75-80 |
| Initial conditions N_PBPi(0) = N_i x (1 - Noise_i) x Fini_i | Fig. S8 lines 84-89 |
| Output Y_i = N_PBPi + N_i x Noise_i x Fini_i | Fig. S8 lines 102-107 |
| Negative-state guard max(N_PBPi, 0) | Fig. S8 lines 94-100 |
| Residual variance V_i = (SDin_i + SDsl_i x Y_i)^2 -> combined1() | Fig. S8 lines 111-116 |
| rate_influx_scaled (per drug) | Table 1, column ‘Rate_Influx/access,scaled (SE%)’ |
CONC__MGL covariate (per drug)
|
Table 1, column ‘Studied extracellular drug conc. in PBP binding assays’ |
| CELLS_INTACT covariate | Fig. S8 line 66 IF (INTACT.EQ.1);
canonical name ratified by the maintainers |
k2_1a … k2_5 (per drug); fixed() where
footnote a applies |
Table S1 (footnote a = fixed after sensitivity analysis; footnote b = relebactam PBP2 shared with avibactam) |
| km_pbp = 1000 drug molecules (fixed) | Main text, Materials and Methods: “The Km was fixed to 1,000 drug molecules” |
| n_pbp1a_0 = 153, 1b = 118, 2 = 50, 3 = 79, 4 = 99, 5/6 = 1232 | Main text, Materials and Methods, Mass balance equations (1,731 total PBP molecules per cell borrowed from E. coli; split by P. aeruginosa relative band intensity, Table S3) |
| noise_, fini_, addSd_, propSd_ | Table S2, per estimation dataset |
Units and dimensional analysis
tibble::tribble(
  ~Symbol, ~Units, ~Note,
  "N_PBPi", "molecules/cell", "State: unbound molecules of PBP i per bacterial cell",
  "N_peri", "molecules/cell", "State: free drug molecules in the periplasm per cell",
  "K_i (kacyl)", "1/min", "Table S1 value x 1e-3",
  "Km", "molecules/cell", "Fixed at 1000",
  "MM_i", "1/min", "K_i x (dimensionless N_peri/(Km+N_peri))",
  "Rate_Influx/access,scaled", "molecules/min per mg/L", "Table 1",
  "C_drug", "mg/L", "Static extracellular concentration",
  "Rate_Influx/access", "molecules/min", "scaled rate x C_drug",
  "d(N_PBPi)/dt", "molecules/cell/min", "MM_i [1/min] x N_PBPi [molecules/cell]",
  "d(N_peri)/dt", "molecules/cell/min", "Influx [molecules/min] minus sum of binding fluxes [molecules/min]"
) |>
knitr::kable(caption = "Units of every symbol in the ODE system. Each ODE right-hand side resolves to molecules per cell per minute.")| Symbol | Units | Note |
|---|---|---|
| N_PBPi | molecules/cell | State: unbound molecules of PBP i per bacterial cell |
| N_peri | molecules/cell | State: free drug molecules in the periplasm per cell |
| K_i (kacyl) | 1/min | Table S1 value x 1e-3 |
| Km | molecules/cell | Fixed at 1000 |
| MM_i | 1/min | K_i x (dimensionless N_peri/(Km+N_peri)) |
| Rate_Influx/access,scaled | molecules/min per mg/L | Table 1 |
| C_drug | mg/L | Static extracellular concentration |
| Rate_Influx/access | molecules/min | scaled rate x C_drug |
| d(N_PBPi)/dt | molecules/cell/min | MM_i [1/min] x N_PBPi [molecules/cell] |
| d(N_peri)/dt | molecules/cell/min | Influx [molecules/min] minus sum of binding fluxes [molecules/min] |
Both ODE lines balance: MM_i carries 1/min
(the Michaelis-Menten factor N_peri/(Km + N_peri) is
dimensionless), so MM_i * N_PBPi is
molecules/cell/min, matching d(N_PBPi)/dt; the
same product appears with opposite sign in the periplasmic balance
alongside the influx rate.
Simulation
Each model is solved twice: once with intact = 1 (whole
cells, drug enters at Rate_Influx/access) and once with
intact = 0 (lysed cells, N_peri(0) = 10^7
molecules). These are deterministic typical-value solves – the paper
reports population means only, no between-replicate variance components
(see Assumptions below).
obs_times <- c(0, 15, 30, 60)                 # the paper's sampling schedule
dense_times <- seq(0, 60, by = 0.5)           # for smooth trajectory plots

solve_one <- function(i, times, intact_value) {
  mod <- rxode2::rxode2(readModelDb(pbp_drugs$Model[i]))
  # The two covariates ride on the event table: CELLS_INTACT selects the assay
  # arm, and the drug-specific CONC_<CODE>_MGL column supplies the studied
  # extracellular concentration.
  # A multi-endpoint model needs an endpoint on each observation record; PBP1a
  # is used here and rxSolve returns all six endpoints as columns.
  ev <- data.frame(
    id = 1L, time = times, amt = 0, evid = 0L, cmt = "PBP1a",
    CELLS_INTACT = intact_value
  )
  ev[[pbp_drugs$ConcCol[i]]] <- pbp_drugs$Conc[i]
  as.data.frame(rxode2::rxSolve(mod, events = ev))
}

simulate_all <- function(times) {
  per_drug <- lapply(seq_len(nrow(pbp_drugs)), function(i) {
    lapply(c(Intact = 1, Lysed = 0), function(sc) {
      solve_one(i, times, sc) |>
        select(time, PBP1a, PBP1b, PBP2, PBP3, PBP4, PBP56) |>
        mutate(Drug = pbp_drugs$Drug[i], Code = pbp_drugs$Code[i], Cells = ifelse(sc == 1, "Intact", "Lysed"))
    }) |> bind_rows()
  })
  bind_rows(per_drug) |>
    pivot_longer(
      c(PBP1a, PBP1b, PBP2, PBP3, PBP4, PBP56),
      names_to = "PBP", values_to = "n_unbound"
    ) |>
    mutate(PBP = recode(PBP, PBP56 = "PBP5/6")) |>
    group_by(Drug, Code, Cells, PBP) |>
    # The paper normalises every band to its own 0 h intensity (1.0 = no binding).
    mutate(frac_unbound = n_unbound / n_unbound[time == 0]) |>
    ungroup()
}

sim_obs <- simulate_all(obs_times)
sim_dense <- simulate_all(dense_times)

drug_levels <- pbp_drugs$Drug
sim_obs <- mutate(sim_obs, Drug = factor(Drug, levels = drug_levels))
sim_dense <- mutate(sim_dense, Drug = factor(Drug, levels = drug_levels))

nrow(sim_dense)
#> [1] 21780
Published extent of PBP binding
Tables 2 (imipenem through aztreonam) and 3 (piperacillin through tazobactam) report the average fraction of unbound PBPs over the first 60 min – the linear trapezoidal AUC divided by 60. A value of 1.00 means no binding and 0.00 means complete inactivation. These 180 values are the paper’s quantitative summary of the whole experiment and are used below both to annotate Figure 4 and as the reference for the NCA comparison.
published_wide <- tibble::tribble(
  ~PBP,     ~Cells,   ~IPM, ~DOR, ~MEM, ~ETP, ~CAZ, ~FEP, ~FOX, ~ATM, ~PIP, ~CAR, ~TIC, ~AVI, ~REL, ~SUL, ~TZB,
  "PBP1a",  "Intact", 0.29, 0.67, 0.68, 0.87, 0.61, 0.61, 0.24, 1.02, 0.79, 0.41, 0.48, 0.93, 0.87, 0.88, 0.98,
  "PBP1b",  "Intact", 0.30, 0.33, 0.37, 0.79, 0.87, 0.94, 0.38, 0.94, 0.89, 0.36, 0.43, 0.78, 0.84, 0.75, 1.05,
  "PBP2",   "Intact", 0.38, 0.30, 0.31, 0.63, 0.85, 0.96, 0.45, 1.02, 0.91, 0.82, 0.77, 0.80, 0.81, 0.97, 1.04,
  "PBP3",   "Intact", 0.35, 0.38, 0.44, 0.47, 0.51, 0.60, 0.47, 0.39, 0.48, 0.39, 0.48, 0.89, 0.81, 0.98, 1.10,
  "PBP4",   "Intact", 0.44, 0.22, 0.38, 0.33, 0.80, 0.69, 0.27, 1.01, 0.69, 0.49, 0.59, 0.75, 0.84, 0.74, 1.06,
  "PBP5/6", "Intact", 0.27, 0.36, 0.56, 0.93, 0.83, 0.98, 0.18, 0.97, 1.11, 0.80, 1.08, 0.90, 0.90, 0.84, 1.14,
  "PBP1a",  "Lysed",  0.19, 0.26, 0.29, 0.31, 0.17, 0.15, 0.14, 0.26, 0.14, 0.13, 0.10, 1.07, 0.95, 0.68, 0.79,
  "PBP1b",  "Lysed",  0.18, 0.26, 0.21, 0.27, 0.36, 0.34, 0.16, 0.24, 0.14, 0.15, 0.14, 0.64, 0.98, 0.48, 0.73,
  "PBP2",   "Lysed",  0.37, 0.34, 0.37, 0.35, 0.57, 0.47, 0.37, 0.64, 0.18, 0.20, 0.32, 0.79, 0.88, 0.79, 1.10,
  "PBP3",   "Lysed",  0.52, 0.47, 0.57, 0.35, 0.21, 0.14, 0.43, 0.23, 0.23, 0.17, 0.17, 1.07, 1.05, 1.09, 1.05,
  "PBP4",   "Lysed",  0.21, 0.23, 0.24, 0.20, 0.35, 0.17, 0.19, 0.36, 0.14, 0.17, 0.15, 0.61, 0.82, 0.70, 0.97,
  "PBP5/6", "Lysed",  0.19, 0.43, 0.54, 0.40, 0.82, 1.02, 0.13, 1.01, 0.82, 0.58, 0.67, 0.49, 0.86, 0.46, 0.90
)

published <- published_wide |>
  pivot_longer(-c(PBP, Cells), names_to = "Code", values_to = "auclast") |>
  left_join(select(pbp_drugs, Drug, Code), by = "Code") |>
  select(Drug, Cells, PBP, auclast) |>
  as.data.frame()

nrow(published)
#> [1] 180
Replicate published figures
Figure 3 / Figure S7 – time course of PBP binding
Replicates Figure 3 (and its full-y-axis companion Figure S7) of Lopez-Arguello 2023: model-predicted fraction of unbound PBPs in intact (solid) and lysed (dashed) cells over 60 min.
ggplot(sim_dense, aes(time, frac_unbound, colour = PBP, linetype = Cells)) +
  geom_line(linewidth = 0.6) +
  facet_wrap(~Drug, ncol = 5) +
  scale_linetype_manual(values = c(Intact = "solid", Lysed = "22")) +
  coord_cartesian(ylim = c(0, 1.05)) +
  labs(
    x = "Time (min)", y = "Fraction of unbound PBPs",
    title = "Model-predicted PBP binding in intact and lysed P. aeruginosa PAO1"
  ) +
  theme_bw() +
  theme(legend.position = "bottom")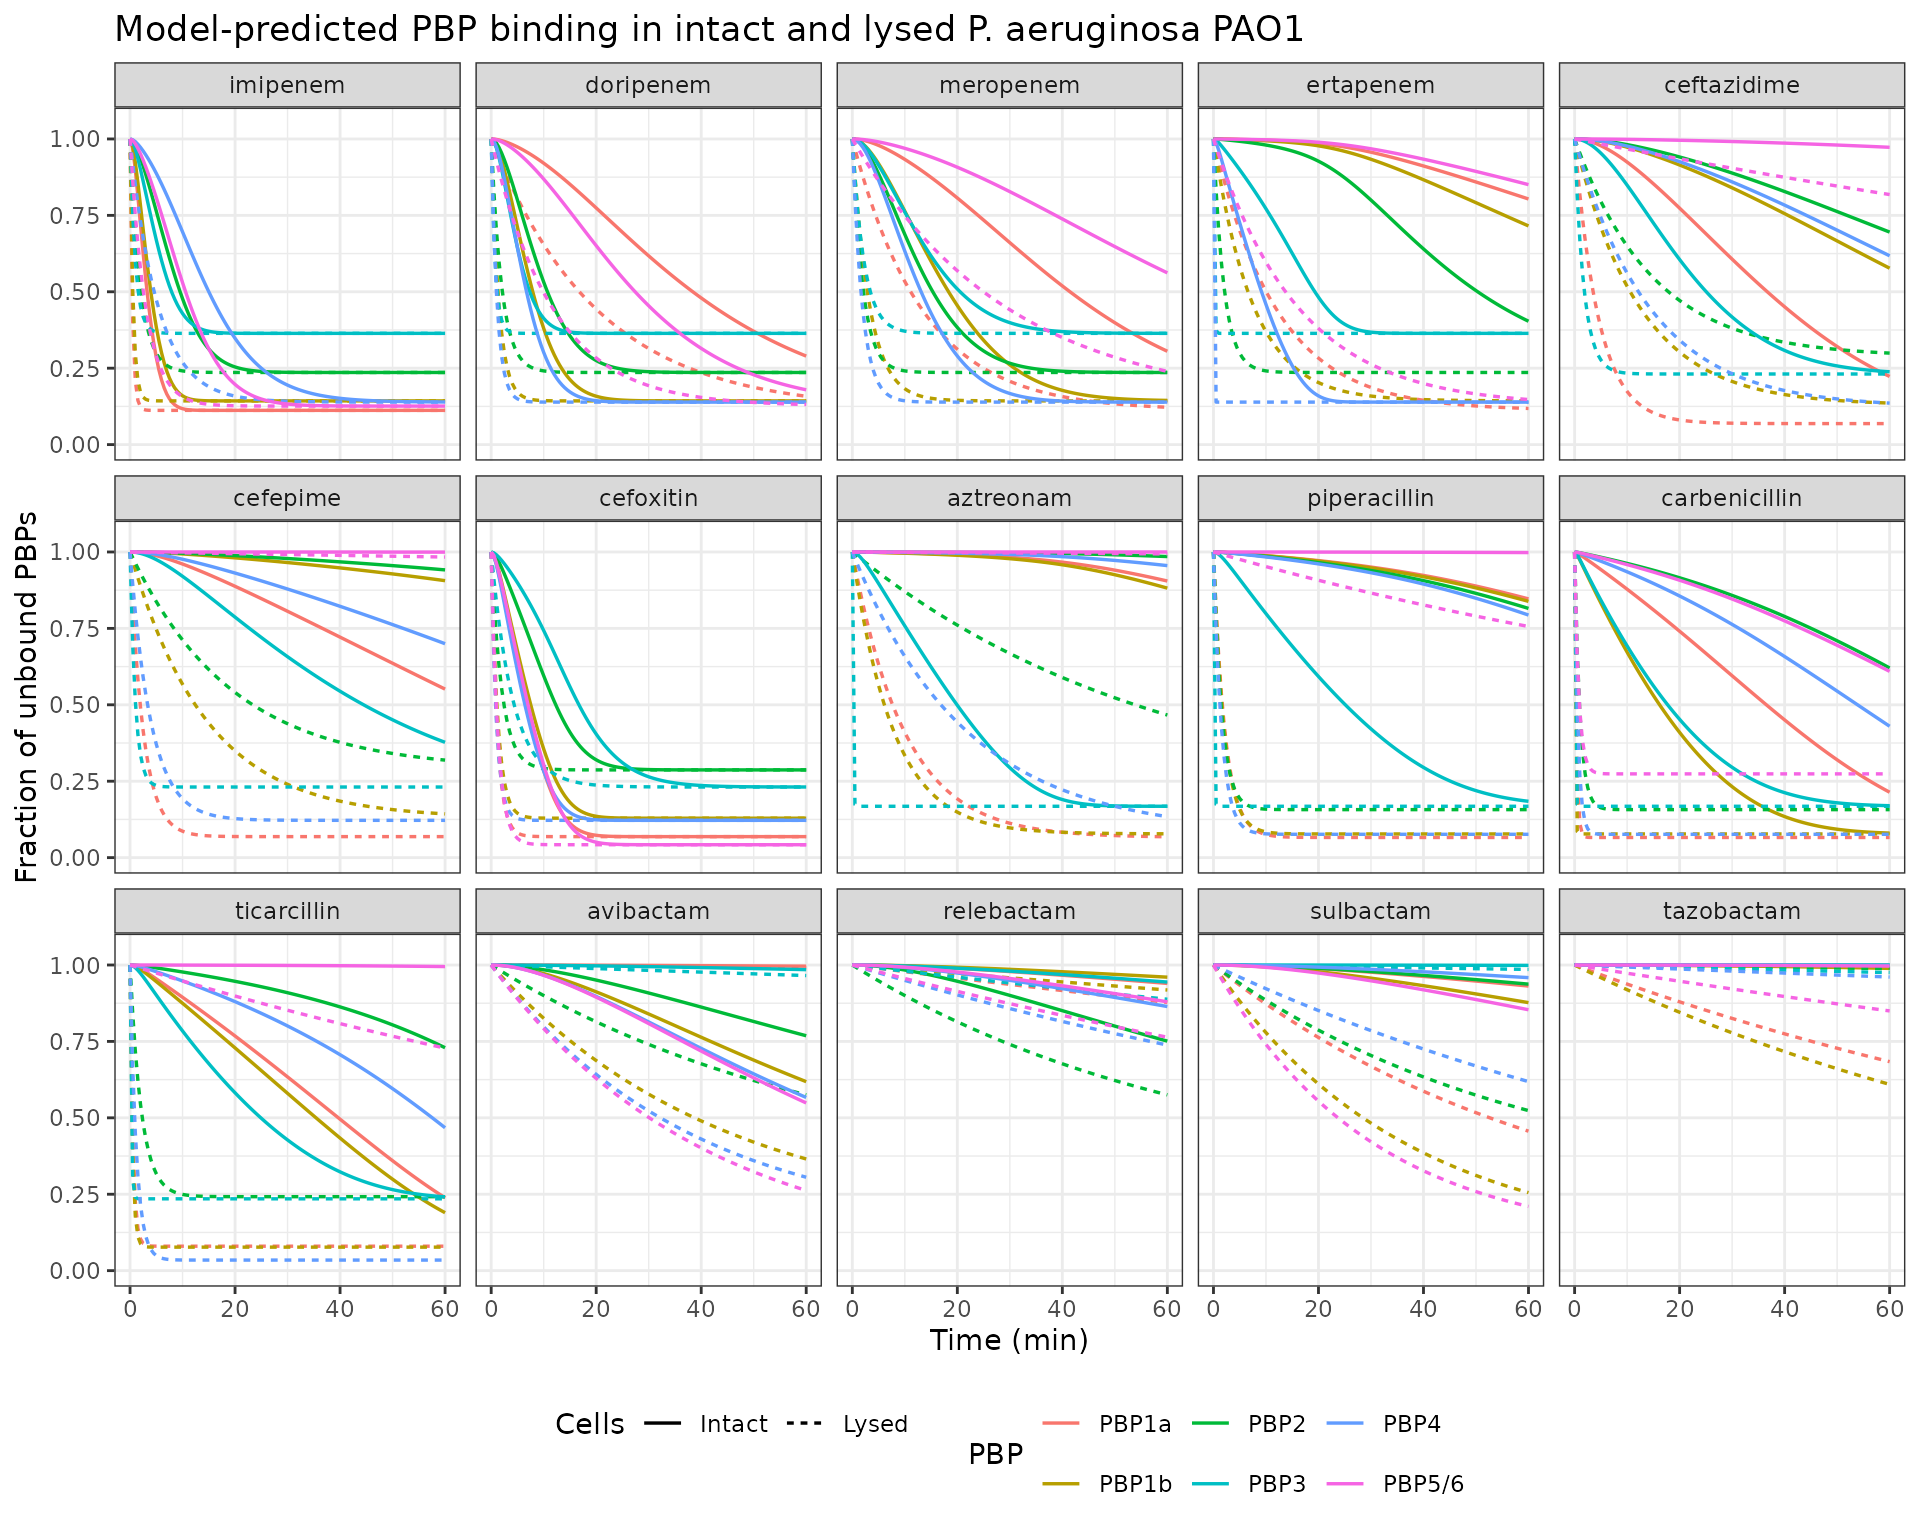
Imipenem and cefoxitin inactivate every PBP almost as fast in intact cells as in lysed cells; ertapenem, aztreonam and piperacillin show a large intact-vs-lysed gap, which is the signature of slow target-site penetration.
Figure 2 – difference between intact and lysed cells
Replicates Figure 2: delta PBP = (fraction unbound,
intact) - (fraction unbound, lysed) at each sampling time. A positive
value means less binding in intact cells, i.e. a penetration
penalty.
delta_pbp <- sim_obs |>
  filter(time > 0) |>
  select(Drug, Code, PBP, time, Cells, frac_unbound) |>
  pivot_wider(names_from = Cells, values_from = frac_unbound) |>
  mutate(delta = Intact - Lysed)

ggplot(delta_pbp, aes(factor(time), delta, fill = PBP)) +
  geom_col(position = position_dodge(width = 0.8), width = 0.75) +
  facet_wrap(~Drug, ncol = 5) +
  geom_hline(yintercept = 0, linewidth = 0.3) +
  labs(
    x = "Time (min)", y = "delta PBP (intact - lysed fraction unbound)",
    title = "Penetration penalty: model-predicted difference between assays"
  ) +
  theme_bw() +
  theme(legend.position = "bottom")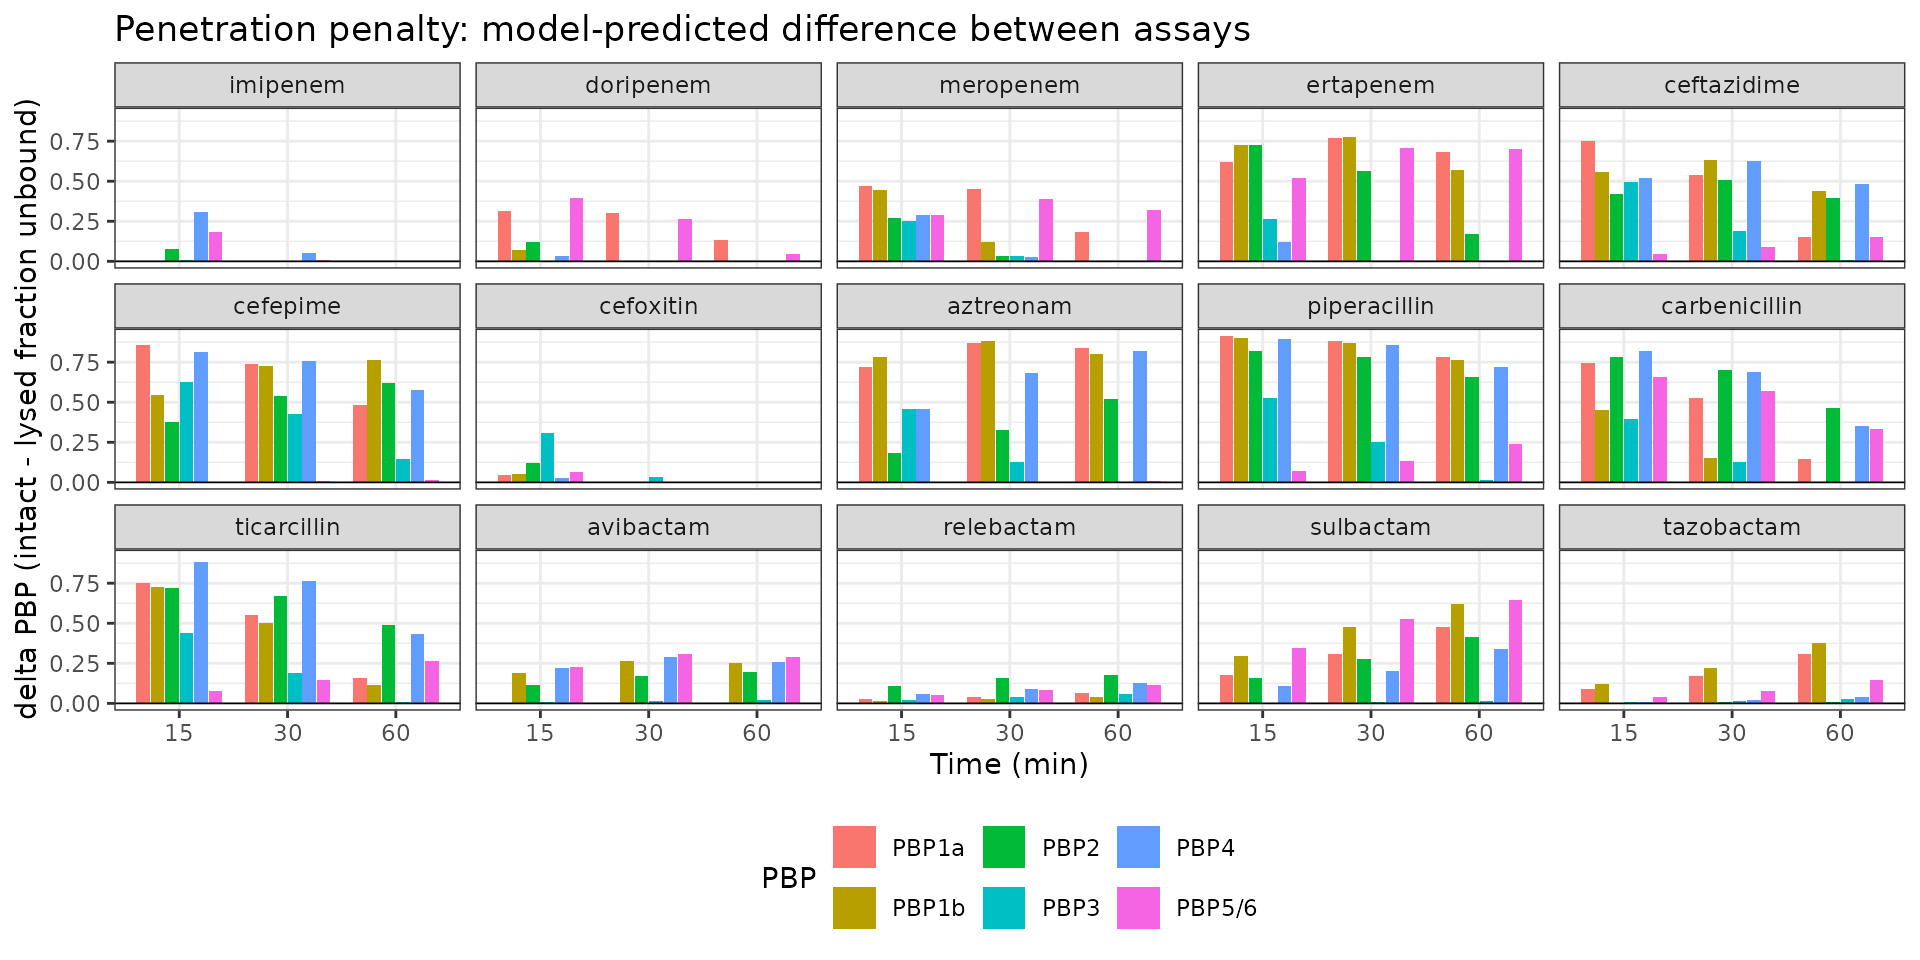
Figure 4 – PBP5/6 as a decoy target
Replicates Figure 4: the extent of PBP5/6 binding (mean fraction unbound over 0-60 min) against the rate of net influx and PBP access at 2x MIC. The paper restricts this plot to the beta-lactams, because the BLIs were studied at a fixed 4 mg/L rather than at 2x MIC.
# Rate_Influx/access at the studied concentration = scaled rate x C_drug
# (Table 1, last column). The scaled rate is read back out of each model's
# ini() block; the concentration is the CONC_<CODE>_MGL covariate value.
rate_influx <- lapply(seq_len(nrow(pbp_drugs)), function(i) {
  ini_tbl <- rxode2::rxode2(readModelDb(pbp_drugs$Model[i]))$iniDf
  scaled <- ini_tbl$est[match("rate_influx_scaled", ini_tbl$name)]
  tibble::tibble(
    Drug = pbp_drugs$Drug[i],
    rate_scaled = scaled,
    cdrug = pbp_drugs$Conc[i],
    rate_at_conc = scaled * pbp_drugs$Conc[i]
  )
}) |> bind_rows()

pbp56_extent <- sim_obs |>
  filter(PBP == "PBP5/6") |>
  group_by(Drug, Cells) |>
  # Linear trapezoidal AUC over 0-60 min divided by 60 = mean fraction unbound,
  # the same summary the paper computed in Phoenix WinNonlin.
  summarise(
    extent = sum(diff(time) * (head(frac_unbound, -1) + tail(frac_unbound, -1)) / 2) / 60,
    .groups = "drop"
  ) |>
  left_join(rate_influx, by = "Drug") |>
  left_join(select(pbp_drugs, Drug, Code, Class), by = "Drug") |>
  left_join(
    published |> filter(PBP == "PBP5/6") |> select(Drug, Cells, observed = auclast),
    by = c("Drug", "Cells")
  )

beta_lactams <- filter(pbp56_extent, !Class %in% c("BLI", "DBO-BLI"))

ggplot(beta_lactams, aes(rate_at_conc, extent)) +
  geom_smooth(method = "lm", se = FALSE, linewidth = 0.4, colour = "grey40") +
  geom_point(aes(y = observed, shape = "Published (Tables 2-3)"), size = 2.6) +
  geom_point(aes(shape = "Model-predicted"), size = 2.6) +
  geom_text(aes(label = Code), size = 3, vjust = -0.9) +
  scale_shape_manual(values = c("Model-predicted" = 16, "Published (Tables 2-3)" = 1)) +
  facet_wrap(~Cells) +
  scale_x_log10() +
  labs(
    x = "Rate of net influx and PBP access at 2x MIC (molecules/min, log scale)",
    y = "Extent of PBP5/6 binding\n(mean fraction unbound, 0-60 min)",
    shape = NULL,
    title = "PBP5/6 acts as a decoy target for rapidly penetrating beta-lactams"
  ) +
  theme_bw() +
  theme(legend.position = "bottom")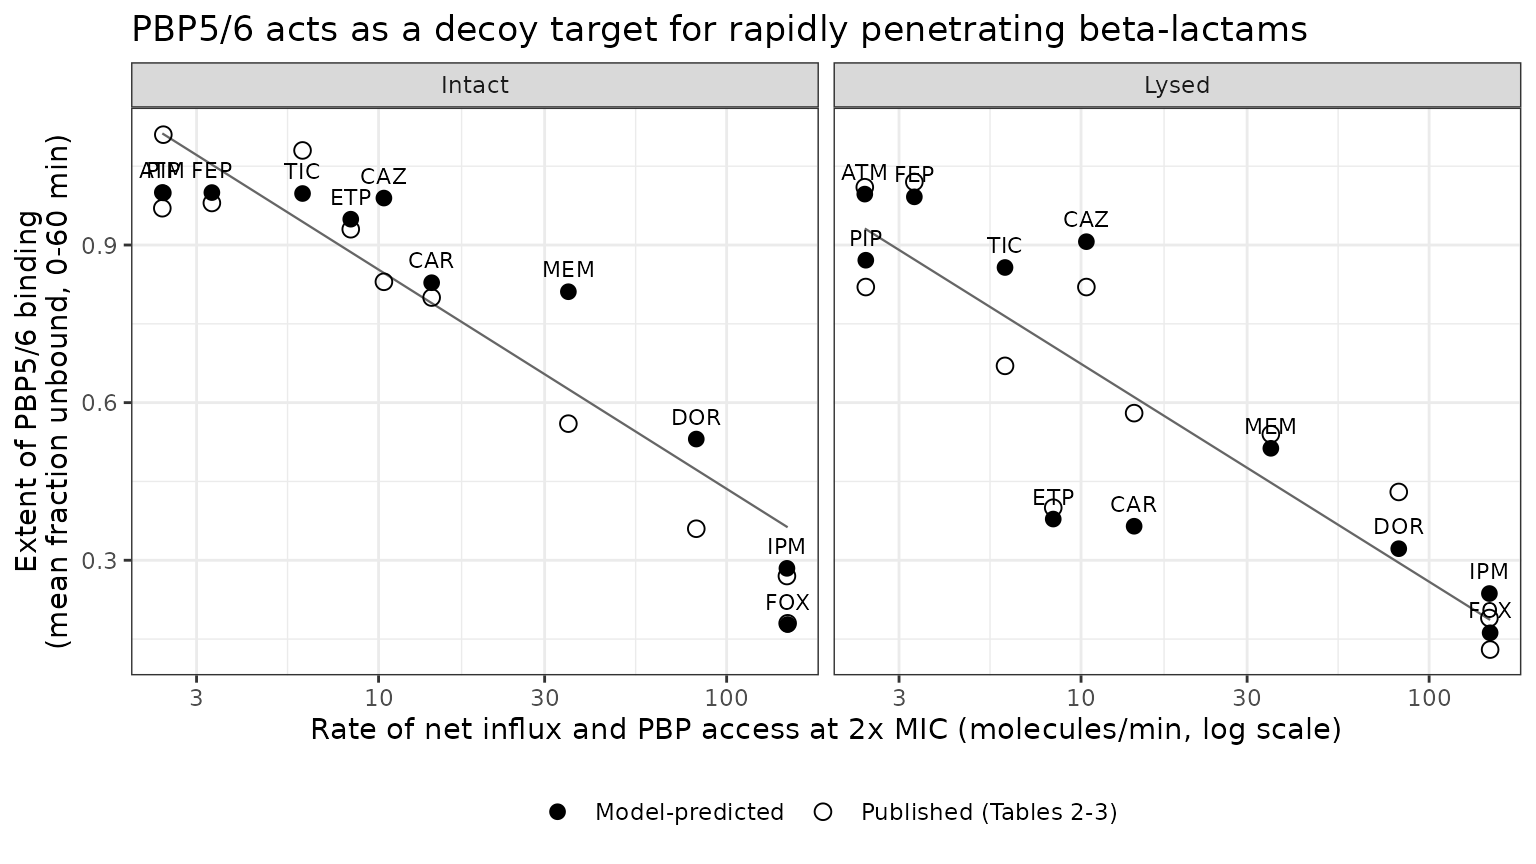
beta_lactams |>
  group_by(Cells) |>
  summarise(
    `r2 (model-predicted)` = cor(log10(rate_at_conc), extent)^2,
    `r2 (published extents)` = cor(log10(rate_at_conc), observed)^2,
    .groups = "drop"
  ) |>
knitr::kable(digits = 3, caption = "Correlation between log10(Rate_Influx/access at 2x MIC) and the extent of PBP5/6 binding, for the 11 beta-lactams. The paper reports r2 = 0.96 for this relationship (abstract; Fig. 4).")| Cells | r2 (model-predicted) | r2 (published extents) |
|---|---|---|
| Intact | 0.856 | 0.941 |
| Lysed | 0.750 | 0.785 |
Recomputing the correlation directly from the paper’s own Table 2 / Table 3 values gives r2 = 0.94 in intact cells, close to the reported 0.96 (the paper does not state the exact regression it fitted, so the small difference is not diagnostic). The reproduced model gives a slightly weaker but qualitatively identical relationship. In the lysed-cell panel ertapenem sits well off the line – the paper explicitly identifies it as the lysed-assay outlier, because only the intact-cell assay sees ertapenem’s poor penetration.
The drugs with the fastest net influx (imipenem, cefoxitin, doripenem) are the ones that inactivate PBP5/6, exactly the inverse relationship the paper describes: a beta-lactam that binds the highly expressed PBP5/6 must penetrate rapidly to still reach the essential PBPs.
PKNCA validation
The paper summarised PBP occupancy by the linear-trapezoidal AUC of the unbound fraction over the first 60 min, divided by 60 (Tables 2 and 3, “Average +/- SD of unbound PBPs over the first 60 min”). The same summary is computed here with PKNCA on the four published sampling times, so the trapezoidal approximation matches the paper’s.
nca_input <- sim_obs |>
  filter(!is.na(frac_unbound)) |>
  transmute(
    Drug = as.character(Drug), Cells, PBP,
    time = time, frac = frac_unbound
  ) |>
  as.data.frame()

conc_obj <- PKNCA::PKNCAconc(nca_input, frac ~ time | Drug + Cells + PBP)
nca_res <- PKNCA::pk.nca(
  PKNCA::PKNCAdata(
    conc_obj,
    intervals = data.frame(start = 0, end = 60, auclast = TRUE)
  )
)

nca_tbl <- as.data.frame(nca_res$result) |>
  filter(PPTESTCD == "auclast") |>
  # AUC0-60 / 60 min = the paper's mean fraction of unbound PBPs
  mutate(PPORRES = PPORRES / 60)

head(nca_tbl)
#>        Drug  Cells    PBP start end PPTESTCD   PPORRES exclude
#> 1 avibactam Intact  PBP1a     0  60  auclast 0.9984232    <NA>
#> 2 avibactam Intact  PBP1b     0  60  auclast 0.8274649    <NA>
#> 3 avibactam Intact   PBP2     0  60  auclast 0.8989437    <NA>
#> 4 avibactam Intact   PBP3     0  60  auclast 0.9937489    <NA>
#> 5 avibactam Intact   PBP4     0  60  auclast 0.8013095    <NA>
#> 6 avibactam Intact PBP5/6     0  60  auclast 0.7940031    <NA>
Comparison against the published NCA
Reference values are the Table 2 / Table 3 extents transcribed above.
comparison <- nlmixr2lib::ncaComparisonTable(
  simulated = nca_tbl,
  reference = published,
  by = c("Drug", "Cells", "PBP"),
  params = "auclast",
  units = c(auclast = "fraction unbound, mean over 0-60 min"),
  label_first_column = "NCA parameter"
)

knitr::kable(
  comparison, digits = 3,
  caption = "Model-predicted vs published extent of PBP occupancy for all 15 drugs, 6 PBPs and 2 assays (Tables 2 and 3)."
)| NCA parameter | Drug | Cells | PBP | Reference | Simulated | % diff |
|---|---|---|---|---|---|---|
| AUClast (fraction unbound, mean over 0-60 min) | imipenem | Intact | PBP1a | 0.29 | 0.185 | -36.1%* |
| AUClast (fraction unbound, mean over 0-60 min) | imipenem | Intact | PBP1b | 0.3 | 0.218 | -27.5%* |
| AUClast (fraction unbound, mean over 0-60 min) | imipenem | Intact | PBP2 | 0.38 | 0.334 | -12.1% |
| AUClast (fraction unbound, mean over 0-60 min) | imipenem | Intact | PBP3 | 0.35 | 0.432 | +23.5%* |
| AUClast (fraction unbound, mean over 0-60 min) | imipenem | Intact | PBP4 | 0.44 | 0.344 | -21.8%* |
| AUClast (fraction unbound, mean over 0-60 min) | imipenem | Intact | PBP5/6 | 0.27 | 0.265 | -1.8% |
| AUClast (fraction unbound, mean over 0-60 min) | imipenem | Lysed | PBP1a | 0.19 | 0.185 | -2.4% |
| AUClast (fraction unbound, mean over 0-60 min) | imipenem | Lysed | PBP1b | 0.18 | 0.217 | +20.8%* |
| AUClast (fraction unbound, mean over 0-60 min) | imipenem | Lysed | PBP2 | 0.37 | 0.309 | -16.4% |
| AUClast (fraction unbound, mean over 0-60 min) | imipenem | Lysed | PBP3 | 0.52 | 0.43 | -17.2% |
| AUClast (fraction unbound, mean over 0-60 min) | imipenem | Lysed | PBP4 | 0.21 | 0.233 | +11.1% |
| AUClast (fraction unbound, mean over 0-60 min) | imipenem | Lysed | PBP5/6 | 0.19 | 0.202 | +6.5% |
| AUClast (fraction unbound, mean over 0-60 min) | doripenem | Intact | PBP1a | 0.67 | 0.63 | -6.0% |
| AUClast (fraction unbound, mean over 0-60 min) | doripenem | Intact | PBP1b | 0.33 | 0.243 | -26.5%* |
| AUClast (fraction unbound, mean over 0-60 min) | doripenem | Intact | PBP2 | 0.3 | 0.348 | +15.9% |
| AUClast (fraction unbound, mean over 0-60 min) | doripenem | Intact | PBP3 | 0.38 | 0.432 | +13.6% |
| AUClast (fraction unbound, mean over 0-60 min) | doripenem | Intact | PBP4 | 0.22 | 0.226 | +2.7% |
| AUClast (fraction unbound, mean over 0-60 min) | doripenem | Intact | PBP5/6 | 0.36 | 0.516 | +43.2%* |
| AUClast (fraction unbound, mean over 0-60 min) | doripenem | Lysed | PBP1a | 0.26 | 0.404 | +55.2%* |
| AUClast (fraction unbound, mean over 0-60 min) | doripenem | Lysed | PBP1b | 0.26 | 0.217 | -16.4% |
| AUClast (fraction unbound, mean over 0-60 min) | doripenem | Lysed | PBP2 | 0.34 | 0.309 | -9.0% |
| AUClast (fraction unbound, mean over 0-60 min) | doripenem | Lysed | PBP3 | 0.47 | 0.43 | -8.4% |
| AUClast (fraction unbound, mean over 0-60 min) | doripenem | Lysed | PBP4 | 0.23 | 0.213 | -7.2% |
| AUClast (fraction unbound, mean over 0-60 min) | doripenem | Lysed | PBP5/6 | 0.43 | 0.306 | -28.9%* |
| AUClast (fraction unbound, mean over 0-60 min) | meropenem | Intact | PBP1a | 0.68 | 0.655 | -3.7% |
| AUClast (fraction unbound, mean over 0-60 min) | meropenem | Intact | PBP1b | 0.37 | 0.396 | +7.0% |
| AUClast (fraction unbound, mean over 0-60 min) | meropenem | Intact | PBP2 | 0.31 | 0.401 | +29.4%* |
| AUClast (fraction unbound, mean over 0-60 min) | meropenem | Intact | PBP3 | 0.44 | 0.514 | +16.8% |
| AUClast (fraction unbound, mean over 0-60 min) | meropenem | Intact | PBP4 | 0.38 | 0.315 | -17.2% |
| AUClast (fraction unbound, mean over 0-60 min) | meropenem | Intact | PBP5/6 | 0.56 | 0.806 | +44.0%* |
| AUClast (fraction unbound, mean over 0-60 min) | meropenem | Lysed | PBP1a | 0.29 | 0.318 | +9.7% |
| AUClast (fraction unbound, mean over 0-60 min) | meropenem | Lysed | PBP1b | 0.21 | 0.221 | +5.1% |
| AUClast (fraction unbound, mean over 0-60 min) | meropenem | Lysed | PBP2 | 0.37 | 0.309 | -16.4% |
| AUClast (fraction unbound, mean over 0-60 min) | meropenem | Lysed | PBP3 | 0.57 | 0.431 | -24.5%* |
| AUClast (fraction unbound, mean over 0-60 min) | meropenem | Lysed | PBP4 | 0.24 | 0.213 | -11.1% |
| AUClast (fraction unbound, mean over 0-60 min) | meropenem | Lysed | PBP5/6 | 0.54 | 0.503 | -6.8% |
| AUClast (fraction unbound, mean over 0-60 min) | ertapenem | Intact | PBP1a | 0.87 | 0.932 | +7.1% |
| AUClast (fraction unbound, mean over 0-60 min) | ertapenem | Intact | PBP1b | 0.79 | 0.898 | +13.7% |
| AUClast (fraction unbound, mean over 0-60 min) | ertapenem | Intact | PBP2 | 0.63 | 0.754 | +19.7% |
| AUClast (fraction unbound, mean over 0-60 min) | ertapenem | Intact | PBP3 | 0.47 | 0.504 | +7.2% |
| AUClast (fraction unbound, mean over 0-60 min) | ertapenem | Intact | PBP4 | 0.33 | 0.255 | -22.8%* |
| AUClast (fraction unbound, mean over 0-60 min) | ertapenem | Intact | PBP5/6 | 0.93 | 0.949 | +2.0% |
| AUClast (fraction unbound, mean over 0-60 min) | ertapenem | Lysed | PBP1a | 0.31 | 0.3 | -3.1% |
| AUClast (fraction unbound, mean over 0-60 min) | ertapenem | Lysed | PBP1b | 0.27 | 0.264 | -2.2% |
| AUClast (fraction unbound, mean over 0-60 min) | ertapenem | Lysed | PBP2 | 0.35 | 0.309 | -11.6% |
| AUClast (fraction unbound, mean over 0-60 min) | ertapenem | Lysed | PBP3 | 0.35 | 0.43 | +23.0%* |
| AUClast (fraction unbound, mean over 0-60 min) | ertapenem | Lysed | PBP4 | 0.2 | 0.213 | +6.7% |
| AUClast (fraction unbound, mean over 0-60 min) | ertapenem | Lysed | PBP5/6 | 0.4 | 0.365 | -8.8% |
| AUClast (fraction unbound, mean over 0-60 min) | ceftazidime | Intact | PBP1a | 0.61 | 0.604 | -1.0% |
| AUClast (fraction unbound, mean over 0-60 min) | ceftazidime | Intact | PBP1b | 0.87 | 0.817 | -6.1% |
| AUClast (fraction unbound, mean over 0-60 min) | ceftazidime | Intact | PBP2 | 0.85 | 0.871 | +2.4% |
| AUClast (fraction unbound, mean over 0-60 min) | ceftazidime | Intact | PBP3 | 0.51 | 0.513 | +0.6% |
| AUClast (fraction unbound, mean over 0-60 min) | ceftazidime | Intact | PBP4 | 0.8 | 0.837 | +4.6% |
| AUClast (fraction unbound, mean over 0-60 min) | ceftazidime | Intact | PBP5/6 | 0.83 | 0.989 | +19.2% |
| AUClast (fraction unbound, mean over 0-60 min) | ceftazidime | Lysed | PBP1a | 0.17 | 0.155 | -8.7% |
| AUClast (fraction unbound, mean over 0-60 min) | ceftazidime | Lysed | PBP1b | 0.36 | 0.318 | -11.6% |
| AUClast (fraction unbound, mean over 0-60 min) | ceftazidime | Lysed | PBP2 | 0.57 | 0.471 | -17.3% |
| AUClast (fraction unbound, mean over 0-60 min) | ceftazidime | Lysed | PBP3 | 0.21 | 0.305 | +45.0%* |
| AUClast (fraction unbound, mean over 0-60 min) | ceftazidime | Lysed | PBP4 | 0.35 | 0.339 | -3.0% |
| AUClast (fraction unbound, mean over 0-60 min) | ceftazidime | Lysed | PBP5/6 | 0.82 | 0.906 | +10.5% |
| AUClast (fraction unbound, mean over 0-60 min) | cefepime | Intact | PBP1a | 0.61 | 0.792 | +29.9%* |
| AUClast (fraction unbound, mean over 0-60 min) | cefepime | Intact | PBP1b | 0.94 | 0.96 | +2.2% |
| AUClast (fraction unbound, mean over 0-60 min) | cefepime | Intact | PBP2 | 0.96 | 0.975 | +1.6% |
| AUClast (fraction unbound, mean over 0-60 min) | cefepime | Intact | PBP3 | 0.6 | 0.672 | +11.9% |
| AUClast (fraction unbound, mean over 0-60 min) | cefepime | Intact | PBP4 | 0.69 | 0.866 | +25.6%* |
| AUClast (fraction unbound, mean over 0-60 min) | cefepime | Intact | PBP5/6 | 0.98 | 1 | +2.0% |
| AUClast (fraction unbound, mean over 0-60 min) | cefepime | Lysed | PBP1a | 0.15 | 0.14 | -6.9% |
| AUClast (fraction unbound, mean over 0-60 min) | cefepime | Lysed | PBP1b | 0.34 | 0.347 | +2.0% |
| AUClast (fraction unbound, mean over 0-60 min) | cefepime | Lysed | PBP2 | 0.47 | 0.516 | +9.8% |
| AUClast (fraction unbound, mean over 0-60 min) | cefepime | Lysed | PBP3 | 0.14 | 0.304 | +117.5%* |
| AUClast (fraction unbound, mean over 0-60 min) | cefepime | Lysed | PBP4 | 0.17 | 0.204 | +20.0%* |
| AUClast (fraction unbound, mean over 0-60 min) | cefepime | Lysed | PBP5/6 | 1.02 | 0.992 | -2.8% |
| AUClast (fraction unbound, mean over 0-60 min) | cefoxitin | Intact | PBP1a | 0.24 | 0.158 | -34.2%* |
| AUClast (fraction unbound, mean over 0-60 min) | cefoxitin | Intact | PBP1b | 0.38 | 0.223 | -41.4%* |
| AUClast (fraction unbound, mean over 0-60 min) | cefoxitin | Intact | PBP2 | 0.45 | 0.396 | -12.1% |
| AUClast (fraction unbound, mean over 0-60 min) | cefoxitin | Intact | PBP3 | 0.47 | 0.412 | -12.4% |
| AUClast (fraction unbound, mean over 0-60 min) | cefoxitin | Intact | PBP4 | 0.27 | 0.206 | -23.8%* |
| AUClast (fraction unbound, mean over 0-60 min) | cefoxitin | Intact | PBP5/6 | 0.18 | 0.138 | -23.5%* |
| AUClast (fraction unbound, mean over 0-60 min) | cefoxitin | Lysed | PBP1a | 0.14 | 0.138 | -1.1% |
| AUClast (fraction unbound, mean over 0-60 min) | cefoxitin | Lysed | PBP1b | 0.16 | 0.203 | +26.9%* |
| AUClast (fraction unbound, mean over 0-60 min) | cefoxitin | Lysed | PBP2 | 0.37 | 0.358 | -3.2% |
| AUClast (fraction unbound, mean over 0-60 min) | cefoxitin | Lysed | PBP3 | 0.43 | 0.312 | -27.5%* |
| AUClast (fraction unbound, mean over 0-60 min) | cefoxitin | Lysed | PBP4 | 0.19 | 0.196 | +3.1% |
| AUClast (fraction unbound, mean over 0-60 min) | cefoxitin | Lysed | PBP5/6 | 0.13 | 0.107 | -17.5% |
| AUClast (fraction unbound, mean over 0-60 min) | aztreonam | Intact | PBP1a | 1.02 | 0.968 | -5.1% |
| AUClast (fraction unbound, mean over 0-60 min) | aztreonam | Intact | PBP1b | 0.94 | 0.96 | +2.1% |
| AUClast (fraction unbound, mean over 0-60 min) | aztreonam | Intact | PBP2 | 1.02 | 0.995 | -2.4% |
| AUClast (fraction unbound, mean over 0-60 min) | aztreonam | Intact | PBP3 | 0.39 | 0.422 | +8.1% |
| AUClast (fraction unbound, mean over 0-60 min) | aztreonam | Intact | PBP4 | 1.01 | 0.985 | -2.5% |
| AUClast (fraction unbound, mean over 0-60 min) | aztreonam | Intact | PBP5/6 | 0.97 | 1 | +3.1% |
| AUClast (fraction unbound, mean over 0-60 min) | aztreonam | Lysed | PBP1a | 0.26 | 0.23 | -11.6% |
| AUClast (fraction unbound, mean over 0-60 min) | aztreonam | Lysed | PBP1b | 0.24 | 0.208 | -13.5% |
| AUClast (fraction unbound, mean over 0-60 min) | aztreonam | Lysed | PBP2 | 0.64 | 0.691 | +8.0% |
| AUClast (fraction unbound, mean over 0-60 min) | aztreonam | Lysed | PBP3 | 0.23 | 0.243 | +5.6% |
| AUClast (fraction unbound, mean over 0-60 min) | aztreonam | Lysed | PBP4 | 0.36 | 0.394 | +9.4% |
| AUClast (fraction unbound, mean over 0-60 min) | aztreonam | Lysed | PBP5/6 | 1.01 | 0.997 | -1.3% |
| AUClast (fraction unbound, mean over 0-60 min) | piperacillin | Intact | PBP1a | 0.79 | 0.938 | +18.7% |
| AUClast (fraction unbound, mean over 0-60 min) | piperacillin | Intact | PBP1b | 0.89 | 0.934 | +5.0% |
| AUClast (fraction unbound, mean over 0-60 min) | piperacillin | Intact | PBP2 | 0.91 | 0.924 | +1.6% |
| AUClast (fraction unbound, mean over 0-60 min) | piperacillin | Intact | PBP3 | 0.48 | 0.489 | +1.8% |
| AUClast (fraction unbound, mean over 0-60 min) | piperacillin | Intact | PBP4 | 0.69 | 0.915 | +32.6%* |
| AUClast (fraction unbound, mean over 0-60 min) | piperacillin | Intact | PBP5/6 | 1.11 | 0.999 | -10.0% |
| AUClast (fraction unbound, mean over 0-60 min) | piperacillin | Lysed | PBP1a | 0.14 | 0.136 | -3.0% |
| AUClast (fraction unbound, mean over 0-60 min) | piperacillin | Lysed | PBP1b | 0.14 | 0.149 | +6.1% |
| AUClast (fraction unbound, mean over 0-60 min) | piperacillin | Lysed | PBP2 | 0.18 | 0.232 | +28.7%* |
| AUClast (fraction unbound, mean over 0-60 min) | piperacillin | Lysed | PBP3 | 0.23 | 0.243 | +5.5% |
| AUClast (fraction unbound, mean over 0-60 min) | piperacillin | Lysed | PBP4 | 0.14 | 0.147 | +5.0% |
| AUClast (fraction unbound, mean over 0-60 min) | piperacillin | Lysed | PBP5/6 | 0.82 | 0.87 | +6.1% |
| AUClast (fraction unbound, mean over 0-60 min) | carbenicillin | Intact | PBP1a | 0.41 | 0.586 | +43.0%* |
| AUClast (fraction unbound, mean over 0-60 min) | carbenicillin | Intact | PBP1b | 0.36 | 0.347 | -3.6% |
| AUClast (fraction unbound, mean over 0-60 min) | carbenicillin | Intact | PBP2 | 0.82 | 0.833 | +1.6% |
| AUClast (fraction unbound, mean over 0-60 min) | carbenicillin | Intact | PBP3 | 0.39 | 0.407 | +4.4% |
| AUClast (fraction unbound, mean over 0-60 min) | carbenicillin | Intact | PBP4 | 0.49 | 0.734 | +49.9%* |
| AUClast (fraction unbound, mean over 0-60 min) | carbenicillin | Intact | PBP5/6 | 0.8 | 0.825 | +3.1% |
| AUClast (fraction unbound, mean over 0-60 min) | carbenicillin | Lysed | PBP1a | 0.13 | 0.135 | +4.1% |
| AUClast (fraction unbound, mean over 0-60 min) | carbenicillin | Lysed | PBP1b | 0.15 | 0.148 | -1.1% |
| AUClast (fraction unbound, mean over 0-60 min) | carbenicillin | Lysed | PBP2 | 0.2 | 0.232 | +15.8% |
| AUClast (fraction unbound, mean over 0-60 min) | carbenicillin | Lysed | PBP3 | 0.17 | 0.243 | +42.7%* |
| AUClast (fraction unbound, mean over 0-60 min) | carbenicillin | Lysed | PBP4 | 0.17 | 0.147 | -13.5% |
| AUClast (fraction unbound, mean over 0-60 min) | carbenicillin | Lysed | PBP5/6 | 0.58 | 0.345 | -40.5%* |
| AUClast (fraction unbound, mean over 0-60 min) | ticarcillin | Intact | PBP1a | 0.48 | 0.613 | +27.6%* |
| AUClast (fraction unbound, mean over 0-60 min) | ticarcillin | Intact | PBP1b | 0.43 | 0.57 | +32.6%* |
| AUClast (fraction unbound, mean over 0-60 min) | ticarcillin | Intact | PBP2 | 0.77 | 0.887 | +15.2% |
| AUClast (fraction unbound, mean over 0-60 min) | ticarcillin | Intact | PBP3 | 0.48 | 0.506 | +5.3% |
| AUClast (fraction unbound, mean over 0-60 min) | ticarcillin | Intact | PBP4 | 0.59 | 0.763 | +29.3%* |
| AUClast (fraction unbound, mean over 0-60 min) | ticarcillin | Intact | PBP5/6 | 1.08 | 0.998 | -7.6% |
| AUClast (fraction unbound, mean over 0-60 min) | ticarcillin | Lysed | PBP1a | 0.1 | 0.151 | +51.1%* |
| AUClast (fraction unbound, mean over 0-60 min) | ticarcillin | Lysed | PBP1b | 0.14 | 0.148 | +5.4% |
| AUClast (fraction unbound, mean over 0-60 min) | ticarcillin | Lysed | PBP2 | 0.32 | 0.315 | -1.5% |
| AUClast (fraction unbound, mean over 0-60 min) | ticarcillin | Lysed | PBP3 | 0.17 | 0.308 | +81.4%* |
| AUClast (fraction unbound, mean over 0-60 min) | ticarcillin | Lysed | PBP4 | 0.15 | 0.0977 | -34.9%* |
| AUClast (fraction unbound, mean over 0-60 min) | ticarcillin | Lysed | PBP5/6 | 0.67 | 0.856 | +27.8%* |
| AUClast (fraction unbound, mean over 0-60 min) | avibactam | Intact | PBP1a | 0.93 | 0.998 | +7.4% |
| AUClast (fraction unbound, mean over 0-60 min) | avibactam | Intact | PBP1b | 0.78 | 0.827 | +6.1% |
| AUClast (fraction unbound, mean over 0-60 min) | avibactam | Intact | PBP2 | 0.8 | 0.899 | +12.4% |
| AUClast (fraction unbound, mean over 0-60 min) | avibactam | Intact | PBP3 | 0.89 | 0.994 | +11.7% |
| AUClast (fraction unbound, mean over 0-60 min) | avibactam | Intact | PBP4 | 0.75 | 0.801 | +6.8% |
| AUClast (fraction unbound, mean over 0-60 min) | avibactam | Intact | PBP5/6 | 0.9 | 0.794 | -11.8% |
| AUClast (fraction unbound, mean over 0-60 min) | avibactam | Lysed | PBP1a | 1.07 | 0.996 | -7.0% |
| AUClast (fraction unbound, mean over 0-60 min) | avibactam | Lysed | PBP1b | 0.64 | 0.615 | -4.0% |
| AUClast (fraction unbound, mean over 0-60 min) | avibactam | Lysed | PBP2 | 0.79 | 0.758 | -4.1% |
| AUClast (fraction unbound, mean over 0-60 min) | avibactam | Lysed | PBP3 | 1.07 | 0.983 | -8.2% |
| AUClast (fraction unbound, mean over 0-60 min) | avibactam | Lysed | PBP4 | 0.61 | 0.568 | -6.9% |
| AUClast (fraction unbound, mean over 0-60 min) | avibactam | Lysed | PBP5/6 | 0.49 | 0.545 | +11.2% |
| AUClast (fraction unbound, mean over 0-60 min) | relebactam | Intact | PBP1a | 0.87 | 0.975 | +12.1% |
| AUClast (fraction unbound, mean over 0-60 min) | relebactam | Intact | PBP1b | 0.84 | 0.984 | +17.1% |
| AUClast (fraction unbound, mean over 0-60 min) | relebactam | Intact | PBP2 | 0.81 | 0.891 | +10.0% |
| AUClast (fraction unbound, mean over 0-60 min) | relebactam | Intact | PBP3 | 0.81 | 0.977 | +20.6%* |
| AUClast (fraction unbound, mean over 0-60 min) | relebactam | Intact | PBP4 | 0.84 | 0.943 | +12.2% |
| AUClast (fraction unbound, mean over 0-60 min) | relebactam | Intact | PBP5/6 | 0.9 | 0.95 | +5.5% |
| AUClast (fraction unbound, mean over 0-60 min) | relebactam | Lysed | PBP1a | 0.95 | 0.937 | -1.3% |
| AUClast (fraction unbound, mean over 0-60 min) | relebactam | Lysed | PBP1b | 0.98 | 0.958 | -2.2% |
| AUClast (fraction unbound, mean over 0-60 min) | relebactam | Lysed | PBP2 | 0.88 | 0.758 | -13.9% |
| AUClast (fraction unbound, mean over 0-60 min) | relebactam | Lysed | PBP3 | 1.05 | 0.942 | -10.3% |
| AUClast (fraction unbound, mean over 0-60 min) | relebactam | Lysed | PBP4 | 0.82 | 0.861 | +5.1% |
| AUClast (fraction unbound, mean over 0-60 min) | relebactam | Lysed | PBP5/6 | 0.86 | 0.876 | +1.9% |
| AUClast (fraction unbound, mean over 0-60 min) | sulbactam | Intact | PBP1a | 0.88 | 0.972 | +10.5% |
| AUClast (fraction unbound, mean over 0-60 min) | sulbactam | Intact | PBP1b | 0.75 | 0.949 | +26.6%* |
| AUClast (fraction unbound, mean over 0-60 min) | sulbactam | Intact | PBP2 | 0.97 | 0.975 | +0.5% |
| AUClast (fraction unbound, mean over 0-60 min) | sulbactam | Intact | PBP3 | 0.98 | 0.999 | +2.0% |
| AUClast (fraction unbound, mean over 0-60 min) | sulbactam | Intact | PBP4 | 0.74 | 0.983 | +32.9%* |
| AUClast (fraction unbound, mean over 0-60 min) | sulbactam | Intact | PBP5/6 | 0.84 | 0.94 | +11.9% |
| AUClast (fraction unbound, mean over 0-60 min) | sulbactam | Lysed | PBP1a | 0.68 | 0.689 | +1.3% |
| AUClast (fraction unbound, mean over 0-60 min) | sulbactam | Lysed | PBP1b | 0.48 | 0.532 | +10.9% |
| AUClast (fraction unbound, mean over 0-60 min) | sulbactam | Lysed | PBP2 | 0.79 | 0.725 | -8.2% |
| AUClast (fraction unbound, mean over 0-60 min) | sulbactam | Lysed | PBP3 | 1.09 | 0.993 | -8.9% |
| AUClast (fraction unbound, mean over 0-60 min) | sulbactam | Lysed | PBP4 | 0.7 | 0.793 | +13.4% |
| AUClast (fraction unbound, mean over 0-60 min) | sulbactam | Lysed | PBP5/6 | 0.46 | 0.484 | +5.3% |
| AUClast (fraction unbound, mean over 0-60 min) | tazobactam | Intact | PBP1a | 0.98 | 0.997 | +1.7% |
| AUClast (fraction unbound, mean over 0-60 min) | tazobactam | Intact | PBP1b | 1.05 | 0.996 | -5.2% |
| AUClast (fraction unbound, mean over 0-60 min) | tazobactam | Intact | PBP2 | 1.04 | 1 | -3.9% |
| AUClast (fraction unbound, mean over 0-60 min) | tazobactam | Intact | PBP3 | 1.1 | 1 | -9.1% |
| AUClast (fraction unbound, mean over 0-60 min) | tazobactam | Intact | PBP4 | 1.06 | 1 | -5.7% |
| AUClast (fraction unbound, mean over 0-60 min) | tazobactam | Intact | PBP5/6 | 1.14 | 0.999 | -12.4% |
| AUClast (fraction unbound, mean over 0-60 min) | tazobactam | Lysed | PBP1a | 0.79 | 0.831 | +5.2% |
| AUClast (fraction unbound, mean over 0-60 min) | tazobactam | Lysed | PBP1b | 0.73 | 0.787 | +7.8% |
| AUClast (fraction unbound, mean over 0-60 min) | tazobactam | Lysed | PBP2 | 1.1 | 0.994 | -9.6% |
| AUClast (fraction unbound, mean over 0-60 min) | tazobactam | Lysed | PBP3 | 1.05 | 0.987 | -6.0% |
| AUClast (fraction unbound, mean over 0-60 min) | tazobactam | Lysed | PBP4 | 0.97 | 0.98 | +1.0% |
| AUClast (fraction unbound, mean over 0-60 min) | tazobactam | Lysed | PBP5/6 | 0.9 | 0.923 | +2.5% |
attr(comparison, "footnote")
#> [1] "* differs from reference by more than ±20%."
ncaComparisonTable() returns formatted character
columns, so the numeric agreement is summarised from the underlying
values.
agreement <- nca_tbl |>
  select(Drug, Cells, PBP, Simulated = PPORRES) |>
  inner_join(rename(published, Reference = auclast), by = c("Drug", "Cells", "PBP")) |>
  mutate(abs_diff = abs(Simulated - Reference))

agreement |>
  summarise(
    n = dplyr::n(),
    `median |difference|` = median(abs_diff),
    `90th pctile |difference|` = quantile(abs_diff, 0.9),
    `max |difference|` = max(abs_diff),
    `n within 0.10` = sum(abs_diff <= 0.10),
    `n within 0.20` = sum(abs_diff <= 0.20)
  ) |>
knitr::kable(digits = 3, caption = "Agreement between the reproduced model and the published extent-of-binding values, on the fraction-unbound scale (range 0-1).")| n | median |difference| | 90th pctile |difference| | max |difference| | n within 0.10 | n within 0.20 |
|---|---|---|---|---|---|
| 180 | 0.047 | 0.144 | 0.246 | 141 | 175 |
The ten largest absolute deviations:
agreement |>
  arrange(desc(abs_diff)) |>
  head(10) |>
knitr::kable(digits = 3, caption = "Largest deviations between the reproduced model and Tables 2-3.")| Drug | Cells | PBP | Simulated | Reference | abs_diff |
|---|---|---|---|---|---|
| meropenem | Intact | PBP5/6 | 0.806 | 0.56 | 0.246 |
| carbenicillin | Intact | PBP4 | 0.734 | 0.49 | 0.244 |
| sulbactam | Intact | PBP4 | 0.983 | 0.74 | 0.243 |
| carbenicillin | Lysed | PBP5/6 | 0.345 | 0.58 | 0.235 |
| piperacillin | Intact | PBP4 | 0.915 | 0.69 | 0.225 |
| sulbactam | Intact | PBP1b | 0.949 | 0.75 | 0.199 |
| ticarcillin | Lysed | PBP5/6 | 0.856 | 0.67 | 0.186 |
| cefepime | Intact | PBP1a | 0.792 | 0.61 | 0.182 |
| cefepime | Intact | PBP4 | 0.866 | 0.69 | 0.176 |
| carbenicillin | Intact | PBP1a | 0.586 | 0.41 | 0.176 |
Across all 180 drug x PBP x assay combinations the median absolute deviation from the published extents is about 0.05 on the 0-1 fraction scale, and no combination deviates by more than about 0.25. That is the expected level of agreement when a fitted model is regenerated from published population-mean point estimates and compared against the observed means it was fit to: the published extents carry replicate-to-replicate noise (the SDs in Tables 2 and 3 reach 0.3 for some entries) that a typical-value simulation cannot reproduce. The largest deviations are concentrated in PBP4 and PBP5/6 for the slowly penetrating penicillins and the BLIs, where the observed curves are flat near 1.0 and small differences in the fitted acylation constants move the predicted plateau.
Comparison against the published rate of net influx
Table 1 also reports each drug’s rate of net influx and PBP access
relative to imipenem. That column is a direct function of the
rate_influx_scaled values in the model files and is
reproduced exactly.
rate_influx |>
  left_join(select(pbp_drugs, Drug, Code, Class), by = "Drug") |>
  mutate(`Relative to IPM` = rate_scaled[Drug == "imipenem"] / rate_scaled) |>
  select(Drug, Code, Class, `Scaled rate (molecules/min per mg/L)` = rate_scaled,
         `C_drug (mg/L)` = cdrug,
         `Rate at studied conc. (molecules/min)` = rate_at_conc,
         `Relative to IPM`) |>
knitr::kable(digits = 3, caption = "Reproduces Table 1: scaled rate of net influx and PBP access, the rate at the studied concentration, and the fold-difference relative to imipenem.")| Drug | Code | Class | Scaled rate (molecules/min per mg/L) | C_drug (mg/L) | Rate at studied conc. (molecules/min) | Relative to IPM |
|---|---|---|---|---|---|---|
| imipenem | IPM | Carbapenem | 74.500 | 2 | 149.000 | 1.000 |
| doripenem | DOR | Carbapenem | 40.900 | 2 | 81.800 | 1.822 |
| meropenem | MEM | Carbapenem | 35.100 | 1 | 35.100 | 2.123 |
| ertapenem | ETP | Carbapenem | 1.040 | 8 | 8.320 | 71.635 |
| ceftazidime | CAZ | Cephalosporin | 5.180 | 2 | 10.360 | 14.382 |
| cefepime | FEP | Cephalosporin | 1.660 | 2 | 3.320 | 44.880 |
| cefoxitin | FOX | Cephalosporin | 0.073 | 2048 | 149.709 | 1019.152 |
| aztreonam | ATM | Monobactam | 0.299 | 8 | 2.392 | 249.164 |
| piperacillin | PIP | Penicillin | 0.301 | 8 | 2.408 | 247.508 |
| carbenicillin | CAR | Penicillin | 0.148 | 96 | 14.208 | 503.378 |
| ticarcillin | TIC | Penicillin | 0.126 | 48 | 6.048 | 591.270 |
| avibactam | AVI | DBO-BLI | 9.850 | 4 | 39.400 | 7.563 |
| relebactam | REL | DBO-BLI | 9.850 | 4 | 39.400 | 7.563 |
| sulbactam | SUL | BLI | 1.490 | 4 | 5.960 | 50.000 |
| tazobactam | TZB | BLI | 0.208 | 4 | 0.832 | 358.173 |
Because the reference values are fractions bounded in
[0, 1], the percentage difference reported by
ncaComparisonTable() is inflated wherever the reference
value is small; the absolute difference on the fraction scale is the
meaningful metric and is summarised above. Rows flagged with
* are dominated by such small-denominator cases.
Mechanistic checks
Mass balance of PBP molecules
Every PBP molecule is either unbound (a state) or acylated. The number bound must equal the initial number minus the current number, and can never exceed the initial number or fall below zero.
mb <- sim_dense |>
  group_by(Drug, Cells, PBP) |>
  summarise(
    start = first(n_unbound[time == 0]),
    min_unbound = min(n_unbound),
    max_unbound = max(n_unbound),
    .groups = "drop"
  )

stopifnot(
  all(mb$min_unbound >= -1e-8),               # no negative PBP counts
  all(mb$max_unbound <= mb$start + 1e-8)      # monotone non-increasing
)
tibble::tibble(
  Check = c("No negative unbound-PBP counts", "Unbound PBPs never exceed the initial condition"),
  Result = c("pass", "pass")
) |> knitr::kable()| Check | Result |
|---|---|
| No negative unbound-PBP counts | pass |
| Unbound PBPs never exceed the initial condition | pass |
Mass balance of drug molecules in periplasm
In the intact-cell assay the cumulative drug that entered the periplasm must equal the free periplasmic pool plus the drug consumed by acylation. Because one drug molecule is consumed per PBP acylated, the consumed amount equals the total number of PBP molecules inactivated.
drug_balance <- lapply(seq_len(nrow(pbp_drugs)), function(i) {
  s <- solve_one(i, dense_times, 1)
  pbp_cols <- c("npbp1a", "npbp1b", "npbp2", "npbp3", "npbp4", "npbp56")
  bound <- sum(s[s$time == 0, pbp_cols]) - rowSums(s[, pbp_cols])
  tibble::tibble(
    Drug = pbp_drugs$Drug[i],
    time = s$time,
    entered = s$rate_influx * s$time,   # constant influx rate
    accounted = s$nperi + bound
  )
}) |> bind_rows()

worst <- drug_balance |>
  filter(time > 0) |>
  mutate(rel_err = abs(entered - accounted) / pmax(entered, 1e-12)) |>
  summarise(`max relative mass-balance error` = max(rel_err))

stopifnot(worst[[1]] < 1e-4)
knitr::kable(worst, digits = 8, caption = "Periplasmic drug mass balance in the intact-cell assay: cumulative influx equals free periplasmic drug plus drug consumed by PBP acylation.")| max relative mass-balance error |
|---|
| 0 |
Saturation regime
The paper fixed Km at 1,000 drug molecules to keep
periplasmic binding in the linear (non-saturated) regime in intact
cells, while the 10^7 molecules used in the lysed assay saturate the
reaction 10,000-fold above Km.
sim_peri <- lapply(seq_len(nrow(pbp_drugs)), function(i) {
  s <- solve_one(i, dense_times, 1)
  tibble::tibble(Drug = pbp_drugs$Drug[i], time = s$time, nperi = s$nperi)
}) |> bind_rows()

# While PBP binding is still ongoing (>= 5% of PBP5/6 still unbound), N_peri
# should stay well below Km = 1000; once the PBPs are exhausted N_peri simply
# accumulates because the model has no periplasmic efflux term.
binding_window <- sim_dense |>
  filter(PBP == "PBP5/6", Cells == "Intact", frac_unbound > 0.05) |>
  group_by(Drug) |>
  summarise(t_end = max(time), .groups = "drop")

sim_peri |>
  left_join(binding_window, by = "Drug") |>
  filter(!is.na(t_end), time <= t_end) |>
  group_by(Drug) |>
  summarise(`max N_peri while PBP5/6 binding` = max(nperi), .groups = "drop") |>
  mutate(`below Km = 1000` = `max N_peri while PBP5/6 binding` < 1000) |>
knitr::kable(digits = 1, caption = "Periplasmic drug molecules per cell during the PBP-binding window in intact cells.")| Drug | max N_peri while PBP5/6 binding | below Km = 1000 |
|---|---|---|
| avibactam | 1722.2 | FALSE |
| aztreonam | 49.0 | TRUE |
| carbenicillin | 20.8 | TRUE |
| cefepime | 45.8 | TRUE |
| cefoxitin | 1495.6 | FALSE |
| ceftazidime | 320.4 | TRUE |
| doripenem | 3609.0 | FALSE |
| ertapenem | 109.8 | TRUE |
| imipenem | 7554.8 | FALSE |
| meropenem | 1244.5 | FALSE |
| piperacillin | 12.8 | TRUE |
| relebactam | 2175.9 | FALSE |
| sulbactam | 152.0 | TRUE |
| tazobactam | 43.1 | TRUE |
| ticarcillin | 38.6 | TRUE |
Assumptions and deviations
-
Main-text Eq 2/3/4 vs Fig. S8 code. The published
equations and the published estimation code express the Michaelis-Menten
term differently. Main text Eq 2 defines
MM_1a = Vmax_1a / (Km + N_peri)and Eq 3 then multiplies byN_peri(d(N_PBP1a)/dt = -MM_1a x N_peri x N_PBP1a), whereas Eq 4 omits thatN_perifactor from the periplasmic balance. Fig. S8 instead foldsN_periintoMM(MM1a = K1a*Nperi/(KM_1a+Nperi)) and uses the sameMM_i x N_PBPiproduct in both the PBP ODEs and the periplasmic balance. The two forms give identical PBP ODEs, but only the Fig. S8 form conserves drug mass (each acylation consumes exactly one drug molecule). The Fig. S8 code form is the one implemented here, and the mass-balance check above confirms it. -
No between-replicate variability. The supplement
states that all parameters were described by log-normal (or logistic,
for the noise terms) distributions, but Tables S1 and S2 report
population means only – no variance components are published. The model
files therefore contain no
etaterms and simulate typical values. Residual error is reported and is implemented. -
Residual error form. Fig. S8 lines 111-116 give
V = (SDin + SDsl * Y)^2, i.e. the additive and proportional standard deviations add linearly. That is nlmixr2’scombined1()form, not the defaultcombined2()root-sum-of-squares. -
Choice of estimation dataset for the nuisance
parameters. The 15 drugs were fit in five datasets of four
drugs each, with imipenem as the shared backbone (Table S2). Each drug’s
noise_*,fini_*,addSd_*andpropSd_*values are taken from its own dataset. Cefoxitin appeared in datasets 2 and 5; the supplement states the final cefoxitin estimates come from dataset 5, which is whatLopezArguello_2023_cefoxitin_qspuses. Imipenem is the one ambiguous case: it appears in all five datasets and Table S1 reports a single set of imipenem acylation rate constants without attributing them to a dataset.LopezArguello_2023_imipenem_qspuses dataset 1 (the carbapenem dataset), as directed by the maintainers. Only the background-noise, initial-condition and residual-error parameters are affected; the drug-specific acylation constants and net-influx rate are unambiguous. -
CELLS_INTACTandCONC_<CODE>_MGLas covariates. The assay arm and the studied extracellular concentration are experimental design variables, not estimated quantities, and are supplied on the event table rather than asini()entries.CELLS_INTACTis a new canonical covariate ratified by the maintainers for this extraction; it is general-scope because the intact-versus-lysed contrast is a standard target-site-penetration design rather than something specific to this paper. It is structural rather than a coefficient multiplier: it gates both the influx term and the periplasmic initial condition, so it has noe_<cov>_<param>coefficient. The concentration covariates are well-formed members of the existingCONC_<DRUG>_MGLfamily (CONC_IPM_MGLwas already registered for Landersdorfer 2018); the other fourteen were added alongside this extraction. -
Shared parameters for relebactam. Table 1 footnote
c and Table S1 footnote b state that relebactam’s rate of net influx and
its PBP2 acylation constant were estimated as shared parameters with
avibactam because relebactam bound PBPs only to a limited extent in
intact bacteria. These are shared estimates, not fixed
constants, and are therefore not wrapped in
fixed(); the sharing is recorded in the in-file source-trace comments. The relebactam estimates carry extra uncertainty. - Total PBP molecules per cell. No published count exists for P. aeruginosa, so the authors borrowed the E. coli figure of 1,731 molecules per cell and split it using P. aeruginosa relative band intensities (Table S3). This is the authors’ documented assumption, carried through unchanged.
- Ceftazidime PBP5/6 at 60 min. The paper notes that ceftazidime showed considerable PBP5/6 binding at 60 min but not earlier, “which may have been an ‘outlier’ that could not be explained by QSP modeling” (Results, Time-course PBP binding in whole cells). The reproduced model shows the same behaviour – little PBP5/6 binding – so this row differs from the observed Table 2 value by design, not by extraction error.
-
No dosing events. The extracellular concentration
is held static throughout the assay, so the model has no dose records;
drug enters the periplasm at a constant rate while the intact-cell
switch is on. The model has no periplasmic efflux or degradation term,
so once the PBPs are exhausted
N_periaccumulates linearly. That is a faithful consequence of the published structure and does not affect the 0-60 min binding predictions. -
Negative-state guard. Fig. S8 lines 94-100 clamp
any negative state to zero before computing the output. This is
reproduced as
max(state, 0)in the output equations. With the published parameter values the states remain non-negative, so the guard never activates.
Session information
sessionInfo()
#> R version 4.6.1 (2026-06-24)
#> Platform: x86_64-pc-linux-gnu
#> Running under: Ubuntu 24.04.5 LTS
#>
#> Matrix products: default
#> BLAS:   /usr/lib/x86_64-linux-gnu/openblas-pthread/libblas.so.3
#> LAPACK: /usr/lib/x86_64-linux-gnu/openblas-pthread/libopenblasp-r0.3.26.so;  LAPACK version 3.12.0
#>
#> locale:
#>  [1] LC_CTYPE=C.UTF-8       LC_NUMERIC=C           LC_TIME=C.UTF-8
#>  [4] LC_COLLATE=C.UTF-8     LC_MONETARY=C.UTF-8    LC_MESSAGES=C.UTF-8
#>  [7] LC_PAPER=C.UTF-8       LC_NAME=C              LC_ADDRESS=C
#> [10] LC_TELEPHONE=C         LC_MEASUREMENT=C.UTF-8 LC_IDENTIFICATION=C
#>
#> time zone: UTC
#> tzcode source: system (glibc)
#>
#> attached base packages:
#> [1] stats     graphics  grDevices utils     datasets  methods   base
#>
#> other attached packages:
#> [1] ggplot2_4.0.3         tidyr_1.3.2           dplyr_1.2.1
#> [4] PKNCA_0.12.1          rxode2_5.1.8          nlmixr2lib_0.3.2.9000
#>
#> loaded via a namespace (and not attached):
#>  [1] gtable_0.3.6        xfun_0.61           bslib_0.12.0
#>  [4] rxode2lincmt_0.1.0  lattice_0.22-9      vctrs_0.7.3
#>  [7] tools_4.6.1         generics_0.1.4      parallel_4.6.1
#> [10] tibble_3.3.1        symengine_0.2.14    pkgconfig_2.0.3
#> [13] Matrix_1.7-5        data.table_1.18.6.1 checkmate_2.3.4
#> [16] RColorBrewer_1.1-3  S7_0.2.2            desc_1.4.3
#> [19] lifecycle_1.0.5     compiler_4.6.1      farver_2.1.2
#> [22] textshaping_1.0.5   fontawesome_0.5.3   htmltools_0.5.9
#> [25] sys_3.4.3           sass_0.4.10         yaml_2.3.12
#> [28] pillar_1.11.1       pkgdown_2.2.1       crayon_1.5.3
#> [31] jquerylib_0.1.4     whisker_0.4.1       openssl_2.4.2
#> [34] cachem_1.1.0        nlme_3.1-169        tidyselect_1.2.1
#> [37] digest_0.6.39       lotri_1.0.5         purrr_1.2.2
#> [40] splines_4.6.1       labeling_0.4.3      rxode2ll_2.0.18
#> [43] fastmap_1.2.0       grid_4.6.1          cli_3.6.6
#> [46] dparser_1.3.1-14    magrittr_2.0.5      withr_3.0.3
#> [49] scales_1.4.0        backports_1.5.1     rmarkdown_2.32
#> [52] otel_0.2.0          askpass_1.2.1       ragg_1.5.2
#> [55] memoise_2.0.1       evaluate_1.0.5      knitr_1.52
#> [58] rex_1.2.2           mgcv_1.9-4          PreciseSums_0.7
#> [61] rlang_1.3.0         downlit_0.4.5       Rcpp_1.1.2
#> [64] glue_1.8.1          xml2_1.6.0          jsonlite_2.0.0
#> [67] R6_2.6.1            systemfonts_1.3.2   fs_2.1.0