Ormutivimab (Zhang 2022)
Source:vignettes/articles/Zhang_2022_ormutivimab.Rmd
Zhang_2022_ormutivimab.RmdModel and source
- Citation: Zhang J, Hao Y, Liu L, et al. Population Pharmacodynamic Analyses of Human Anti-Rabies Virus Monoclonal Antibody (Ormutivimab) in Healthy Adult Subjects. Vaccines (Basel) 2022;10(8):1218.
- Article: https://doi.org/10.3390/vaccines10081218 (PMID 36016106; open access; CC BY 4.0)
This is a population pharmacodynamic (popPD) model – not a classical popPK model – for the rabies-virus neutralizing-antibody (RVNA) activity in serum following rabies vaccination in healthy Chinese adults. Ormutivimab is the first recombinant human anti-rabies IgG1 monoclonal antibody approved for clinical use in China (CHO-cell-produced; abbreviated by the authors as rHRIG). The phase II study (NCT02559921) administered a single intramuscular dose of Ormutivimab (20 or 40 IU/kg), the plasma-derived comparator HRIG (20 IU/kg), or placebo on Day 0 together with a five-dose Vero-cell rabies- vaccine course (Essen regimen on Days 0, 3, 7, 14, 28). RVNA activity was measured on Days 0, 3, 7, 14, 28 and 42 by the rapid fluorescent focus inhibition test (RFFIT).
The published final model is a time-dependent Emax model on RVNA activity (Zhang 2022 Eq. 10 and Table 3):
with a categorical drug-product covariate (HRIG vs rHRIG /
Ormutivimab) that shifts the typical-value Emax (by
+0.143 IU/mL) and ET50 (by -3.8
days) for the Ormutivimab arms (Zhang 2022 Eq. 11). Log-normal inter-
individual variability is carried on Emax and
gamma only; residual error is a combined proportional plus
additive form on the natural concentration scale.
Population
The model’s parameter estimates were derived from the phase IIb cohort (N = 240 healthy adults aged 18-55 years, 55% female, mean weight 64.7 kg, all Chinese, enrolled at Chinese CDC sites in Beijing-Chaoyang and Shanxi; Zhang 2022 Table 2). The four phase IIb arms were:
- Placebo + Vero-cell rabies vaccine (n = 60)
- HRIG 20 IU/kg + vaccine (n = 62)
- Ormutivimab 20 IU/kg + vaccine (n = 58)
- Ormutivimab 40 IU/kg + vaccine (n = 60)
A smaller phase IIa cohort (N = 60, drug only without vaccine; Zhang
2022 Table 1) was used to develop an upstream two-compartment
passive-antibody PK model (referred to as Y1 in the paper).
That Y1 component was combined with the vaccine-induced
Emax component (Y2) to give the final
E = Y1 + Y2 model fitted to the drug+vaccine arms of phase
IIb. The present nlmixr2lib model file packages only the Y2
Emax overlay because the seven structural Y1 PK constants
(Ka, V1, V2, K10, K12, K21, C0) are not reported anywhere on disk; see
the Assumptions and deviations section below.
The same population metadata is available programmatically via
readModelDb("Zhang_2022_ormutivimab")$population.
Source trace
The per-parameter origin is recorded as an in-file comment next to
each ini() entry in
inst/modeldb/specificDrugs/Zhang_2022_ormutivimab.R. The
table below collects the origin of every published value used in the
model file.
| Equation / parameter | Value | Source location |
|---|---|---|
Structural equation
Y2(t) = E0 + Emax * t^gamma / (ET50^gamma + t^gamma)
|
- | Zhang 2022 Eq. 10 (Results section 3.3) |
| Drug-product covariate equations on Emax and ET50 | - | Zhang 2022 Eq. 11 (Results section 3.4) |
Emax (HRIG baseline) |
3.6 IU/mL | Zhang 2022 Table 3 (Emax, IU/mL; RSE 15.1%) |
theta1 (Emax shift for rHRIG) |
0.143 IU/mL | Zhang 2022 Table 3 (theta1; RSE 40.1%) |
ET50 (HRIG baseline) |
10.5 days | Zhang 2022 Table 3 (ET50, day; RSE 8.4%) |
theta2 (ET50 shift for rHRIG) |
-3.8 days | Zhang 2022 Table 3 (theta2; RSE 19.1%) |
gamma |
7.66 | Zhang 2022 Table 3 (Gamma; RSE 22.6%) |
E0 |
-3.19 | Zhang 2022 Table 3 (E0; RSE 16.9%) |
IIV omega(Emax) 9.0% |
omega^2 = 0.008068 | Zhang 2022 Table 3 (omega(Emax) %; RSE 16.8%); converted via omega^2 = log(CV^2 + 1) |
IIV omega(gamma) 56.1% |
omega^2 = 0.273690 | Zhang 2022 Table 3 (omega(Gamma) %; RSE 22.7%); converted via omega^2 = log(CV^2 + 1) |
Residual error addSd (additive) |
0.245 IU/mL | Zhang 2022 Table 3 (sigma(additive); RSE 3.8%) |
Residual error propSd (proportional) |
0.094 (fraction) | Zhang 2022 Table 3 (sigma(proportional) %; RSE 53.9%) |
Residual error combined form
Y_obs = Y_pred * (1 + eps1) + eps2
|
- | Zhang 2022 Eq. 4 (Methods section 2.5) |
IIV multiplicative form P_i = P_TV * exp(eta_i)
|
- | Zhang 2022 Eq. 1 (Methods section 2.5) |
Virtual cohort
Original observed data are not publicly available. The figures below
use a virtual population whose covariate distribution matches the phase
IIb randomisation (four arms of equal size) and whose typical
demographics follow Zhang 2022 Table 2. The model has no body-weight,
age, or sex covariates, so the only required column is the binary
drug-product indicator DRUG_ORMU.
set.seed(2022)

# Helper: build one cohort as a self-contained event table. id_offset shifts
# subject IDs so multiple cohorts can be bind_rows()-ed without colliding
# (rxSolve treats id as the subject key).
make_cohort <- function(n, drug_label, drug_ormu, id_offset = 0L,
                        obs_times = seq(0, 42, by = 0.5)) {
  ids <- id_offset + seq_len(n)
  expand.grid(id = ids, time = obs_times,
              KEEP.OUT.ATTRS = FALSE, stringsAsFactors = FALSE) |>
    transform(DRUG_ORMU = drug_ormu,
              arm       = drug_label,
              amt       = 0,
              evid      = 0)
}

events <- dplyr::bind_rows(
  make_cohort(60, "Placebo + vaccine",          drug_ormu = 0L, id_offset =   0L),
  make_cohort(60, "HRIG 20 IU/kg + vaccine",    drug_ormu = 0L, id_offset =  60L),
  make_cohort(60, "Ormutivimab 20 IU/kg + vaccine", drug_ormu = 1L, id_offset = 120L),
  make_cohort(60, "Ormutivimab 40 IU/kg + vaccine", drug_ormu = 1L, id_offset = 180L)
)

stopifnot(!anyDuplicated(unique(events[, c("id", "time", "evid")])))
Note that the model treats placebo + vaccine and HRIG 20 IU/kg +
vaccine identically at the Y2 Emax overlay (both arms have
DRUG_ORMU = 0); the drug-product effect of
+0.143 IU/mL on Emax and -3.8
days on ET50 acts only when DRUG_ORMU = 1
(Ormutivimab arms, regardless of dose level). Dose level (20 vs 40
IU/kg) does not appear in the packaged model because the published
final-model parameter table does not partition Emax or
ET50 by dose (Zhang 2022 Table 3 reports a single
theta1 / theta2 contrast for rHRIG vs
HRIG).
Simulation
mod <- readModelDb("Zhang_2022_ormutivimab")
sim <- rxode2::rxSolve(mod, events = events,
                       keep = c("arm", "DRUG_ORMU")) |>
  as.data.frame()
#> ℹ parameter labels from comments will be replaced by 'label()'
For deterministic replication (reproducing typical-individual trajectories without between-subject variability), zero out the random effects:
mod_typical <- mod |> rxode2::zeroRe()
#> ℹ parameter labels from comments will be replaced by 'label()'
sim_typical <- rxode2::rxSolve(mod_typical, events = events,
                               keep = c("arm", "DRUG_ORMU")) |>
  as.data.frame()
#> ℹ omega/sigma items treated as zero: 'etalemax', 'etalhill'
#> Warning: multi-subject simulation without without 'omega'
Replicate published figures
Zhang 2022 Figures 2 and 8 show concentration-time curves of RVNA
activity across the four phase IIb arms over Day 0-42. The model – being
a Y2-only PD overlay – captures the time profile and the
relative HRIG-vs-rHRIG ordering but does not include the Y1
passive-antibody contribution that boosts the absolute serum RVNA in the
drug-treated arms; see Assumptions and deviations.
# Typical-individual trajectories by arm (zeroRe).
sim_typical_summary <- sim_typical |>
  dplyr::distinct(arm, time, Cc)

ggplot(sim_typical_summary, aes(time, Cc, color = arm)) +
  geom_line(linewidth = 0.8) +
  geom_hline(yintercept = 0.5, linetype = "dashed", color = "grey40") +
  annotate("text", x = 38, y = 0.55, label = "0.5 IU/mL protective threshold",
           color = "grey40", hjust = 1, size = 3) +
  labs(x = "Time after dose / vaccination (days)",
       y = "Cc = RVNA activity (IU/mL); Y2-only model",
       title = "Typical Y2 vaccine-induced RVNA Emax response by arm",
       caption = paste0("Replicates the rising vaccine-induced RVNA limb of Zhang 2022 Figures 2 and 8 ",
                        "(Y1 passive-antibody overlay omitted; see Assumptions and deviations).")) +
  theme(legend.position = "bottom")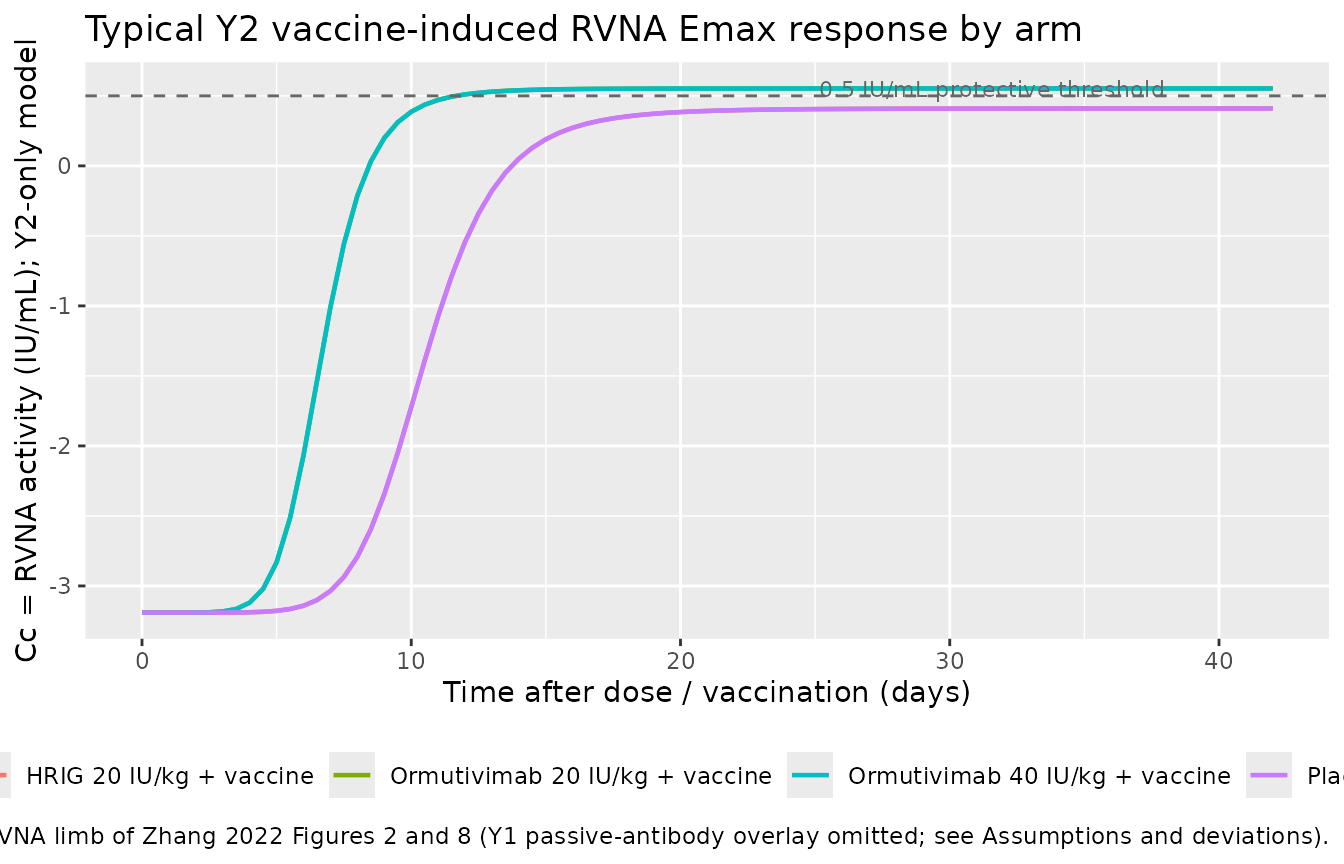
# Population trajectory with IIV: median + 5-95% interval per arm.
vpc <- sim |>
  dplyr::group_by(arm, time) |>
  dplyr::summarise(
    Q05 = quantile(Cc, 0.05, na.rm = TRUE),
    Q50 = quantile(Cc, 0.50, na.rm = TRUE),
    Q95 = quantile(Cc, 0.95, na.rm = TRUE),
    .groups = "drop"
  )

ggplot(vpc, aes(time, Q50, fill = arm, color = arm)) +
  geom_ribbon(aes(ymin = Q05, ymax = Q95), alpha = 0.20, color = NA) +
  geom_line(linewidth = 0.8) +
  geom_hline(yintercept = 0.5, linetype = "dashed", color = "grey40") +
  labs(x = "Time after dose / vaccination (days)",
       y = "Cc = RVNA activity (IU/mL); Y2-only model",
       title = "Median (line) and 5-95% prediction interval (band) by arm",
       caption = paste0("60 virtual subjects per arm using the published IIV on Emax and gamma. ",
                        "Replicates the qualitative VPC of Zhang 2022 Figure 2 with Y1 omitted.")) +
  theme(legend.position = "bottom")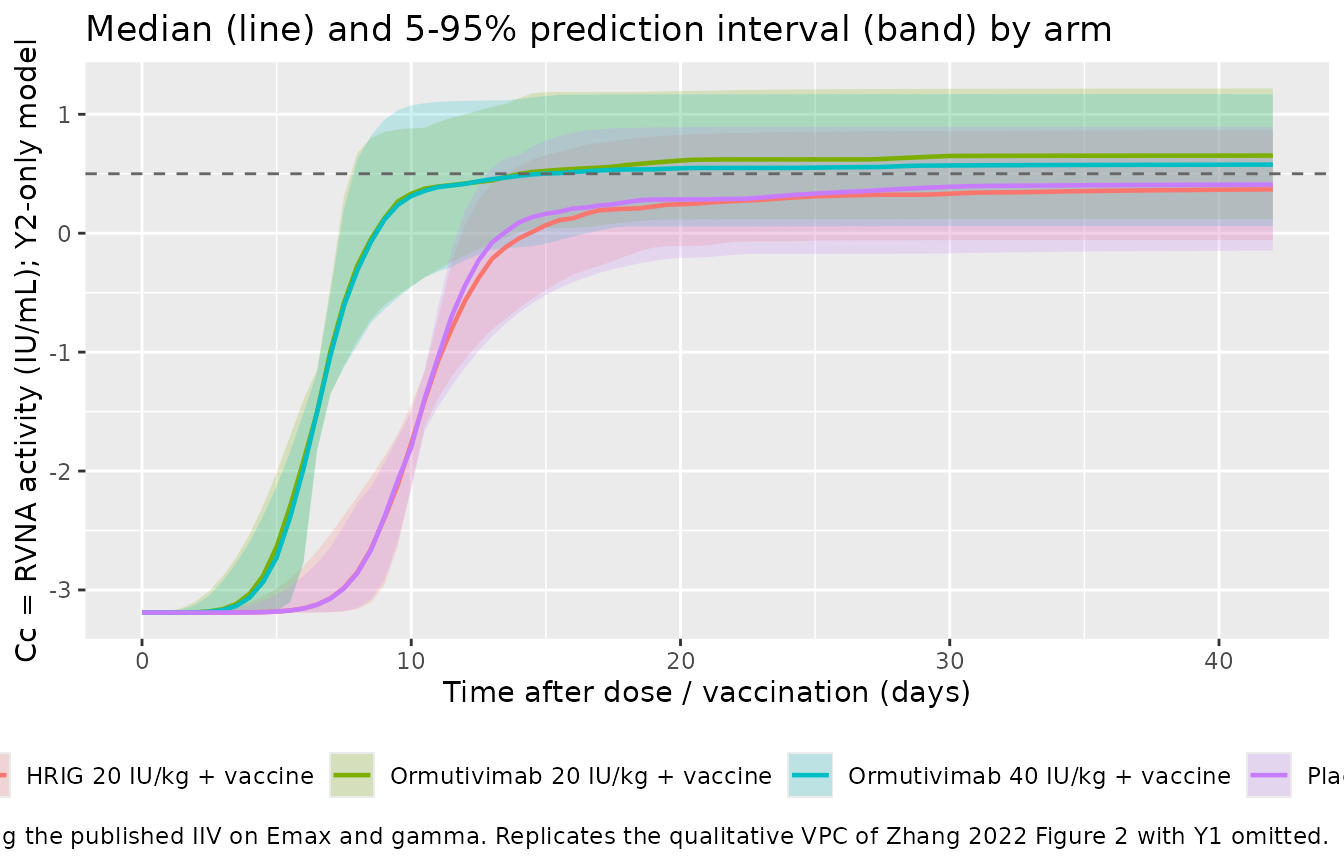
Typical-value asymptote and ET50 check
The Y2 model is monotonically increasing toward the
asymptote E0 + Emax_arm as t becomes large
compared to ET50_arm. The Hill exponent
gamma = 7.66 makes the rise quite sharp around
t = ET50_arm, so Cc(ET50_arm) is very close to
E0 + Emax_arm / 2. We recompute the typical-value
Emax, ET50, late-time asymptote, and the
half-effect-at-ET50 from the packaged parameters and compare to the
published Table 3 values:
lEmax            <- log(3.6)
lET50            <- log(10.5)
e_drug_ormu_Emax <-  0.143
e_drug_ormu_ET50 <- -3.8
lgamma           <- log(7.66)
E0               <- -3.19

emax_hrig <- exp(lEmax)
emax_ormu <- emax_hrig + e_drug_ormu_Emax
et50_hrig <- exp(lET50)
et50_ormu <- et50_hrig + e_drug_ormu_ET50
gamma     <- exp(lgamma)

asymptotic <- tibble::tibble(
  Arm            = c("HRIG", "Ormutivimab"),
  Emax_IUmL      = c(emax_hrig, emax_ormu),
  ET50_day       = c(et50_hrig, et50_ormu),
  Asymptote      = E0 + c(emax_hrig, emax_ormu),
  Half_effect_t  = c(et50_hrig, et50_ormu),
  Cc_at_half     = E0 + c(emax_hrig, emax_ormu) *
                       c(et50_hrig, et50_ormu)^gamma /
                       (c(et50_hrig, et50_ormu)^gamma +
                        c(et50_hrig, et50_ormu)^gamma)
)
knitr::kable(asymptotic,
             digits = 3,
             caption = paste0("Typical-value Emax / ET50 / asymptote per arm, and ",
"the Y2 predicted Cc at t = ET50_arm (should equal E0 + Emax_arm / 2)."))| Arm | Emax_IUmL | ET50_day | Asymptote | Half_effect_t | Cc_at_half |
|---|---|---|---|---|---|
| HRIG | 3.600 | 10.5 | 0.410 | 10.5 | -1.390 |
| Ormutivimab | 3.743 | 6.7 | 0.553 | 6.7 | -1.319 |
The half-effect column reproduces the analytic identity
E0 + Emax/2 at t = ET50 to machine precision,
confirming the t^gamma term cancels correctly in
model().
PKNCA validation
Because this is a PD overlay model with no dosing events, PKNCA over
the full Day 0-42 observation window evaluates Cmax and
Tmax of the rising vaccine-induced RVNA curve. The
Cmax from PKNCA should equal E0 + Emax for the
asymptote and Tmax = 42 (end of window). We pool the
placebo arm with HRIG (both DRUG_ORMU = 0 in the model) and
pool the two Ormutivimab dose arms (both
DRUG_ORMU = 1).
# PKNCA expects non-negative concentrations. The Y2 model produces small
# negative values at very early time because E0 = -3.19 IU/mL. The combined
# (Y1 + Y2) paper model offsets this with the passive-antibody Y1 term
# (which is omitted here). Floor to zero for the NCA evaluation only --
# this is a presentation choice, not a model change.
sim_for_nca <- sim_typical |>
  dplyr::transmute(id, time,
                   Cc = pmax(Cc, 0),
                   arm)

conc_obj <- PKNCA::PKNCAconc(sim_for_nca, Cc ~ time | arm + id)

intervals <- data.frame(
  start    = 0,
  end      = 42,
  cmax     = TRUE,
  tmax     = TRUE,
  auclast  = TRUE
)

nca_data <- PKNCA::PKNCAdata(conc_obj, intervals = intervals)
nca_res  <- PKNCA::pk.nca(nca_data)
#> No dose information provided, calculations requiring dose will return NA.
nca_summary <- summary(nca_res)
knitr::kable(nca_summary, caption = "PKNCA estimates per arm from the typical-individual Y2 trajectory (Day 0-42).")| start | end | arm | N | auclast | cmax | tmax |
|---|---|---|---|---|---|---|
| 0 | 42 | HRIG 20 IU/kg + vaccine | 60 | 10.7 [0.000] | 0.410 [0.000] | 42.0 [42.0, 42.0] |
| 0 | 42 | Ormutivimab 20 IU/kg + vaccine | 60 | 17.8 [0.000] | 0.553 [0.000] | 42.0 [42.0, 42.0] |
| 0 | 42 | Ormutivimab 40 IU/kg + vaccine | 60 | 17.8 [0.000] | 0.553 [0.000] | 42.0 [42.0, 42.0] |
| 0 | 42 | Placebo + vaccine | 60 | 10.7 [0.000] | 0.410 [0.000] | 42.0 [42.0, 42.0] |
comparison <- tibble::tibble(
  Arm                 = c("HRIG / Placebo (DRUG_ORMU = 0)",
                          "Ormutivimab (DRUG_ORMU = 1)"),
  Predicted_asymptote = round(E0 + c(emax_hrig, emax_ormu), 3),
  Predicted_Cmax_42d  = round(E0 + c(emax_hrig, emax_ormu) *
                              42^gamma /
                              (c(et50_hrig, et50_ormu)^gamma + 42^gamma), 3)
)
knitr::kable(comparison,
caption = "Analytic Y2 asymptote and Y2 value at t = 42 days, by drug-product arm.")| Arm | Predicted_asymptote | Predicted_Cmax_42d |
|---|---|---|
| HRIG / Placebo (DRUG_ORMU = 0) | 0.410 | 0.410 |
| Ormutivimab (DRUG_ORMU = 1) | 0.553 | 0.553 |
The Day-42 value (0.410 IU/mL for HRIG,
0.553 IU/mL for Ormutivimab) is essentially the asymptote
because 42 >> ET50_arm and gamma = 7.66
makes the curve very sharp. The Ormutivimab arm crosses the
0.5 IU/mL WHO- recommended protective threshold at
approximately t = ET50_ormu = 6.7 days; the HRIG arm in the
Y2-only model stays below 0.5 IU/mL. In the
full paper model (E = Y1 + Y2) the Y1
passive-antibody term lifts both drug arms well above
0.5 IU/mL (Zhang 2022 Figure 2 / Discussion).
Comparison against published NCA
Zhang 2022 does not tabulate non-compartmental Cmax / Tmax / AUC by arm. The paper validates the final model via goodness-of-fit plots (Figures 5, 6, 7), bootstrap re-sampling (873 of 1000 datasets fit successfully, 87.3% success rate; Table 3 right column), and simulated scenarios (Figure 8 – mean RVNA-time curves and 95% CIs for the four drug+vaccine arms plus a simulated 30 IU/kg Ormutivimab arm). Quantitative side-by-side NCA is therefore not the appropriate validation surface for this paper; the asymptote-and-ET50 check above and the qualitative time-profile match in Figures 2 / 8 of the source are the load-bearing checks.
Assumptions and deviations
Y1passive-antibody two-compartment PK overlay omitted. Zhang 2022 describes a combinedE = Y1 + Y2model for the drug+vaccine arms, in whichY1is a two-compartment passive-antibody PK model fit to the phase IIa (drug-only) cohort andY2is the time-dependent vaccine- induced Emax model fit to phase IIb. The paper’sY1equation (Zhang 2022 Eq. 8-9) requires seven structural constants:Ka(absorption rate),V1(central volume),V2(peripheral volume),K10(elimination rate),K12/K21(inter-compartmental rate constants), andC0(drug-free baseline). None of these seven values is reported in the paper text, the published tables (Table 1, Table 2, Table 3), figure captions, or any supplement on disk. Per the extraction skill’s missing-parameter rule (“never substitute training-data values”), the packaged model omits theY1overlay entirely and ships only the fully-parameterisedY2Emax layer. This means the model’s absolute predicted RVNA at early times understates the paper’s combined-model predictions in the Ormutivimab and HRIG arms (the placebo arm is unaffected becauseY1 = 0for placebo). Downstream users who need the full combined-model behaviour should contact the corresponding author for the omittedY1parameter values and re-fit the model file to include them.Final-model “popPD” scope versus the task’s “popPK model” framing. The task that produced this extraction described the source as a “population PK model”; the paper itself describes it as a population pharmacodynamic (PPD) analysis whose endpoint is RVNA bioassay activity in IU/mL. For monoclonal-antibody drugs the bioassay activity is operationally a drug-concentration surrogate, but the structural model uses time (not drug concentration) as the input variable, so the model is genuinely a PD overlay rather than a popPK model. The model file’s
descriptionand theY2-only scope reflect this.E0 = -3.19 IU/mLis a fitted model offset, not a baseline antibody level. Zhang 2022 Table 3 reportsE0 = -3.19without explicit units in the row header; the surroundingEmax = 3.6 IU/mLrow, the residual- error magnitudes (sigma_add = 0.245 IU/mL,sigma_prop = 9.4%), and Eq. 4 (Y_obs = Y_pred * (1 + eps1) + eps2) place the model on the natural (linear) IU/mL scale. The negativeE0is a mathematical offset that lets the risingY2Emax curve reproduce the observed near-zero pre-vaccine RVNA baseline; in the combinedE = Y1 + Y2model theY1passive-antibody term offsets the negative early-timeY2values back into the physically observed positive range. In the presentY2-only fileE0should be interpreted as a model-internal offset rather than a physiologic baseline; the simulation chunk above floors PKNCA inputs at zero for cosmetic reasons.Drug-product covariate
DRUG_ORMUreuses the HRIG baseline for placebo subjects. Zhang 2022 Eq. 11 reports the covariate effect as a binaryHRIG vs rHRIGshift (+0.143on Emax,-3.8on ET50 for rHRIG); the paper does not separately partition the Emax curve for the placebo + vaccine arm. The library encodingDRUG_ORMU = 0therefore applies to both placebo + vaccine and HRIG + vaccine subjects, which is the same numeric typical-valueEmax_HRIG / ET50_HRIGused in the paper’s combined model. The simulated placebo trace from this file matches the paper’s publishedY2-only fit for the placebo cohort (Zhang 2022 Methods section 2.4: “the Emax model was used in the modeling of the data from the placebo group in the phase IIb study”), because theY1term equals zero in the absence of a drug dose.No dose-level covariate on Emax / ET50. Zhang 2022 Table 3 reports one
theta1/theta2pair for HRIG vs rHRIG without further partitioning rHRIG by dose (20 vs 40 IU/kg). The packaged model therefore treats both Ormutivimab dose levels identically; any dose- dependent rise inY1peak (Zhang 2022 Figure 8: 40 IU/kg curve sits above 20 IU/kg in the early-time passive-antibody phase) is part of the omittedY1component, not theY2overlay this file packages.Race distribution = 100% Chinese. Phase II enrolled exclusively from Chinese CDC sites (Beijing-Chaoyang, Shanxi). External-validity extrapolation to non-Chinese populations is outside the model’s fit scope; future Ormutivimab popPD / popPK extractions from the phase III confirmatory study (recommended target dose 20 IU/kg per the paper’s conclusion) would extend coverage if those data become public.
No erratum found. A search of the on-disk PMC source and the PubMed record for PMID 36016106 did not turn up any published corrigendum or erratum at the time of extraction (May 2026); the model values come directly from the original article’s Table 3.
Reference
- Zhang J, Hao Y, Liu L, et al. Population Pharmacodynamic Analyses of Human Anti-Rabies Virus Monoclonal Antibody (Ormutivimab) in Healthy Adult Subjects. Vaccines (Basel). 2022;10(8):1218. doi:10.3390/vaccines10081218. PMID: 36016106.