Dextroamphetamine transdermal system (Castelli 2022)
Source:vignettes/articles/Castelli_2022_dextroamphetamine.Rmd
Castelli_2022_dextroamphetamine.RmdModel and source
- Citation: Castelli M, Suzuki K, Starling B, Balakrishnan K, Meeves S, Komaroff M, Lennie J, Mondick JT, Faraone SV. Extrapolation of the Efficacy of a Dextroamphetamine Transdermal System Investigated in Pediatric Populations to Adults Using Pharmacokinetic Modeling. Poster, American Psychiatric Nurses Association (APNA), 14 June 2022. https://metrumrg.com/wp-content/uploads/2022/10/CastelliC_APNA-PK-Ped-Adult-Poster-2022-06-14-1.pdf
- Description: One-compartment population PK model for dextroamphetamine transdermal system (d-ATS) in adults and children with ADHD (Castelli 2022 APNA poster), with sequential zero- and first-order absorption (zero-order release over duration D1 into depot, then first-order Ka into central), power-law body-weight scaling on CL/F (exponent 0.47), V/F (0.53), and Ka (-0.29) at an assumed 70 kg reference, independent IIV on CL/F, V/F, Ka, and D1, bioavailability anchored at F = 1, and residual error not reported in the conference poster (encoded fixed at 0; see vignette Errata).
- Article (open access, conference poster): https://metrumrg.com/wp-content/uploads/2022/10/CastelliC_APNA-PK-Ped-Adult-Poster-2022-06-14-1.pdf
Population
The model was developed by pooling 6607 amphetamine plasma concentrations from 156 subjects across six PK studies of the dextroamphetamine transdermal system (d-ATS; Castelli 2022 Methods). The pooled population was 122 adults (78%; median age 33 years, range 18-62; median body weight 73.2 kg, range 43.8-101) and 34 children (22%; median age 10 years, range 6-12; median body weight 40.6 kg, range 23.1-63.5), all with attention-deficit/hyperactivity disorder (ADHD). Sex distribution and race/ethnicity are not tabulated in the conference poster. Below-limit-of-quantification (BLQ) concentrations during the elimination phase were excluded from parameter estimation; absorption- and distribution-phase BLQ records were retained.
The pivotal pediatric study evaluated 5 mg, 10 mg, 15 mg, and 20 mg d-ATS patches; the 15 mg dose was demonstrated as efficacious and deemed optimal in pediatric patients. Castelli 2022 extrapolates efficacy to adults via exposure matching, concluding that 20 mg d-ATS in adults produces exposures (AUC and Cmax) comparable to 15 mg in children and adolescents.
The same information is available programmatically via
readModelDb("Castelli_2022_dextroamphetamine")$population.
Source trace
Per-parameter origin is recorded as an in-file comment next to each
ini() entry in
inst/modeldb/specificDrugs/Castelli_2022_dextroamphetamine.R.
The table below collects them for review.
| Equation / parameter | Value | Source location |
|---|---|---|
| Structural model: 1-cmt PK with sequential zero- and first-order absorption | – | Castelli 2022 Results paragraph 1: “A one-compartment model with sequential zero- and first-order absorption … adequately described the observed amphetamine PK data” |
lcl (CL/F at 70 kg) |
log(18.4) L/h |
Table 1: CL/F = 18.4 L/h (95% CI 17.6, 19.2) |
lvc (V/F at 70 kg) |
log(51.9) L |
Table 1: V/F = 51.9 L (95% CI 48.1, 56.1) |
lka (Ka at 70 kg) |
log(0.070) 1/h |
Table 1: Ka = 0.070 1/h (95% CI 0.067, 0.073) |
ld1 (zero-order absorption duration D1) |
log(1.9) h |
Table 1: D1 = 1.9 h (95% CI 1.8, 2.1) |
lfdepot (F, fixed) |
fixed(log(1)) |
Methods: “Inter-occasion variability was estimated for D1 and bioavailability (F)”; typical F not separately reported – anchored at 1 per the apparent-parameter convention (see Errata) |
e_wt_cl (WT power exponent on CL/F) |
0.47 |
Table 1: weight effect on CL/F = 0.47 (95% CI 0.36, 0.58) |
e_wt_vc (WT power exponent on V/F) |
0.53 |
Table 1: weight effect on V/F = 0.53 (95% CI 0.31, 0.75) |
e_wt_ka (WT power exponent on Ka) |
-0.29 |
Table 1: weight effect on Ka = -0.29 (95% CI -0.43, -0.15) |
| IIV CL/F (omega^2 = log(1 + 0.201^2) = 0.0396) | 20.1% CV | Table 1: IIV CL/F 20.1% CV (95% CI 16.6, 23.1) |
| IIV V/F (omega^2 = log(1 + 0.374^2) = 0.1309) | 37.4% CV | Table 1: IIV V/F 37.4% CV (95% CI 30.3, 43.7) |
| IIV Ka (omega^2 = log(1 + 0.203^2) = 0.0404) | 20.3% CV | Table 1: IIV Ka 20.3% CV (95% CI 15.7, 24.1) |
| IIV D1 (omega^2 = log(1 + 0.486^2) = 0.2121) | 48.6% CV | Table 1: IIV D1 48.6% CV (95% CI 40.6, 55.8) |
| Residual error | fixed(0) |
NOT reported in the conference poster – encoded fixed at 0; see Errata |
| Reference weight | 70 kg (assumed) | NOT stated in the poster; encoded as 70 kg per the rounded-standard policy; see Errata |
| Concentration units | ng/mL | Standard plasma unit for amphetamine PK (not explicitly stated in the poster) |
Virtual cohort
The published individual-level data are not available. The virtual cohort below mirrors the Castelli 2022 cohort split: three age strata (adults, adolescents, children) with body-weight distributions matched to the published Methods. Adult body weights are log-normal centred on the study median 73.2 kg; pediatric (children, 6 to <12 years) body weights are log-normal centred on the study median 40.6 kg; adolescent (12 to <18 years) body weights are log-normal centred on a typical 55 kg (the poster does not separately tabulate adolescent weights – the median is intermediate between the children and adult medians).
set.seed(20220614) # poster date

n_per_arm <- 200L

make_cohort <- function(n, age_group, wt_med, wt_sd_log, dose_mg, id_offset) {
  tibble(
    id        = id_offset + seq_len(n),
    WT        = exp(rnorm(n, mean = log(wt_med), sd = wt_sd_log)),
    age_group = age_group,
    dose_mg   = dose_mg,
    treatment = sprintf("%s, %g mg", age_group, dose_mg)
  )
}

# Four cohorts for the primary exposure-matching comparison from Figure 3
# (adults at 20 mg vs. children at 15 mg) plus the same-dose contrasts
# (adults at 15 mg, children at 20 mg) for context. Adolescents at 15 mg
# round out the secondary claim ("adolescents also match the efficacious
# pediatric dose").
demo <- bind_rows(
  make_cohort(n_per_arm, "Adults",     73.2, 0.20, dose_mg = 20, id_offset =        0L),
  make_cohort(n_per_arm, "Adults",     73.2, 0.20, dose_mg = 15, id_offset =     1000L),
  make_cohort(n_per_arm, "Adolescents", 55.0, 0.20, dose_mg = 15, id_offset =     2000L),
  make_cohort(n_per_arm, "Children",    40.6, 0.20, dose_mg = 15, id_offset =     3000L),
  make_cohort(n_per_arm, "Children",    40.6, 0.20, dose_mg = 20, id_offset =     4000L)
)
stopifnot(!anyDuplicated(demo$id))
Simulation
A single d-ATS application is simulated over 96 hours to capture the
slow first-order absorption (Ka = 0.070 1/h, absorption half-life ~10 h)
and the subsequent flip-flop decline. The dose is loaded into the depot
compartment with rate = -2 so the model’s
dur(depot) declaration imposes the D1 zero-order release
window.
build_events <- function(demo, obs_times) {
  doses <- demo |>
    mutate(time = 0, amt = dose_mg, cmt = "depot",
           rate = -2, evid = 1L) |>
    select(id, time, amt, cmt, rate, evid, WT,
           age_group, dose_mg, treatment)

  obs <- demo |>
    select(id, WT, age_group, dose_mg, treatment) |>
    tidyr::crossing(time = obs_times) |>
    mutate(amt  = NA_real_,
           cmt  = "central",      # observe on an ODE state, not on the observable Cc
           rate = NA_real_,
           evid = 0L)

  bind_rows(doses, obs) |>
    arrange(id, time, desc(evid))
}

obs_times <- sort(unique(c(seq(0, 24, by = 0.25), seq(24, 96, by = 1))))
events <- build_events(demo, obs_times)
mod <- rxode2::rxode2(readModelDb("Castelli_2022_dextroamphetamine"))
#> ℹ parameter labels from comments will be replaced by 'label()'

sim <- rxode2::rxSolve(
  mod, events = events,
  keep = c("age_group", "dose_mg", "treatment", "WT")
) |> as.data.frame()
For deterministic typical-value replication (zero between-subject
variability), use rxode2::zeroRe().
mod_typical <- rxode2::zeroRe(mod)

demo_typical <- demo |>
  group_by(treatment) |>
  filter(id == min(id)) |>
  ungroup()
events_typical <- build_events(demo_typical, obs_times)

sim_typical <- rxode2::rxSolve(
  mod_typical, events = events_typical,
  keep = c("age_group", "dose_mg", "treatment", "WT")
) |> as.data.frame()
#> ℹ omega/sigma items treated as zero: 'etalcl', 'etalvc', 'etalka', 'etald1'
#> Warning: multi-subject simulation without without 'omega'
Replicate published figures
Figure 4 – dose-normalised amphetamine concentration over time
Castelli 2022 Figure 4 plots dose-normalised amphetamine concentration versus time for d-ATS in adults and children. The replication below divides each subject’s simulated concentration by the dose to remove the dose effect and summarises the 5th, 50th, and 95th percentiles by age group.
fig4_dat <- sim |>
  filter(treatment %in% c("Adults, 15 mg", "Children, 15 mg")) |>
  mutate(Cc_dn = Cc / dose_mg) |>
  group_by(time, age_group) |>
  summarise(
    Q05 = quantile(Cc_dn, 0.05, na.rm = TRUE),
    Q50 = quantile(Cc_dn, 0.50, na.rm = TRUE),
    Q95 = quantile(Cc_dn, 0.95, na.rm = TRUE),
    .groups = "drop"
  )

ggplot(fig4_dat, aes(time, Q50, colour = age_group, fill = age_group)) +
  geom_ribbon(aes(ymin = Q05, ymax = Q95), alpha = 0.20, colour = NA) +
  geom_line(linewidth = 0.7) +
  scale_x_continuous(breaks = seq(0, 96, by = 24)) +
  labs(x = "Time (h)",
       y = "Dose-normalised amphetamine (ng/mL per mg)",
       colour = "Age group", fill = "Age group",
       title = "Figure 4 -- dose-normalised d-ATS PK in adults and children",
       caption = "Replicates Figure 4 of Castelli 2022. 200 simulated subjects per age group at 15 mg.")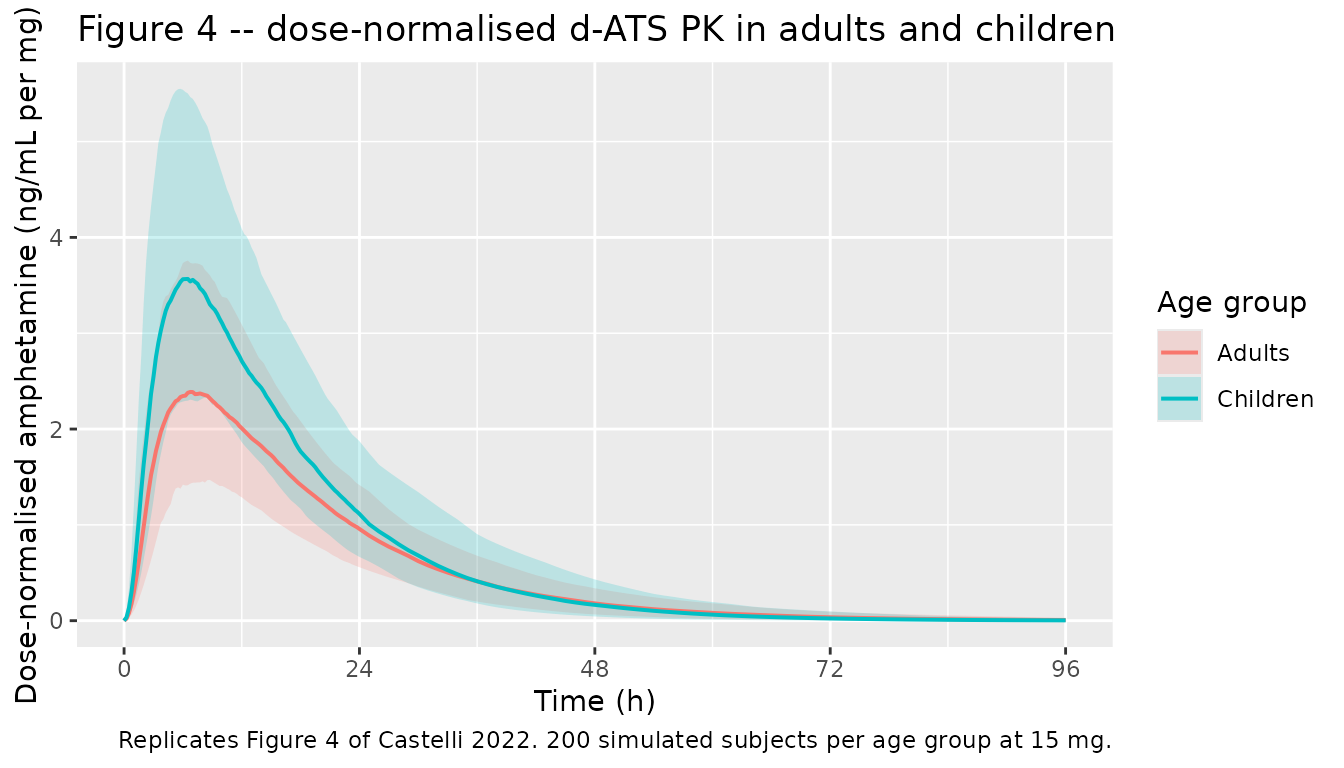
Replicates Figure 4 of Castelli 2022: dose-normalised amphetamine concentration over time for adults and children. The dashed lines are the 5th and 95th simulated percentiles; the solid line is the simulated median across 200 virtual subjects per age group at the 15 mg pediatric dose.
Figure 3 – exposure matching: adult 20 mg vs. pediatric 15 mg
Castelli 2022 Figure 3 box-plots simulated AUC and Cmax for adult subjects at 20 mg d-ATS against pediatric subjects at 15 mg, supporting the poster’s central conclusion that the two regimens deliver comparable exposure. The replication below uses the same exposures computed via PKNCA in the next section.
# Build a tibble of per-subject AUC and Cmax for the two key arms.
# Use trapezoidal integration over the 0-96 h observation window so the
# figure is self-contained; the next section uses PKNCA for the formal
# NCA values.
fig3_dat <- sim |>
  filter(treatment %in% c("Adults, 20 mg", "Children, 15 mg")) |>
  group_by(id, treatment, age_group, dose_mg) |>
  summarise(
    cmax     = max(Cc, na.rm = TRUE),
    auc_096h = sum(diff(time) * (head(Cc, -1) + tail(Cc, -1)) / 2),
    .groups  = "drop"
  ) |>
  pivot_longer(c(cmax, auc_096h),
               names_to = "metric", values_to = "value") |>
  mutate(metric = factor(metric,
                         levels = c("cmax", "auc_096h"),
                         labels = c("Cmax (ng/mL)", "AUC0-96h (ng*h/mL)")))

ggplot(fig3_dat, aes(x = treatment, y = value, fill = treatment)) +
  geom_boxplot(width = 0.5, alpha = 0.7) +
  facet_wrap(~ metric, scales = "free_y") +
  labs(x = NULL, y = NULL,
       title = "Figure 3 -- exposure matching: adult 20 mg vs. pediatric 15 mg",
       caption = "Replicates Figure 3 of Castelli 2022.") +
  theme(legend.position = "none",
        axis.text.x = element_text(angle = 0))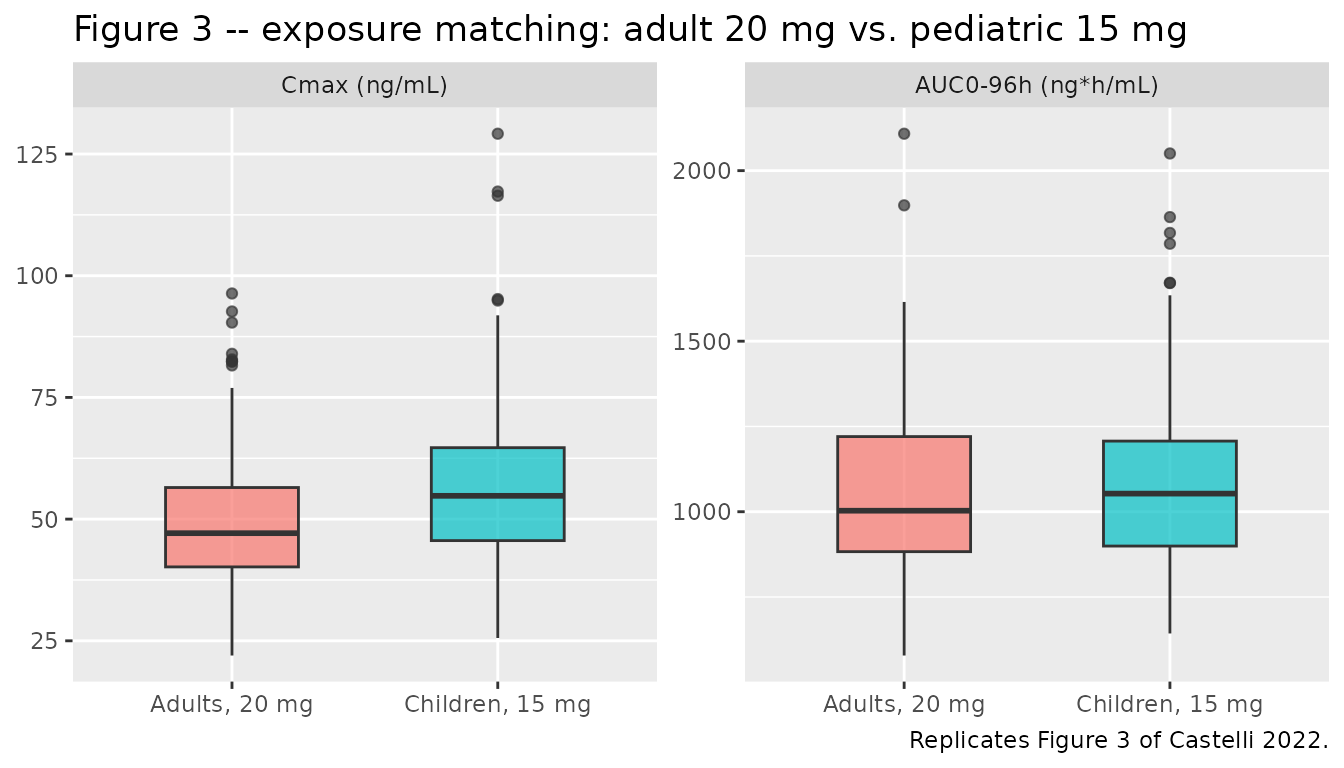
Replicates Figure 3 of Castelli 2022: simulated AUC0-inf.obs and Cmax box plots for adults at d-ATS 20 mg versus children at d-ATS 15 mg. The medians and inter-quartile ranges across 200 simulated subjects per arm are visually overlapping, reproducing the poster’s exposure-matching claim.
PKNCA validation
PKNCA computes Cmax, Tmax, AUC0-inf.obs, and the terminal half-life for each (age group, dose) combination. The treatment grouping variable carries the (age group, dose) identity through the formula so per-arm summaries can be compared between the adult and pediatric cohorts.
# Per-subject concentration table -- keep the column named Cc.
# Do NOT add `time > 0` or `Cc > 0` to the filter; both drop the
# time-zero row PKNCA needs to anchor AUC0-*.
sim_nca <- sim |>
  dplyr::filter(!is.na(Cc)) |>
  dplyr::select(id, time, Cc, treatment)

# Guarantee a time = 0 row per (id, treatment); pre-dose extravascular
# Cc = 0 is the correct value. (See pknca-recipes.md "Time-zero records".)
sim_nca <- bind_rows(
  sim_nca,
  sim_nca |> distinct(id, treatment) |> mutate(time = 0, Cc = 0)
) |>
  distinct(id, treatment, time, .keep_all = TRUE) |>
  arrange(id, treatment, time)

conc_obj <- PKNCA::PKNCAconc(sim_nca, Cc ~ time | treatment + id)

dose_df <- events |>
  dplyr::filter(evid == 1L) |>
  dplyr::select(id, time, amt, treatment)
dose_obj <- PKNCA::PKNCAdose(dose_df, amt ~ time | treatment + id)

intervals <- data.frame(
  start      = 0,
  end        = Inf,
  cmax       = TRUE,
  tmax       = TRUE,
  aucinf.obs = TRUE,
  half.life  = TRUE
)

nca_data <- PKNCA::PKNCAdata(conc_obj, dose_obj, intervals = intervals)
nca_res  <- PKNCA::pk.nca(nca_data)
Per-arm summary of simulated NCA exposures
nca_summary <- as.data.frame(nca_res$result) |>
  filter(PPTESTCD %in% c("cmax", "tmax", "aucinf.obs", "half.life")) |>
  group_by(treatment, PPTESTCD) |>
  summarise(median = median(PPORRES, na.rm = TRUE),
            p05    = quantile(PPORRES, 0.05, na.rm = TRUE),
            p95    = quantile(PPORRES, 0.95, na.rm = TRUE),
            .groups = "drop") |>
  mutate(value = sprintf("%.1f (%.1f, %.1f)", median, p05, p95)) |>
  select(treatment, PPTESTCD, value) |>
  pivot_wider(names_from = PPTESTCD, values_from = value) |>
  arrange(treatment) |>
  rename(`Cmax (ng/mL)`        = cmax,
         `Tmax (h)`             = tmax,
         `AUC0-inf.obs (ng*h/mL)` = aucinf.obs,
         `t1/2 (h)`             = half.life)

knitr::kable(
  nca_summary,
  caption = "Simulated d-ATS NCA exposures by treatment arm: median (5th, 95th percentile) across 200 virtual subjects per arm."
)| treatment | AUC0-inf.obs (ng*h/mL) | Cmax (ng/mL) | t1/2 (h) | Tmax (h) |
|---|---|---|---|---|
| Adolescents, 15 mg | 912.3 (649.5, 1287.0) | 46.3 (28.5, 73.4) | 9.6 (6.6, 13.0) | 6.5 (4.2, 10.0) |
| Adults, 15 mg | 807.1 (550.4, 1124.3) | 36.4 (22.9, 57.0) | 10.3 (6.9, 14.0) | 7.0 (4.5, 10.0) |
| Adults, 20 mg | 1004.3 (720.7, 1519.5) | 47.1 (28.3, 74.7) | 9.6 (7.5, 14.5) | 6.8 (4.8, 9.8) |
| Children, 15 mg | 1053.4 (754.0, 1527.5) | 54.8 (37.2, 83.6) | 8.6 (5.8, 12.2) | 6.2 (4.2, 9.5) |
| Children, 20 mg | 1397.3 (1009.8, 2001.8) | 74.3 (47.7, 109.3) | 8.6 (6.5, 11.1) | 6.2 (4.5, 9.2) |
Comparison: adult 20 mg vs. pediatric 15 mg
Castelli 2022 reports (Results / Conclusions): “Treatment with 20 mg d-ATS in adults produced exposures comparable to 15 mg in pediatric patients.” The simulated median AUC and Cmax ratios below quantify the overlap; the reference column is the pediatric 15 mg arm, and ratios near 1.0 confirm the exposure match.
median_table <- as.data.frame(nca_res$result) |>
  filter(PPTESTCD %in% c("cmax", "aucinf.obs")) |>
  group_by(treatment, PPTESTCD) |>
  summarise(median = median(PPORRES, na.rm = TRUE), .groups = "drop")

ped15 <- median_table |>
  filter(treatment == "Children, 15 mg") |>
  rename(reference_median = median) |>
  select(PPTESTCD, reference_median)

comparison <- median_table |>
  inner_join(ped15, by = "PPTESTCD") |>
  mutate(ratio = median / reference_median) |>
  filter(treatment %in% c("Adults, 20 mg", "Adolescents, 15 mg",
                          "Children, 15 mg")) |>
  mutate(PPTESTCD = factor(PPTESTCD, levels = c("cmax", "aucinf.obs"),
                           labels = c("Cmax", "AUC0-inf.obs"))) |>
  select(treatment, PPTESTCD, median, reference_median, ratio) |>
  arrange(PPTESTCD, treatment)

knitr::kable(
  comparison,
  digits = c(0, 0, 2, 2, 3),
  col.names = c("Treatment", "NCA parameter",
                "Simulated median", "Pediatric 15 mg median",
                "Ratio vs. pediatric 15 mg"),
  caption = "Exposure matching of adult 20 mg d-ATS and adolescent 15 mg d-ATS against the pediatric 15 mg reference (Castelli 2022 Conclusions): ratios near 1.0 reproduce the poster's exposure-matching claim."
)| Treatment | NCA parameter | Simulated median | Pediatric 15 mg median | Ratio vs. pediatric 15 mg |
|---|---|---|---|---|
| Adolescents, 15 mg | Cmax | 46.32 | 54.79 | 0.845 |
| Adults, 20 mg | Cmax | 47.11 | 54.79 | 0.860 |
| Children, 15 mg | Cmax | 54.79 | 54.79 | 1.000 |
| Adolescents, 15 mg | AUC0-inf.obs | 912.29 | 1053.41 | 0.866 |
| Adults, 20 mg | AUC0-inf.obs | 1004.34 | 1053.41 | 0.953 |
| Children, 15 mg | AUC0-inf.obs | 1053.41 | 1053.41 | 1.000 |
Assumptions and deviations
- Reference weight not stated in the poster. Castelli 2022 reports “weight effect estimates” for CL/F (0.47), V/F (0.53), and Ka (-0.29) in Table 1 but does not state the reference body weight used in the covariate equation. The library encodes the reference at 70 kg per the rounded-standard policy for an unreported adult-pediatric pooled reference (the pooled study median weight is approximately 66 kg). Using 70 kg vs. the precise pooled median introduces a systematic offset of order (70 / 66)^0.47 ~ 1.03 on adult CL/F at the pooled median (a ~3% bias), which is small relative to the IIV.
-
Power-law equation form assumed. The poster reports
the weight effects as point estimates with 95% CIs but does not state
the functional form. The library encodes the effects as power-law
exponents (
CL/F = 18.4 * (WT/70)^0.47,V/F = 51.9 * (WT/70)^0.53, andKa = 0.070 * (WT/70)^-0.29), which is the standard interpretation of a “weight effect estimate” in a full-covariate popPK model. A linear-deviation form (1 + e * (WT - 70)) cannot reconcile a negative effect estimate (-0.29 on Ka) with strictly positive predictions across the pediatric weight range, ruling that form out. -
Inter-occasion variability not encoded. Castelli
2022 Methods states “Inter-occasion variability was estimated for D1 and
bioavailability (F)” but does not report the IOV magnitudes in Table 1.
The library encodes only the inter-individual variability reported in
Table 1 (on CL/F, V/F, Ka, and D1) and drops the IOV terms. Adding back
IOV would require operator follow-up with the authors or an
OCCcovariate flag and additional eta blocks onld1/lfdepot; neither is in scope for a poster-derived library model. -
Residual error not reported. The poster does not
state the residual error model or its magnitude.
propSdis therefore encoded asfixed(0), so the model is suitable for typical-value and IIV-only forward simulation. Users who need a stochastic VPC should supply their own residual magnitude (a 10-25% proportional CV is typical for plasma amphetamine assays). -
Bioavailability anchor. The poster reports IOV on
the bioavailability F but does not report a typical-value F. Absolute F
is not identifiable from extravascular-only data; the library anchors
f(depot)at 1 per the standard apparent-parameter convention (CL/F, V/F). -
Concentration units. The poster reports parameter
values (CL/F in L/h, V/F in L, Ka in 1/h, D1 in h) without explicitly
stating the concentration unit. The library reports plasma amphetamine
in ng/mL, the standard PK assay unit and consistent with the dose-mg /
volume-L combination giving a 1000x conversion factor inside
model(). -
Sex and race not in
covariateData. Castelli 2022 reports a full-covariate-modeling approach with body weight pre-specified on CL/F, V/F, and Ka; no other covariates are listed in Table 1 as retained. Sex and race / ethnicity distributions are not reported in the poster either, so the virtual cohort does not attempt to mirror those characteristics. - Wear time not specified per study. The d-ATS patch label specifies a 9 h wear time, but Castelli 2022 pools data from six PK studies without stating the wear time used in each contributing study. The model’s D1 = 1.9 h is the estimated zero-order release duration; once the dose enters the depot within 1.9 h, the subsequent first-order absorption is independent of patch wear time, so the wear-time ambiguity does not affect the simulated PK after the first ~2 h.
- Adolescent weight median assumed at 55 kg. Castelli 2022 reports separate weight medians for adults (73.2 kg) and children (40.6 kg) but does not separately tabulate the adolescent (12 to <18 years) weight distribution; the simulation uses 55 kg as the adolescent weight median (intermediate between the child and adult medians).