Naloxone (Laffont 2024)
Source:vignettes/articles/Laffont_2024_naloxone.Rmd
Laffont_2024_naloxone.RmdModel and source
- Citation: Laffont CM, Purohit P, Delcamp N, Gonzalez-Garcia I, Skolnick P. Comparison of intranasal naloxone and intranasal nalmefene in a translational model assessing the impact of synthetic opioid overdose on respiratory depression and cardiac arrest. Front Psychiatry. 2024;15:1399803. doi:10.3389/fpsyt.2024.1399803. Q/F and Vp/F fixed to values from Yassen A, Olofsen E, van Dorp E, Sarton E, Teppema L, Danhof M, Dahan A. Mechanism-based pharmacokinetic-pharmacodynamic modelling of the reversal of buprenorphine-induced respiratory depression by naloxone. Clin Pharmacokinet. 2007;46(11):965-980. doi:10.2165/00003088-200746110-00004
- Description: Population PK model for intranasal (IN) naloxone HCl in healthy adult volunteers (Laffont 2024): two-compartment model with linear elimination and parallel zero-order plus lagged first-order absorption; Q/F and Vp/F fixed to literature values from Yassen 2007.
- Article: Front Psychiatry. 2024;15:1399803
Population
The IN naloxone population PK model in Laffont 2024 was developed using plasma concentration data from the pharmacodynamic remifentanil-induced respiratory depression study by Ellison et al. (Clin Pharmacol Drug Dev, 2024; ref 23 in Laffont 2024). Subjects were healthy adult volunteers receiving a single 4 mg IN naloxone HCl dose from the commercial nasal spray formulation under a hypercapnic gas mixture (50 % O2 / 43 % N2 / 7 % CO2) administered through a tight-fitting mask. The paper notes (Section 3.1) that the hypercapnic-mask conditions did not affect IN naloxone absorption during the first 20 minutes post dose when compared with published data in healthy volunteers (refs 10, 23), so the absorption parameters in Table 2 were used as-is for opioid-overdose rescue simulations. Detailed baseline demographics (N, age, sex, race) are given in Supplementary Table 2 of Laffont 2024, which is not on disk for this extraction.
The same information is available programmatically via
readModelDb("Laffont_2024_naloxone")$population.
Source trace
Per-parameter origin is recorded as an in-file comment next to each
ini() entry in
inst/modeldb/specificDrugs/Laffont_2024_naloxone.R. The
table below collects them for review.
| Equation / parameter | Value | Source location |
|---|---|---|
lcl (CL/F) |
log(396) L/h |
Table 2 |
lvc (Vc/F) |
log(65.7) L |
Table 2 |
lq (Q/F) |
fixed(log(284)) L/h |
Table 2 (fixed to value from Yassen et al. 2007 ref 30) |
lvp (Vp/F) |
fixed(log(102)) L |
Table 2 (fixed to value from Yassen et al. 2007 ref 30) |
lka (KA) |
log(0.998) 1/h |
Table 2 (first-order absorption rate constant) |
ld2 (D2) |
log(0.689) h |
Table 2 (zero-order absorption duration) |
lfk0 (FK0) |
log(0.183) |
Table 2 (fraction of dose with zero-order absorption) |
lalag1 (ALAG1) |
log(0.0717) h |
Table 2 (first-order absorption lag time) |
etalcl IIV |
log(1 + 0.391^2) |
Table 2: IIV CL/F = 39.1 %CV |
etalvc IIV |
log(1 + 2.40^2) |
Table 2: IIV Vc/F = 240 %CV |
etalfk0 IIV |
log(1 + 1.51^2) |
Table 2: IIV FK0 = 151 %CV |
propSd (residual) |
0.323 |
Table 2: sigma^2 = 0.104 (32.3 %CV); log-additive in NONMEM == proportional in linear space |
| Structure | n/a | Section 3.1 Pharmacokinetic submodels: 2-compartment with linear elimination, parallel zero-order plus first-order absorption with lag on the first-order component |
No covariates were retained in the IN naloxone final model (paper Section 3.1 states that body weight was significant only on nalmefene CL/F, not naloxone).
Virtual cohort
Original observed data are not publicly available. The cohort below uses 200 virtual healthy adults receiving a single 4 mg IN naloxone HCl dose (the commercial 4 mg / 0.1 mL nasal spray) at time 0 with plasma sampling out to 12 hours.
set.seed(20260509)
n_subj <- 200

cohort <- tibble(id = seq_len(n_subj))

# rxode2 dosing convention for parallel zero-order + first-order absorption:
#   - row 1: dose to depot (first-order absorption, normal bolus)
#   - row 2: dose to central with rate = -2 (uses modeled dur(central) = D2)
# Both rows share the same time and the same total amt (4 mg HCl).
dose_amt_mg <- 4.0

doses <- bind_rows(
  cohort %>% mutate(time = 0, evid = 1L, amt = dose_amt_mg, rate = 0,  cmt = "depot"),
  cohort %>% mutate(time = 0, evid = 1L, amt = dose_amt_mg, rate = -2, cmt = "central")
)

obs_times <- c(seq(0.05, 1, by = 0.05),
               seq(1.5, 4, by = 0.25),
               seq(4.5, 12, by = 0.5))
obs <- cohort %>%
  tidyr::crossing(time = obs_times) %>%
  mutate(evid = 0L, amt = NA_real_, rate = 0, cmt = "depot")

events <- bind_rows(doses, obs) %>%
  arrange(id, time, desc(evid)) %>%
  select(id, time, evid, amt, rate, cmt)
Simulation
mod <- readModelDb("Laffont_2024_naloxone")
sim <- rxode2::rxSolve(mod, events = events) %>%
  as.data.frame()
#> ℹ parameter labels from comments will be replaced by 'label()'
A typical-value (no between-subject variability) curve is also generated for visualizing the deterministic model prediction:
mod_typical <- mod |> rxode2::zeroRe()
#> ℹ parameter labels from comments will be replaced by 'label()'
sim_typical <- rxode2::rxSolve(
  mod_typical,
  events = events %>% filter(id == 1)
) %>% as.data.frame()
#> ℹ omega/sigma items treated as zero: 'etalcl', 'etalvc', 'etalfk0'
Replicate published profile
The paper does not publish a numeric concentration-time table for IN naloxone, but the structural form (2-compartment + parallel zero-order/first-order absorption with lag) is described in Section 3.1 and illustrated qualitatively by Supplementary Figure 3 (visual predictive check). The simulated profile below shows the typical-value curve and a 5th-95th percentile ribbon over the virtual cohort following a single 4 mg IN naloxone HCl dose.
sim %>%
  group_by(time) %>%
  summarise(
    Q05 = quantile(Cc, 0.05, na.rm = TRUE),
    Q50 = quantile(Cc, 0.50, na.rm = TRUE),
    Q95 = quantile(Cc, 0.95, na.rm = TRUE),
    .groups = "drop"
  ) %>%
  ggplot(aes(time, Q50)) +
  geom_ribbon(aes(ymin = Q05, ymax = Q95), alpha = 0.25) +
  geom_line() +
  geom_line(
    data = sim_typical, aes(time, Cc),
    inherit.aes = FALSE, linetype = "dashed"
  ) +
  labs(x = "Time (h)", y = "Plasma naloxone (ng/mL)",
       title = "Simulated plasma profile, single 4 mg IN naloxone HCl",
       caption = "Solid line = median of 200 virtual subjects; ribbon = 5th-95th percentiles; dashed = typical-value (zeroRe) curve.")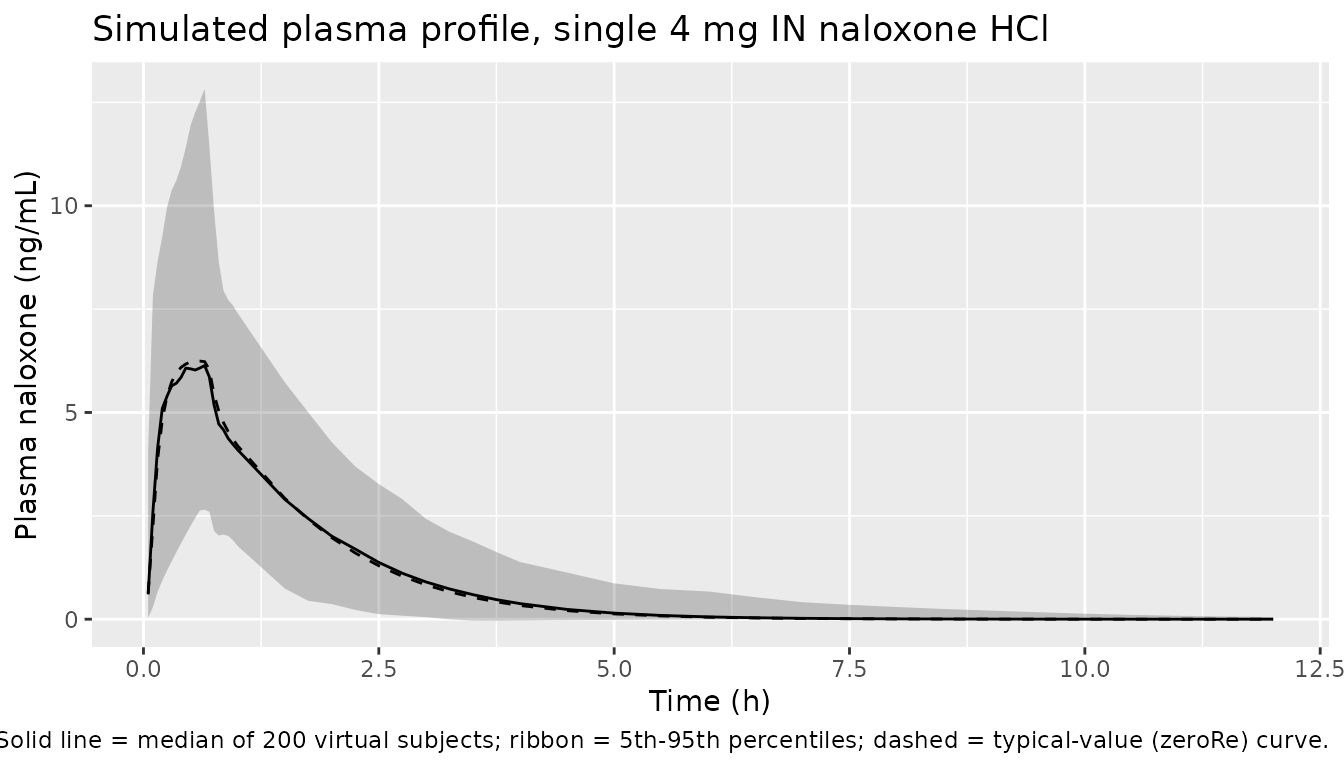
PKNCA validation
Use PKNCA to compute Cmax, Tmax, AUC0-inf, and terminal half-life on each virtual subject’s simulated profile. The treatment grouping variable is the fixed regimen “IN_4mg”.
sim_nca <- sim %>%
  mutate(treatment = "IN_4mg") %>%
  filter(!is.na(Cc)) %>%
  select(id, time, Cc, treatment)

conc_obj <- PKNCA::PKNCAconc(sim_nca, Cc ~ time | treatment + id)
#> Warning in assert_conc(conc, any_missing_conc = any_missing_conc): Negative
#> concentrations found

dose_df <- doses %>%
  filter(cmt == "depot") %>%
  mutate(treatment = "IN_4mg") %>%
  select(id, time, amt, treatment)

dose_obj <- PKNCA::PKNCAdose(dose_df, amt ~ time | treatment + id)

intervals <- data.frame(
  start      = 0,
  end        = Inf,
  cmax       = TRUE,
  tmax       = TRUE,
  aucinf.obs = TRUE,
  half.life  = TRUE
)

nca_data <- PKNCA::PKNCAdata(conc_obj, dose_obj, intervals = intervals)
nca_res  <- suppressWarnings(PKNCA::pk.nca(nca_data))

knitr::kable(
  summary(nca_res),
  caption = "Simulated NCA parameters for a single 4 mg IN naloxone HCl dose."
)| start | end | treatment | N | cmax | tmax | half.life | aucinf.obs |
|---|---|---|---|---|---|---|---|
| 0 | Inf | IN_4mg | 200 | 6.30 [48.9] | 0.650 [0.150, 1.75] | 0.770 [0.277] | NC |
Comparison against published values
Laffont 2024 does not report numeric Cmax / AUC for IN naloxone, but the Discussion (page 10) cites a plasma half-life of approximately 2 hours (refs 22, 45). The simulated terminal half-life from PKNCA above should fall near that value. The Q/F and Vp/F fixed values from Yassen et al. 2007 give this model a moderate-sized peripheral compartment (Vp/F = 102 L), consistent with the rapid distribution and short terminal phase reported for naloxone.
Assumptions and deviations
-
Q/F and Vp/F fixed to literature values (Yassen et
al. 2007). Laffont 2024 Table 2 reports these as “fixed” – the
population estimation could not identify them from the IN-only Ellison
2024 dataset, so they were carried in from the IV naloxone analysis of
Yassen et al. (Clin Pharmacokinet 2007;46(11):965-980). The Yassen 2007
citation is reproduced verbatim in the model file’s
referencefield so the dependency is visible in?modellib. No upstream nlmixr2lib model exists for Yassen 2007 at the time of extraction. -
No covariates retained in final model. Laffont 2024
Section 3.1 states that body weight was a significant covariate on
nalmefene CL/F but not on naloxone CL/F; no other covariates were
retained. The
Laffont_2024_naloxonemodel has no covariate inputs. -
Detailed baseline demographics deferred to Supplementary
Table 2. N, age range, sex balance, race distribution, and
median weight are in Supplementary Table 2, which is not on disk; the
populationmetadata carries TODO markers for those fields. - No native PD layer in this model file. Laffont 2024 expands the Mann et al. 2022 translational model (mu-opioid receptor competitive binding, ventilatory drives, gas exchange, blood-flow control) using the IN naloxone PK developed here as the input. That mechanistic PD layer is deterministic, has no IIV / residual error, sources its binding parameters from a separate paper (Cassel et al. 2005), and is hosted as a C-coded GitHub project external to the paper. It is out of scope for nlmixr2lib’s population-PK library; users who need the PD respiratory-depression / cardiac-arrest endpoint should follow the GitHub link in the Laffont 2024 Methods Section 2.1.