Desmopressin (Schutte 2018)
Source:vignettes/articles/Schutte_2018_desmopressin.Rmd
Schutte_2018_desmopressin.RmdModel and source
- Citation: Schutte LM, van Hest RM, Stoof SCM, Leebeek FWG, Cnossen MH, Kruip MJHA, Mathot RAA. Pharmacokinetic Modelling to Predict FVIII:C Response to Desmopressin and Its Reproducibility in Nonsevere Haemophilia A Patients. Thromb Haemost 2018;118(3):621-629.
- Article: https://doi.org/10.1160/TH17-06-0390
- Description: Two-compartment apparent population PK model of endogenous factor VIII coagulant activity (FVIII:C) following a desmopressin (DDAVP) administration in nonsevere haemophilia A patients. The administered intervention is desmopressin; the apparent PK parameters describe the resulting endogenous FVIII:C release as if it were a unit-dose drug input. The covariate FVIIIRECENT (most recently measured FVIII:C, IU/mL) acts on baseline FVIII, V1, and CL.
Population
Schutte 2018 is a single-centre retrospective cohort drawn from nonsevere haemophilia A patients at the Erasmus University Medical Centre, Rotterdam (Schutte 2018 Patients and Methods). The PK dataset comprises 623 FVIII:C measurements from 142 desmopressin administrations in 128 patients (14 of whom contributed two administrations on separate occasions). Median age was 28 years (range 7-75; 24% below 18 years), median body weight 75 kg (range 26-120). The cohort is essentially male because haemophilia A is X-linked recessive. Disease severity: 84% mild (n = 107) and 16% moderate (n = 21) HA. Desmopressin was administered intravenously over 30 minutes at 0.3 micrograms/kg in 92% of administrations and intranasally as a 300-microgram fixed dose in the remaining 8% (Schutte 2018 Desmopressin Administration; Table 1).
Demographic baselines relevant to the model: FVIII-lowest (the lowest
ever recorded FVIII:C activity per patient) had median 0.10 IU/mL
(interquartile range 0.04-0.18, n = 128). FVIII-recent (the most recent
FVIII:C measurement obtained at most 1 day before desmopressin) had
median 0.15 IU/mL (interquartile range 0.08-0.24, n = 120). FVIII-recent
was the only covariate retained in the final model; the multivariate
analysis preferred FVIII-recent over FVIII-lowest because nonsevere HA
patients accumulate FVIII activity gradually over years (Schutte 2018
Discussion). The same information is available programmatically via the
model’s population metadata
(readModelDb("Schutte_2018_desmopressin")$population after
the model is loaded).
Source trace
Per-parameter origin is also recorded as an in-file comment next to
each ini() entry in
inst/modeldb/specificDrugs/Schutte_2018_desmopressin.R. The
table below collects them in one place for review.
| Equation / parameter | Value | Source location |
|---|---|---|
lka (= log ka) |
log(3.8 1/h) | Schutte 2018 Table 2, Final-model column |
lcl (= log CL/F) |
log(0.26 L/h) | Schutte 2018 Table 2, Final-model column |
lvc (= log V1/F) |
log(1.7 L) | Schutte 2018 Table 2, Final-model column |
lq (= log Q/F) |
log(0.11 L/h) | Schutte 2018 Table 2, Final-model column |
lvp (= log V2/F) |
log(0.24 L) | Schutte 2018 Table 2, Final-model column |
lbase_fviii (= log typical baseline FVIII at
FVIIIRECENT = 0.15) |
log(0.15 IU/mL) | Schutte 2018 Table 2, Final-model column |
e_fviiirecent_base |
+0.74 | Schutte 2018 Table 2, FVIII recent on baseline (Eq. 1) |
e_fviiirecent_vc |
-0.61 | Schutte 2018 Table 2, FVIII recent on V1 (Eq. 3) |
e_fviiirecent_cl |
-0.73 | Schutte 2018 Table 2, FVIII recent on CL (Eq. 2) |
IIV etalbase_fviii
|
37% CV (var = log(1 + 0.37^2) = 0.1283) | Schutte 2018 Table 2, IIV Baseline FVIII |
IIV etalvc
|
43% CV (var = log(1 + 0.43^2) = 0.1697) | Schutte 2018 Table 2, IIV V1 |
IIV etalcl
|
50% CV (var = log(1 + 0.50^2) = 0.2231) | Schutte 2018 Table 2, IIV CL |
| correlation(etalbase_fviii, etalvc) | -0.87 (cov = -0.1284) | Schutte 2018 Table 2, Correlation IIV baseline FVIII and IIV V1 |
propSd |
12% | Schutte 2018 Table 2, Proportional error |
addSd |
0.018 IU/mL | Schutte 2018 Table 2, Additive error |
| Two-compartment structure with first-order absorption | n/a | Schutte 2018 Population Pharmacokinetic Modelling; Fig. 3 |
| FVIII:C = baseline + apparent increase | n/a | Schutte 2018 Population Pharmacokinetic Modelling (paragraph 2: “FVIII:C increase … was added to the estimated baseline FVIII:C”) |
| Reference value FVIIIRECENT = 0.15 IU/mL | n/a | Schutte 2018 Table 1 (population median FVIII-recent) |
Virtual cohort
Original observed data are not publicly available. The cohort below
approximates the Schutte 2018 demographics for FVIIIRECENT (median 0.15
IU/mL, IQR 0.08-0.24 from Table 1). FVIIIRECENT is sampled from a
log-normal distribution whose median and IQR match the published values;
the fit is
FVIIIRECENT_i = exp(rnorm(n, mean = log(0.15), sd = 0.815)),
with sd chosen so that the 25th-75th percentile ratio
matches the reported IQR of 0.24 / 0.08 = 3.0.
set.seed(20180330)
n_subjects <- 200

cohort <- tibble(
  id = seq_len(n_subjects),
  FVIIIRECENT = exp(rnorm(n_subjects, mean = log(0.15), sd = 0.815))
)

# Truncate to a plausible range (the paper's observed range was effectively
# 0.01 - 0.50 IU/mL; nonsevere HA patients by definition have FVIII >= 0.01).
cohort$FVIIIRECENT <- pmax(pmin(cohort$FVIIIRECENT, 0.50), 0.01)

# Observation grid: 10-minute spacing for 24 h to match the paper's
# individual FVIII:C response time grid (Schutte 2018 FVIII:C Response).
obs_times <- seq(0, 24, by = 1/6)

events <- bind_rows(
  cohort %>% mutate(time = 0, evid = 1, amt = 1, cmt = "depot"),
  cohort %>%
    tidyr::expand_grid(time = obs_times) %>%
    mutate(evid = 0, amt = NA_real_, cmt = NA_character_)
) %>%
  arrange(id, time, desc(evid))
Simulation
mod <- readModelDb("Schutte_2018_desmopressin")

# Stochastic simulation with full IIV (etalbase_fviii, etalvc, etalcl) for
# variability assessments (cohort half-life distribution, duration of
# response, etc.).
sim <- rxode2::rxSolve(mod, events = events, keep = "FVIIIRECENT") |>
  as.data.frame()
#> ℹ parameter labels from comments will be replaced by 'label()'
For deterministic curves (typical-value replication of Figure 4), zero out the random effects:
mod_typical <- mod |> rxode2::zeroRe()
#> ℹ parameter labels from comments will be replaced by 'label()'
Replicate published figures
Figure 4: typical FVIII:C response by FVIII-recent quantile
Schutte 2018 Figure 4 plots typical-value FVIII:C response-time curves for five patients differing only in their FVIIIRECENT value, set to the 5th, 25th, 50th, 75th, and 95th percentile of the study cohort’s FVIII-recent distribution. The corresponding values from Table 1 / Figure 4 caption are 0.04, 0.08, 0.15, 0.24, and 0.47 IU/mL.
fviii_quantiles <- tibble(
  percentile = c("5th", "25th", "50th", "75th", "95th"),
  FVIIIRECENT = c(0.04, 0.08, 0.15, 0.24, 0.47)
) %>%
  mutate(percentile = factor(percentile, levels = c("5th", "25th", "50th", "75th", "95th")))

fig4_events <- bind_rows(
  fviii_quantiles %>% mutate(id = seq_len(n()), time = 0, evid = 1, amt = 1, cmt = "depot"),
  fviii_quantiles %>%
    mutate(id = seq_len(n())) %>%
    tidyr::expand_grid(time = obs_times) %>%
    mutate(evid = 0, amt = NA_real_, cmt = NA_character_)
) %>%
  arrange(id, time, desc(evid))

fig4_sim <- rxode2::rxSolve(mod_typical, events = fig4_events,
                            keep = c("FVIIIRECENT", "percentile")) |>
  as.data.frame()
#> ℹ omega/sigma items treated as zero: 'etalbase_fviii', 'etalvc', 'etalcl'
#> Warning: multi-subject simulation without without 'omega'

ggplot(fig4_sim, aes(time, Cc, colour = percentile, group = percentile)) +
  geom_line(linewidth = 0.9) +
  geom_hline(yintercept = c(0.30, 0.50), linetype = "dashed", alpha = 0.4) +
  scale_x_continuous(breaks = seq(0, 24, by = 4)) +
  labs(x = "Time (h)", y = "FVIII:C (IU/mL)",
       colour = "FVIII-recent percentile",
       title = "Figure 4: typical FVIII:C response curves",
       caption = "Replicates Schutte 2018 Figure 4. Dashed lines: 0.30 and 0.50 IU/mL thresholds.")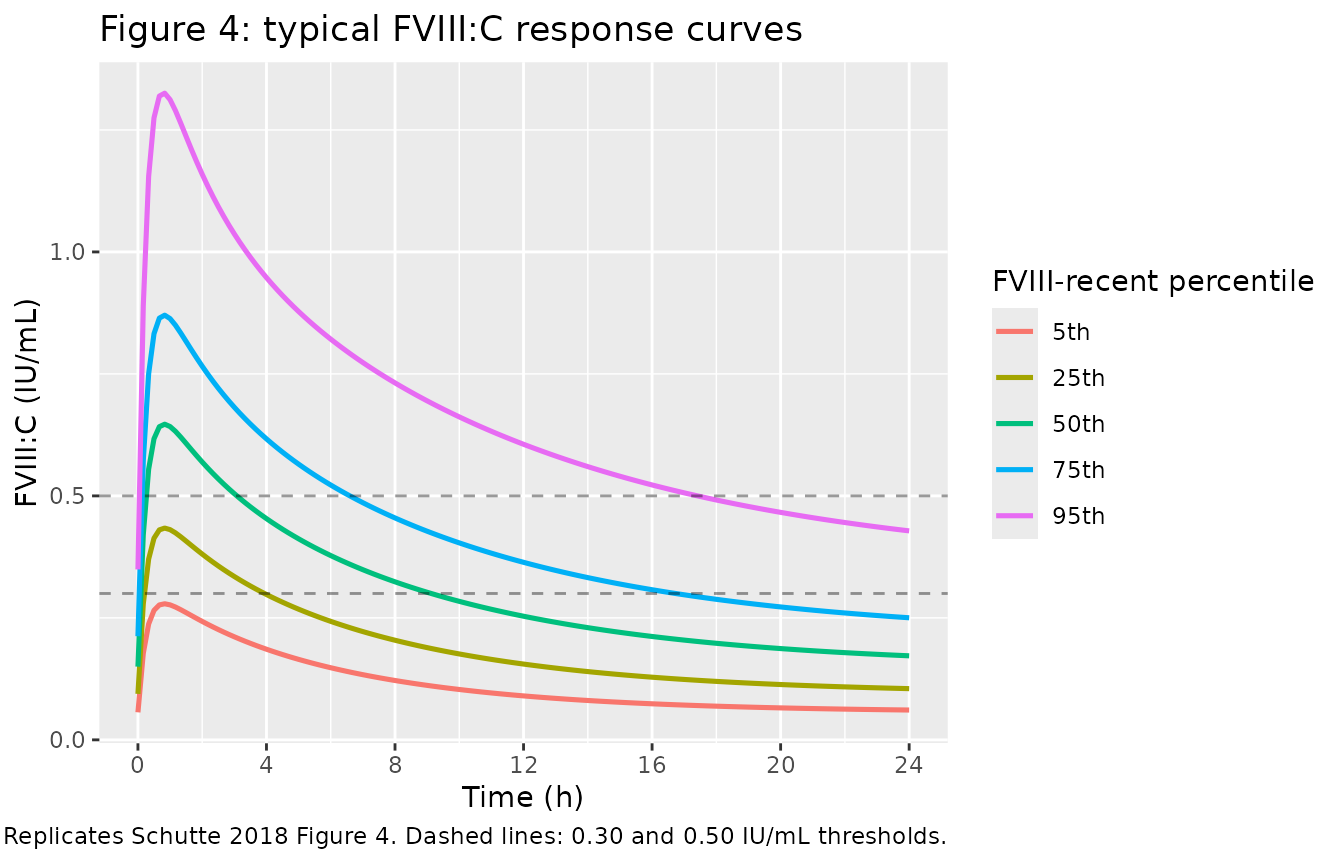
PKNCA validation
For this model the meaningful NCA quantity is the FVIII:C
increase above baseline (the apparent rxode2
concentration central / vc), which is what the source paper
reports as absolute increase, half-life, and
duration of response. PKNCA is applied to the increase
rather than to the total observed FVIII:C so that the AUC and half-life
are interpretable on the dose-driven perturbation directly.
sim_nca <- sim %>%
  mutate(Cc_increase = pmax(Cc - base_fviii, 0)) %>%
  dplyr::filter(time > 0) %>%
  dplyr::select(id, time, Cc_increase, FVIIIRECENT)

conc_obj <- PKNCA::PKNCAconc(sim_nca, Cc_increase ~ time | id)

dose_df <- events %>%
  dplyr::filter(evid == 1) %>%
  dplyr::select(id, time, amt) %>%
  dplyr::left_join(cohort %>% dplyr::select(id, FVIIIRECENT), by = "id")

dose_obj <- PKNCA::PKNCAdose(dose_df, amt ~ time | id)

intervals <- data.frame(
  start      = 0,
  end        = Inf,
  cmax       = TRUE,
  tmax       = TRUE,
  aucinf.obs = TRUE,
  half.life  = TRUE
)

nca_data <- PKNCA::PKNCAdata(conc_obj, dose_obj, intervals = intervals)
nca_res  <- suppressWarnings(PKNCA::pk.nca(nca_data))

nca_wide <- as.data.frame(nca_res$result) %>%
  dplyr::select(id, PPTESTCD, PPORRES) %>%
  tidyr::pivot_wider(names_from = PPTESTCD, values_from = PPORRES)
Comparison against published metrics
Schutte 2018 reports (Results, FVIII:C Response to Desmopressin):
- Median absolute increase in FVIII:C: 0.47 IU/mL (IQR 0.32-0.65; n = 142)
- Median half-life of FVIII:C: 5.8 h (IQR 4.2-7.9)
- Median duration FVIII:C > 0.30 IU/mL: 9.8 h (IQR 4.3-22.6); 90% of administrations exceed 0.30
- Median duration FVIII:C > 0.50 IU/mL: 4.8 h (IQR 2.1-10.7); 63% of administrations exceed 0.50
The simulated cohort gives:
duration_above <- function(t, x, threshold) {
  above <- x > threshold
  if (!any(above)) return(0)
  dt <- diff(c(t, max(t)))
  sum(dt[above[-length(above)]])
}

per_subject <- sim %>%
  dplyr::filter(time > 0) %>%
  dplyr::group_by(id, FVIIIRECENT) %>%
  dplyr::summarise(
    peak_total    = max(Cc),
    peak_increase = max(Cc - base_fviii),
    dur_above_030 = duration_above(time, Cc, 0.30),
    dur_above_050 = duration_above(time, Cc, 0.50),
    .groups = "drop"
  ) %>%
  dplyr::left_join(
    nca_wide %>% dplyr::select(id, half.life),
    by = "id"
  )

# Paper's duration medians are conditional on subjects whose peak FVIII:C
# exceeded the threshold (Results paragraph: "FVIII:C remained above 0.50
# IU/mL in these patients [the 63% exceeding 0.50] for a median time of 4.8
# hours"). Reproduce the conditional medians here.
dur_030 <- per_subject %>% dplyr::filter(peak_total > 0.30) %>% dplyr::pull(dur_above_030)
dur_050 <- per_subject %>% dplyr::filter(peak_total > 0.50) %>% dplyr::pull(dur_above_050)

q <- function(x, p) {
  if (length(x) == 0) return(NA_real_)
  round(stats::quantile(x, p, na.rm = TRUE), 2)
}
qrange <- function(x) paste(q(x, 0.25), "-", q(x, 0.75))

comparison <- tibble::tribble(
  ~metric,                                              ~paper_median, ~paper_iqr,            ~sim_median,                             ~sim_iqr,
  "Absolute FVIII:C increase (IU/mL)",                  0.47,          "0.32 - 0.65",         q(per_subject$peak_increase, 0.50),      qrange(per_subject$peak_increase),
  "Half-life of FVIII:C increase (h)",                  5.8,           "4.2 - 7.9",           q(per_subject$half.life,      0.50),     qrange(per_subject$half.life),
  "Duration FVIII:C > 0.30 IU/mL (h) (conditional)",    9.8,           "4.3 - 22.6",          q(dur_030,                    0.50),     qrange(dur_030),
  "Duration FVIII:C > 0.50 IU/mL (h) (conditional)",    4.8,           "2.1 - 10.7",          q(dur_050,                    0.50),     qrange(dur_050)
)
knitr::kable(comparison, caption = "Simulated vs Schutte 2018 published medians (Results section). Duration medians are conditional on peak FVIII:C exceeding the threshold, matching the paper's reporting convention.")| metric | paper_median | paper_iqr | sim_median | sim_iqr |
|---|---|---|---|---|
| Absolute FVIII:C increase (IU/mL) | 0.47 | 0.32 - 0.65 | 0.46 | 0.34 - 0.68 |
| Half-life of FVIII:C increase (h) | 5.80 | 4.2 - 7.9 | 5.43 | 3.77 - 8.28 |
| Duration FVIII:C > 0.30 IU/mL (h) (conditional) | 9.80 | 4.3 - 22.6 | 9.17 | 5 - 23.83 |
| Duration FVIII:C > 0.50 IU/mL (h) (conditional) | 4.80 | 2.1 - 10.7 | 4.67 | 2 - 10.67 |
pct_above_030 <- round(mean(per_subject$peak_total > 0.30) * 100, 0)
pct_above_050 <- round(mean(per_subject$peak_total > 0.50) * 100, 0)
In the virtual cohort, 90% of administrations exceed peak FVIII:C 0.30 IU/mL (paper: 90%) and 66% exceed peak FVIII:C 0.50 IU/mL (paper: 63%).
Assumptions and deviations
-
Unit dose abstraction. The source paper fixed the
desmopressin dose to unity because no FVIII concentrate was
administered; the structural parameters are therefore apparent (CL/F,
V1/F, V2/F, Q/F) and the model is simulated by dosing 1 unit into the
depotcompartment. The route of administration (IV vs intranasal) is not distinguished – Schutte 2018 lumps both into a single ka and so does this model file. -
FVIIIRECENT missing-data branch not encoded.
Schutte 2018 Eqs. 1-3 define a different covariate form when the
patient’s FVIIIRECENT value was unavailable for the fitted occasion:
baseline FVIII = 0.15 * 1.2 (no FVIIIRECENT dependence), V1 = 1.7 * 1.1,
CL = 0.26 * 0.78 (Table 2 final-model column). This branch is documented
here but is NOT implemented in
model(); simulation users are expected to supply a FVIIIRECENT value for every simulated subject. If reproducing a missing-FVIIIRECENT subgroup is required, set FVIIIRECENT to its reference value (0.15) and multiply the typical-value outputs by the correction factors above. - CL correction factor 0.78 vs 0.77 typo. Schutte 2018 Table 2 reports the missing-FVIIIRECENT correction factor on CL as 0.78 (RSE 17%), but Eq. 2 in the body text shows 0.77 in the analogous position. We treat the parameter-table value (0.78) as authoritative because it is the primary parameter report; the 0.77 in the equation is most likely a transcription typo. Since the missing-FVIIIRECENT branch is documented-only (not encoded), the choice has no effect on simulation.
- Inter-occasion variability omitted. Schutte 2018 Table 2 reports intra-individual (between-occasion) variability of 38% on baseline FVIII and 38% on V1 (final-model column). nlmixr2lib models conventionally encode IIV but not IOV; the same convention applies in the analogous Nestorov_2014_factorviii FVIII model. Single-occasion simulations from this model will under-represent the per-patient variability that the original fit characterised, but typical-value predictions and population summaries are not affected.
-
PKNCA half-life is on the apparent FVIII:C increase, not on
the total observed FVIII:C. Total observed FVIII:C does not
return to zero (it returns to the baseline FVIII), so a half-life
computed on Cc would mix the baseline plateau with the decline phase.
The paper’s reported “half-life of FVIII:C” is on the increase above
baseline (see Schutte 2018 Discussion paragraph on half-life), so we
apply PKNCA to
Cc - base_fviiito match. The simulated terminal half-life is computed by PKNCA via log-linear regression on the late-phase samples; this can deviate from the paper’s Bayesian individual-estimate-derived half-life because the late-phase signal of the increase is small (close to or below the additive residual error) for patients with low FVIIIRECENT. - Cohort size and FVIIIRECENT distribution. The virtual cohort uses 200 subjects with FVIIIRECENT sampled from a log-normal distribution matching the published median (0.15 IU/mL) and IQR (0.08-0.24 IU/mL) from Schutte 2018 Table 1. The original observed cohort is 128 subjects with 142 administrations; the larger simulated n is to reduce Monte Carlo noise in the simulated medians, not to extend the population beyond its source.