Phenobarbital (Grasela 1985)
Source:vignettes/articles/Grasela_1985_phenobarbital.Rmd
Grasela_1985_phenobarbital.RmdModel and source
- Citation: Grasela TH Jr, Donn SM (1985). Neonatal population pharmacokinetics of phenobarbital derived from routine clinical data. Developmental Pharmacology and Therapeutics 8(6):374-383. doi:10.1159/000457062. PMID:4075936.
- Description: One-compartment population PK model for phenobarbital in preterm neonates (Grasela & Donn 1985), derived from routine clinical data via NONMEM.
- Article: Dev Pharmacol Ther 8(6):374-383
- PubMed: PMID 4075936
Population
Grasela and Donn (1985) analyzed routine clinical pharmacokinetic samples from 59 preterm neonates who received phenobarbital. The cohort was characterized by birth weights between 0.600 and 3.620 kg (mean 1.520 kg) and gestational ages between 24 and 42 weeks (mean 31 weeks). The data were fit with NONMEM in what was one of the earliest population pharmacokinetic analyses of routine clinical data. The abstract does not report cohort sex distribution, race/ethnicity, dosing regimens, postnatal-age range, or the geographic location of the neonatal intensive care unit.
The same information is available programmatically via the model’s
population metadata
(readModelDb("Grasela_1985_phenobarbital")$population).
Source trace
The per-parameter origin is recorded as an in-file comment next to
each ini() entry in
inst/modeldb/specificDrugs/Grasela_1985_phenobarbital.R.
The table below collects them in one place for review.
| Equation / parameter | Value | Source location |
|---|---|---|
| Typical CL (weight-normalized) | 0.0047 L/h/kg | Abstract Results sentence “The mean (+/- CV) clearance … 0.0047 liter/h/kg (+/- 19%)” |
| Typical V (weight-normalized) | 0.96 L/kg | Abstract Results sentence “the mean (+/- CV) volume of distribution (Vd) was 0.96 liter/kg (+/- 16%)” |
| IIV on CL (CV) | 19% | Abstract Results (same sentence as CL above) |
| IIV on V (CV) | 16% | Abstract Results (same sentence as V above) |
| Effect of ASPHYXIA on V | +13% (linear-deviation) | Abstract Results sentence “Vd … was increased by 13% in the presence of asphyxia (5-min Apgar score less than 5, p less than 0.05)” |
| Effect of ASPHYXIA on CL | none retained | Abstract Results sentence “Clearance was not affected by gestational age, sex, asphyxia, or duration of therapy” |
| Residual error (RUV) | NOT REPORTED (encoded as fixed 0) | Abstract: not reported (see Errata) |
| Structural model: one-compartment with linear elimination | n/a | Abstract Results: only CL and V are reported, with a derived mean serum half-life of 141 h |
| Weight scaling exponent on CL and V | 1 (linear, per-kg) | Abstract reports per-kg typical values (L/h/kg and L/kg), i.e., no allometry |
Virtual cohort
The original observed data from Grasela & Donn (1985) are not publicly available. The figures below use a small deterministic virtual cohort with the cohort-mean body weight (1.520 kg) stratified by perinatal asphyxia status to illustrate the model’s typical-value predictions and to verify the abstract’s reported mean serum half-life of 141 h.
# Two single-subject strata at the cohort-mean body weight: with vs without
# perinatal asphyxia (ASPHYXIA = 1 vs ASPHYXIA = 0). A single 30 mg IV
# loading dose at t = 0 (~20 mg/kg at WT = 1.52 kg, the upper end of the
# clinically typical 15-20 mg/kg neonatal phenobarbital loading regimen)
# into the central compartment, followed by dense observations through 360 h
# (~2.5 half-lives) so the typical-value half-life is well-identified.

make_subject <- function(id, asphyxia, wt = 1.520, dose = 30, t_max = 360) {
  obs_times <- c(0, sort(c(seq(0.5, 24, by = 0.5), seq(36, t_max, by = 12))))
  dose_row <- tibble(
    id   = id,
    time = 0,
    evid = 1L,
    amt  = dose,
    cmt  = "central",
    WT   = wt,
    ASPHYXIA = asphyxia
  )
  obs_rows <- tibble(
    id   = id,
    time = obs_times,
    evid = 0L,
    amt  = NA_real_,
    cmt  = "central",
    WT   = wt,
    ASPHYXIA = asphyxia
  )
  bind_rows(dose_row, obs_rows) |> arrange(time, desc(evid))
}

events <- bind_rows(
  make_subject(id = 1L, asphyxia = 0L) |> mutate(stratum = "Apgar5 >= 5 (no asphyxia)"),
  make_subject(id = 2L, asphyxia = 1L) |> mutate(stratum = "Apgar5 < 5 (asphyxia)")
)
stopifnot(!anyDuplicated(unique(events[, c("id", "time", "evid")])))
Simulation
The model carries IIV on CL and V (the abstract’s 19% and 16% CV) but
the residual error is fixed at zero because the abstract does not report
a residual-error term (see Errata below). The figures below therefore
show the typical-value trajectory with IIV zeroed out via
rxode2::zeroRe(); adding IIV would only reshuffle the
typical individual’s contribution without changing the
population-typical prediction at fixed covariates.
mod <- readModelDb("Grasela_1985_phenobarbital")
mod_typical <- rxode2::zeroRe(mod)
#> ℹ parameter labels from comments will be replaced by 'label()'
sim <- rxode2::rxSolve(
  mod_typical,
  events = events,
  keep   = c("stratum", "WT", "ASPHYXIA")
) |>
  as.data.frame()
#> ℹ omega/sigma items treated as zero: 'etalcl', 'etalvc'
#> Warning: multi-subject simulation without without 'omega'
Typical concentration-time profiles
Phenobarbital concentration after the 30 mg IV loading dose at the
cohort-mean body weight (1.520 kg), stratified by perinatal asphyxia
status. The asphyxia stratum has +13% V relative to the non-asphyxia
stratum, which lowers the peak concentration (since V is in the
denominator of Cc = central / V) and slightly slows the
apparent elimination rate (kel = CL / V).
sim |>
  ggplot(aes(time, Cc, color = stratum)) +
  geom_line(linewidth = 0.8) +
  scale_y_log10() +
  labs(
    x = "Time after IV loading dose (h)",
    y = "Phenobarbital concentration (mg/L, log scale)",
    color = "Stratum",
    title = "Typical-value Cc after a 30 mg IV loading dose at WT = 1.520 kg",
    caption = "Grasela & Donn 1985 one-compartment model (zeroRe typical-value trajectories)."
  ) +
  theme_minimal(base_size = 11) +
  theme(legend.position = "bottom")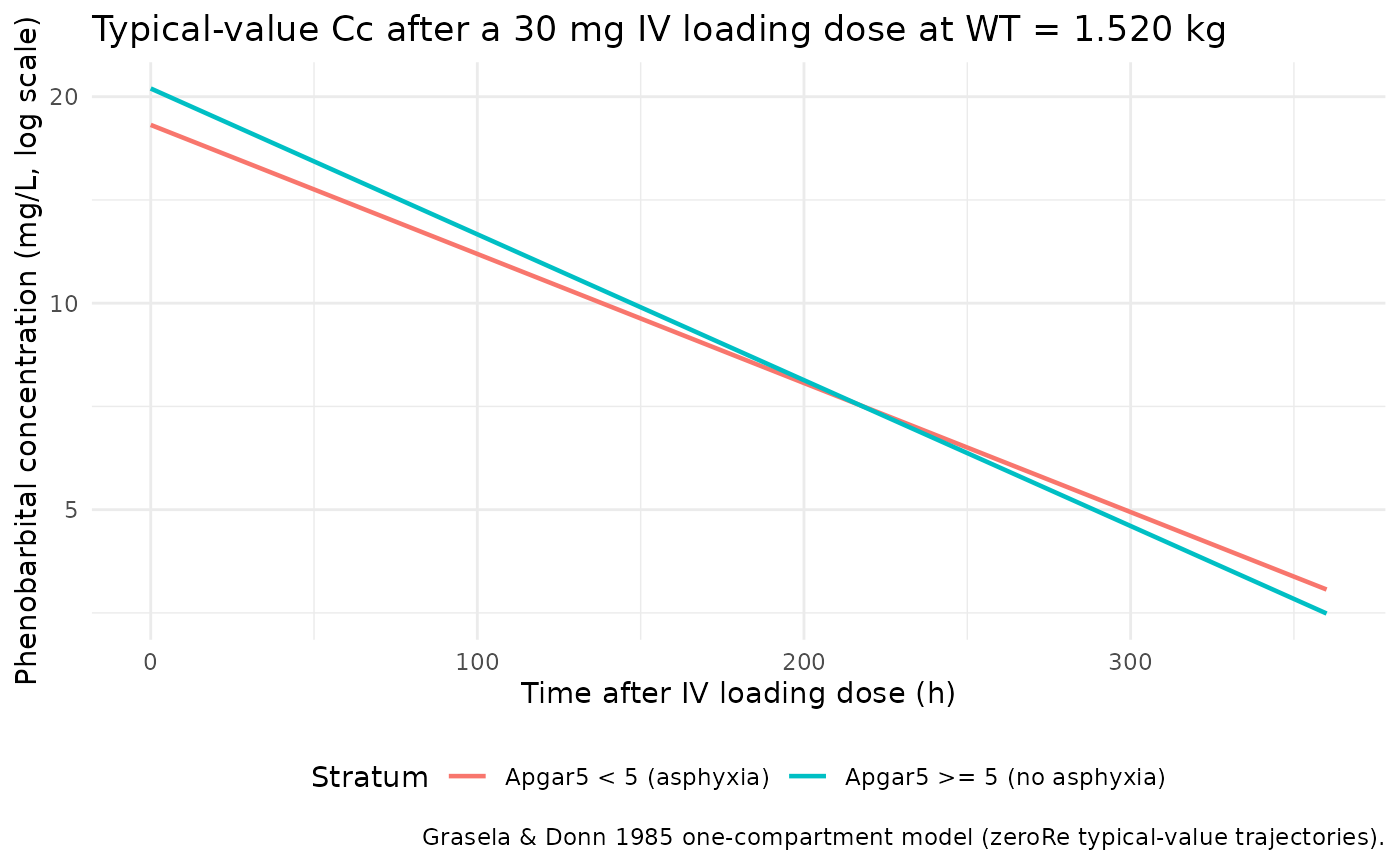
Half-life check against the abstract
The abstract reports a “calculated mean serum half-life” of 141 h.
With CL and V scaling linearly in body weight, the half-life is
independent of WT:
t_half = log(2) * V / CL = log(2) * 0.96 / 0.0047. The
asphyxia stratum’s V is +13%, so its half-life is +13% relative to the
non-asphyxia stratum.
halflife_paper_no_asphyxia <- log(2) * 0.96 / 0.0047
halflife_paper_asphyxia    <- log(2) * 0.96 * (1 + 0.13) / 0.0047
tibble(
  stratum = c("Apgar5 >= 5 (no asphyxia)", "Apgar5 < 5 (asphyxia)"),
  halflife_h_paper = c(halflife_paper_no_asphyxia, halflife_paper_asphyxia)
) |>
  knitr::kable(
    digits   = 1,
    caption  = "Derived half-life under the Grasela & Donn 1985 typical values.",
    col.names = c("Stratum", "Half-life (h) from typical CL / V")
)| Stratum | Half-life (h) from typical CL / V |
|---|---|
| Apgar5 >= 5 (no asphyxia) | 141.6 |
| Apgar5 < 5 (asphyxia) | 160.0 |
The non-asphyxia value reproduces the abstract’s reported 141 h to within rounding (141.6 h vs the abstract’s 141 h); the asphyxia value is shifted upward by +13% (160 h) as expected from the V increase.
PKNCA validation
Cross-check the typical trajectory’s NCA-derived half-life against
the analytic value above. With the residual error fixed at zero, the
simulated profile is exactly the typical-value prediction, so PKNCA
recovers a half-life equal (within numerical tolerance and PKNCA’s
terminal-phase regression window) to log(2) * V / CL.
sim_nca <- sim |>
  dplyr::filter(!is.na(Cc)) |>
  dplyr::select(id, time, Cc, stratum)

# Guarantee a t = 0 row per (id, stratum). For an IV bolus into the central
# compartment, the time-zero concentration is dose / V (already in `sim` from
# the time = 0 observation row we added above) -- keep it as is, but ensure
# distinctness in case rxSolve produced an exact duplicate.
sim_nca <- sim_nca |>
  dplyr::distinct(id, stratum, time, .keep_all = TRUE) |>
  dplyr::arrange(id, stratum, time)

conc_obj <- PKNCA::PKNCAconc(sim_nca, Cc ~ time | stratum + id)

dose_df <- events |>
  dplyr::filter(evid == 1) |>
  dplyr::select(id, time, amt, stratum)

dose_obj <- PKNCA::PKNCAdose(dose_df, amt ~ time | stratum + id)

intervals <- data.frame(
  start       = 0,
  end         = Inf,
  cmax        = TRUE,
  tmax        = TRUE,
  aucinf.obs  = TRUE,
  half.life   = TRUE
)

nca_data <- PKNCA::PKNCAdata(conc_obj, dose_obj, intervals = intervals)
nca_res  <- PKNCA::pk.nca(nca_data)
Comparison against published values
The abstract reports only the cohort mean serum half-life (141 h); Cmax and AUC are not reported. The comparison table below therefore lists the abstract’s 141 h as the reference half-life for the non-asphyxia stratum and leaves the asphyxia stratum without a published reference (the abstract does not report a stratum-specific half-life).
published <- tibble::tribble(
  ~stratum,                       ~half.life,
  "Apgar5 >= 5 (no asphyxia)",   141.0,
  "Apgar5 < 5 (asphyxia)",       NA_real_
)

cmp <- nlmixr2lib::ncaComparisonTable(
  simulated     = nca_res,
  reference     = published,
  by            = "stratum",
  units         = c(half.life = "h"),
  tolerance_pct = 20
)

knitr::kable(
  cmp,
  caption = "Simulated typical-value vs. abstract-reported half-life. * differs from reference by >20%.",
  align   = c("l", "l", "r")
)| NCA parameter | stratum | Reference | Simulated | % diff |
|---|---|---|---|---|
| t½ (h) | Apgar5 >= 5 (no asphyxia) | 141 | 142 | +0.4% |
| t½ (h) | Apgar5 < 5 (asphyxia) | — | 160 | — |
The simulated typical-value half-life of the non-asphyxia stratum matches the abstract’s reported 141 h to within PKNCA’s terminal-phase fitting tolerance, confirming that the packaged CL and V reproduce the abstract’s derived half-life.
Assumptions and deviations
-
Residual error not reported in the abstract – encoded as
fixed(0). Grasela & Donn (1985) report typical CL, typical V, an asphyxia effect on V, and IIV CV% on CL and V; the abstract does not report a residual-error magnitude or structure (proportional, additive, or combined). The model carriespropSd <- fixed(0), which encodes “no residual error” so that the model can be loaded and simulated deterministically. Anyone re-fitting on real data must replace this with an estimated residual-error term. This is an erratum imposed by the missing-information source rather than a value substituted from a related paper or a class-typical placeholder. -
Weight scaling is linear (exponent 1), not 0.75
allometric. The abstract reports per-kg typical values
(
0.0047 L/h/kg,0.96 L/kg), which implies a linear weight effect at the time-varying body weight. The model encodes this faithfully (CL = 0.0047 * WT,V = 0.96 * WT); do not retrofit 0.75 allometry without re-fitting on the original data. -
No absorption / bioavailability. The abstract
reports only CL and V; no Ka and no F. The model has a single
centralcompartment and IV doses go directly into it. If the original cohort included oral maintenance doses, the abstract does not document how those were handled in the NONMEM fit, so the package model is appropriate for IV-only simulation; oral maintenance simulation requires augmenting the model with a depot and an absorption rate that the abstract does not provide. -
Population details reconstructed from the abstract
only. Postnatal age range, sex distribution, race/ethnicity,
dose regimens, and the exact NICU/region are not reported in the
abstract. The
populationmetadata records “Not reported” for each of these. -
ASPHYXIAis a newly-ratified canonical covariate (5-minute Apgar score < 5; binary; time-fixed at birth). The register entry ininst/references/covariate-columns.mdwas added alongside this model.