Uprifosbuvir minimal PBPK-PD (van den Berg 2021)
Source:vignettes/articles/vandenBerg_2021_uprifosbuvir.Rmd
vandenBerg_2021_uprifosbuvir.RmdModel and source
- Citation: van den Berg P, Gao W, Ahsman MJ, Arrington L, Kesisoglou F, Miller R, Post TM, Rizk ML (2021). Understanding effect site pharmacology of uprifosbuvir, a hepatitis C virus nucleoside inhibitor: Case study of a multidisciplinary modeling approach in drug development. CPT Pharmacometrics Syst Pharmacol 10(7):658-670.
- Article: https://doi.org/10.1002/psp4.12644
- Supplement (equations, parameter tables, NONMEM control stream): supplied by the publisher as supinfo1-4 (open access).
Uprifosbuvir (MK-3682) is a uridine nucleoside monophosphate prodrug inhibitor of the hepatitis C virus (HCV) NS5B RNA polymerase. Its pharmacokinetics are complex: after oral administration the parent drug undergoes both gut- and liver-mediated metabolism into two measurable plasma metabolites (M5, M6) via an unmeasurable intrahepatic UMP-UTP-CMP-CTP nucleotide cycle. Neither the active nucleoside triphosphates (NTPs) nor the intermediate M4 can be sampled in plasma, and no direct link between plasma analytes and antiviral efficacy is observable without modelling.
The paper describes the iterative development of a minimal PBPK-PD (mPBPK-PD) model that separates gut and hepatic pathways, collapses the full nucleotide cycle into two lumped intrahepatic pools (UXP and CXP), and links intrahepatic UXP concentrations to viral inhibition (epsilon) via a sigmoid Emax function. This nlmixr2lib extraction implements the paper’s final mPBPK-PD model (their Step 3 for PK + Step 4 for the UXP-epsilon link) with all parameters fixed at the point estimates reported in supplementary Tables 1-6.
Population
Data used to build the model came from six Phase 1/1-2a studies (PN001, PN002, PN003, PN010, PN013, PN026) comprising 220 subjects: 132 healthy volunteers and 88 patients with chronic HCV infection. Doses covered 25 mg IV (single dose), 150-750 mg tablet (single and multiple oral doses), and 50-400 mg capsule (single and multiple oral doses). An itraconazole DDI arm at 300 mg uprifosbuvir with 200 mg QD itraconazole was included in both HV (PN001 Group F, PN010) and HCV (PN001 Group F’ equivalent) cohorts. See supplementary Table S1 of the paper for the per-study breakdown.
Metadata are available programmatically via
readModelDb("vandenBerg_2021_uprifosbuvir_pbpk")()$population.
Model structure
The minimal PBPK-PD model is organised into three physiologic blocks (Figure 1d of the paper): gut, liver, and systemic circulation. Twenty-two ODE compartments are used (one – DUMMY – was declared but unused in the NONMEM control stream and is omitted here):
| # | Compartment name | Role | NONMEM name |
|---|---|---|---|
| 1 | depot |
Fast oral depot | DEPOT1 |
| 2 | depot2 |
Slow oral depot (routed via
transit_gut_par -> gut) |
DEPOT2 |
| 3 | gut |
Gut wall parent | GUT |
| 4 | gut_m6 |
Transit gut M6 (with concentration-dependent elimination) | GUTM6 |
| 5 | liver |
Liver parent | LIVER |
| 6 | central |
Parent central | CENTPAR |
| 7 | peripheral1 |
Parent peripheral 1 | PERIPAR |
| 8 | uxp |
Intrahepatic UXP (UMP + UTP lumped) | UXP |
| 9 | central_m6 |
M6 central | M6CENTR |
| 10 | transit_cxp_m5 |
Transit compartment CXP -> M5 (paper: “rate-limiting step in M5 formation” mechanistic) | CTRM5 |
| 11 | cxp |
Intrahepatic CXP (CMP + CTP lumped) | CXP |
| 12 | central_m5 |
M5 central | M5CENTR |
| 13 | portal_vein |
Portal vein parent | PVPAR |
| 14 | gut_m5 |
Gut M5 | GUTM5 |
| 15-18 | transit_gut_m5_1..4 |
4-step transit chain for slow M5 formation from gut | TRGTM51-54 |
| 19 | transit_gut_par |
Parent gut transit (slow-route absorption) | TRPAR1 |
| 20 | peripheral2 |
Parent peripheral 2 (Vpp2 fixed = Vpp) | PERIPAR2 |
| 21 | pseudo_m4_gut |
Pseudo-M4 gut pool (delayed M5/M6 production; paper Step 2e) | PSM4GUT |
Three algebraic observables are computed at each observation time:
-
Cc– uprifosbuvir plasma concentration in nmol/L (central / vc) -
Cc_m5– M5 plasma concentration in nmol/L (central_m5 / vc) -
Cc_m6– M6 plasma concentration in nmol/L (central_m6 / vc)
Plus the viral-inhibition scaling factor
eff = 1 + Emax * UXP^Hill / (EC50^Hill + UXP^Hill) used in
the paper’s Step 4 exposure-response analysis (Emax = 1
fixed; EC50 corresponds to 17,500 nmol/L UXP, Hill = 2.80).
Source trace
Every ini() parameter carries an inline source-location
comment referencing the NONMEM THETA index and the corresponding table
in the paper’s supplement. The table below is the same audit trail
collected in one place.
| Parameter | Value | Source |
|---|---|---|
Fast-fraction pre-logit fdos1_logit
|
0.704 (tablet baseline: F1 = 0.669 on natural scale) | Supp Table 1, TH(1); note (a) |
| Fast KA1 at 150 mg | 0.670 1/h | Supp Table 1, TH(2) |
| Slow KA2 at 150 mg | 0.497 1/h | Supp Table 1, TH(3) |
| Dose slope on log-KA2 | -0.00178 1/mg | Supp Table 1, TH(4) |
| Fast lag ALAG1 | 0.125 h | Supp Table 1, TH(38) |
| Slow lag ALAG2 | 1.87 h | Supp Table 1, TH(5) |
| Transit rate Ktr1 | 0.0598 1/h | Supp Table 1, TH(6) |
| Intrinsic gut CL_int,G | 15.5 L/h | Supp Table 1, TH(8) |
| Gut fraction pre-logit FrM5 | -1.56 (natural scale 0.110) | Supp Table 1, TH(9); note (e) |
| Gut fraction pre-logit FrM4 | -0.345 (natural scale 0.369) | Supp Table 1, TH(39); note (d) |
| Pseudo-M4 absorption KM4g | 0.119 1/h | Supp Table 1, TH(40) |
| Gut M6 absorption KM6g | 0.106 1/h | Supp Table 1, TH(10) |
| Gut M5 to transit K2M5g | 0.402 1/h | Supp Table 1, TH(12) |
| Conc-dep gut M6 elim TKelM6g @ 50,000 nmol | 6.10 1/h | Supp Table 1, TH(11) |
| Power exponent on gut M6 elim | 1.39 | Supp Table 1, TH(41) |
| Intrinsic hepatic CL_int,H | 82.6 L/h | Supp Table 1, TH(14) |
| Vc | 3.92 L | Supp Table 1, TH(15) |
| Vpp (Vpp2 = Vpp fixed) | 7.19 L | Supp Table 1, TH(16) |
| Qp | 17.3 L/h | Supp Table 1, TH(17) |
| Qp2 | 1.11 L/h | Supp Table 1, TH(19) |
| kUnuc1 (parameterised as TH/1000) | 0.0133 1/h | Supp Table 1, TH(20); note (i) |
| kUCXP (kCUXP = kUCXP fixed) | 0.785 1/h | Supp Table 1, TH(21) |
| Conc-dep kelUXP @ 50,000 nmol | 0.481 1/h | Supp Table 1, TH(43) |
| Power exponent on kelUXP | 1.34 | Supp Table 1, TH(44) |
| kCnuc (parameterised as TH/1000) | 0.0338 1/h | Supp Table 1, TH(23); note (k) |
| kCnuc2 | 0.122 1/h | Supp Table 1, TH(37) |
| CLM6 (V1M6 = Vc fixed) | 2.60 L/h | Supp Table 1, TH(24) |
| CLM5 (V1M5 = Vc fixed) | 79.5 L/h | Supp Table 1, TH(26) |
| HCV factor on CLM5 | 0.716 | Supp Table 3, TH(53) |
| Capsule factors (KA1, FDOS1, F, KelM6g, ALAG1, dose slopes) | see Supp Table 3 | TH(45)/(46)/(54)/(63)/(64)/(65)/(66) |
| Itraconazole factors (CL_int,G, CL_int,H, ALAG2, KA2, Ktr1, KM6g, FrM6g, KelM6g) | see Supp Table 3 | TH(55)-(62) |
| Residual errors (tablet oral) | prop 0.155, add 3.36 (uprifosbuvir); prop 0.0294 (M5); prop 0.0153 + add 342 (M6) | Supp Table 5 |
| Emax fixed to 1 | 1 | Supp Table 6 |
| log EC50 (UXP scale) | 9.77 (natural 17,500 nmol/L) | Supp Table 6, note (a) |
| Hill coefficient | 2.80 | Supp Table 6 |
| Physiologic constants (Q_hep 88, Q_pv 66, Q_ha 22, fu 0.577, B:P 0.73, …) | Supp Table 2 | Davies & Morris 1993; Williams & Leggett 1989; Yang 2007; Sponsor |
Loading the model
mod <- readModelDb("vandenBerg_2021_uprifosbuvir_pbpk")()
mod_typical <- rxode2::zeroRe(mod)
The molar mass of uprifosbuvir is used below to convert doses in mg to the model’s native nmol input.
MW_UPRI <- 462.42  # g/mol; PubChem CID 91885728
mg_to_nmol <- function(mg) mg / MW_UPRI * 1e6
Event-table conventions for this multi-output model
Because the model has three algebraic output variables
(Cc, Cc_m5, Cc_m6) each carrying
its own residual-error component, rxode2 auto-injects DVID slots for
them after the 21 ODE-state slots. The stable mapping is:
| DV | Compartment slot | Observable |
|---|---|---|
| 1 | 22 |
Cc (uprifosbuvir) |
| 2 | 23 |
Cc_m5 (M5) |
| 3 | 24 |
Cc_m6 (M6) |
For every observation timepoint we emit three rows (one per DV) with
numeric cmt = 22/23/24; dose rows use cmt = 1L
(the depot state; the model’s fast/slow bioavailability
logic splits the mass across depot and depot2
internally via f(depot) <- f1 and
f(depot2) <- f2). IV administration is modelled by
setting ROUTE_IV = 1 (which sets f1 = f2 = 0)
and placing the dose in the central slot
(cmt = 6L).
make_events <- function(id, dose_mg, dose_times, obs_times,
                        FORM_CAPSULE = 0, ROUTE_IV = 0,
                        CONMED_ITRACONAZOLE = 0, HCV_POS = 0) {
  dose_slot <- ifelse(ROUTE_IV == 1, 6L, 1L)  # central for IV, depot for oral
  amt_nmol  <- mg_to_nmol(dose_mg)
  dose_df <- data.frame(
    id = id, time = dose_times,
    amt = amt_nmol, evid = 1L, cmt = dose_slot
  )
  obs_df <- expand.grid(
    id = id, time = obs_times, cmt = c(22L, 23L, 24L)
  )
  obs_df$amt  <- NA_real_
  obs_df$evid <- 0L
  ev <- rbind(dose_df, obs_df)
  ev <- ev[order(ev$id, ev$time, -ev$evid), ]
  ev$DOSE                <- dose_mg
  ev$FORM_CAPSULE        <- FORM_CAPSULE
  ev$ROUTE_IV            <- ROUTE_IV
  ev$CONMED_ITRACONAZOLE <- CONMED_ITRACONAZOLE
  ev$HCV_POS             <- HCV_POS
  ev
}
Replicate published figures (typical-value simulations)
Figure 2 – single-dose tablet dose-escalation and itraconazole DDI
The paper’s Figure 2 shows typical-value profiles for a single oral tablet dose at 150, 300, 450 mg and the impact of itraconazole coadministration at 300 mg. The plot is reproduced here for the four analytes shown (uprifosbuvir, M5, M6, UXP) in a healthy-volunteer setting.
obs_t <- seq(0, 48, by = 0.5)

sim_dose <- function(dose_mg, itra = 0) {
  ev <- make_events(
    id = 1L, dose_mg = dose_mg, dose_times = 0,
    obs_times = obs_t, FORM_CAPSULE = 0,
    ROUTE_IV = 0, CONMED_ITRACONAZOLE = itra, HCV_POS = 0
  )
  sim <- rxode2::rxSolve(mod_typical, events = ev, keep = c("cmt", "DOSE"))
  sim$label <- if (itra == 1) {
    sprintf("%d mg + itraconazole", dose_mg)
  } else {
    sprintf("%d mg alone", dose_mg)
  }
  sim
}

sim_fig2 <- dplyr::bind_rows(
  sim_dose(150), sim_dose(300), sim_dose(450),
  sim_dose(300, itra = 1)
)
#> ℹ omega/sigma items treated as zero: 'etalcl_int_h', 'etalvc', 'etalcl_m6', 'etalcl_m5'
#> ℹ omega/sigma items treated as zero: 'etalcl_int_h', 'etalvc', 'etalcl_m6', 'etalcl_m5'
#> ℹ omega/sigma items treated as zero: 'etalcl_int_h', 'etalvc', 'etalcl_m6', 'etalcl_m5'
#> ℹ omega/sigma items treated as zero: 'etalcl_int_h', 'etalvc', 'etalcl_m6', 'etalcl_m5'

sim_fig2_long <- sim_fig2 |>
  dplyr::filter(cmt == 22L) |>          # any DV slot -- Cc/Cc_m5/Cc_m6/uxp are the same across rows
  dplyr::select(time, label,
                Uprifosbuvir = Cc, M5 = Cc_m5, M6 = Cc_m6, UXP = uxp) |>
  tidyr::pivot_longer(cols = -c(time, label),
                      names_to = "analyte", values_to = "conc")

ggplot(sim_fig2_long, aes(time, conc, colour = label)) +
  geom_line(size = 0.7) +
  facet_wrap(~ analyte, scales = "free_y") +
  scale_y_continuous(trans = "log10",
                     labels = function(x) format(x, big.mark = ",", scientific = FALSE)) +
  labs(x = "Time (h)", y = "Concentration (nmol/L)",
       colour = NULL,
       title = "Replicates Figure 2 of van den Berg 2021",
       caption = "Typical-value profiles; single dose; healthy volunteers; tablet.") +
  theme_bw() +
  theme(legend.position = "bottom")
#> Warning: Using `size` aesthetic for lines was deprecated in ggplot2 3.4.0.
#> ℹ Please use `linewidth` instead.
#> This warning is displayed once per session.
#> Call `lifecycle::last_lifecycle_warnings()` to see where this warning was
#> generated.
#> Warning in scale_y_continuous(trans = "log10", labels = function(x) format(x, :
#> log-10 transformation introduced infinite values.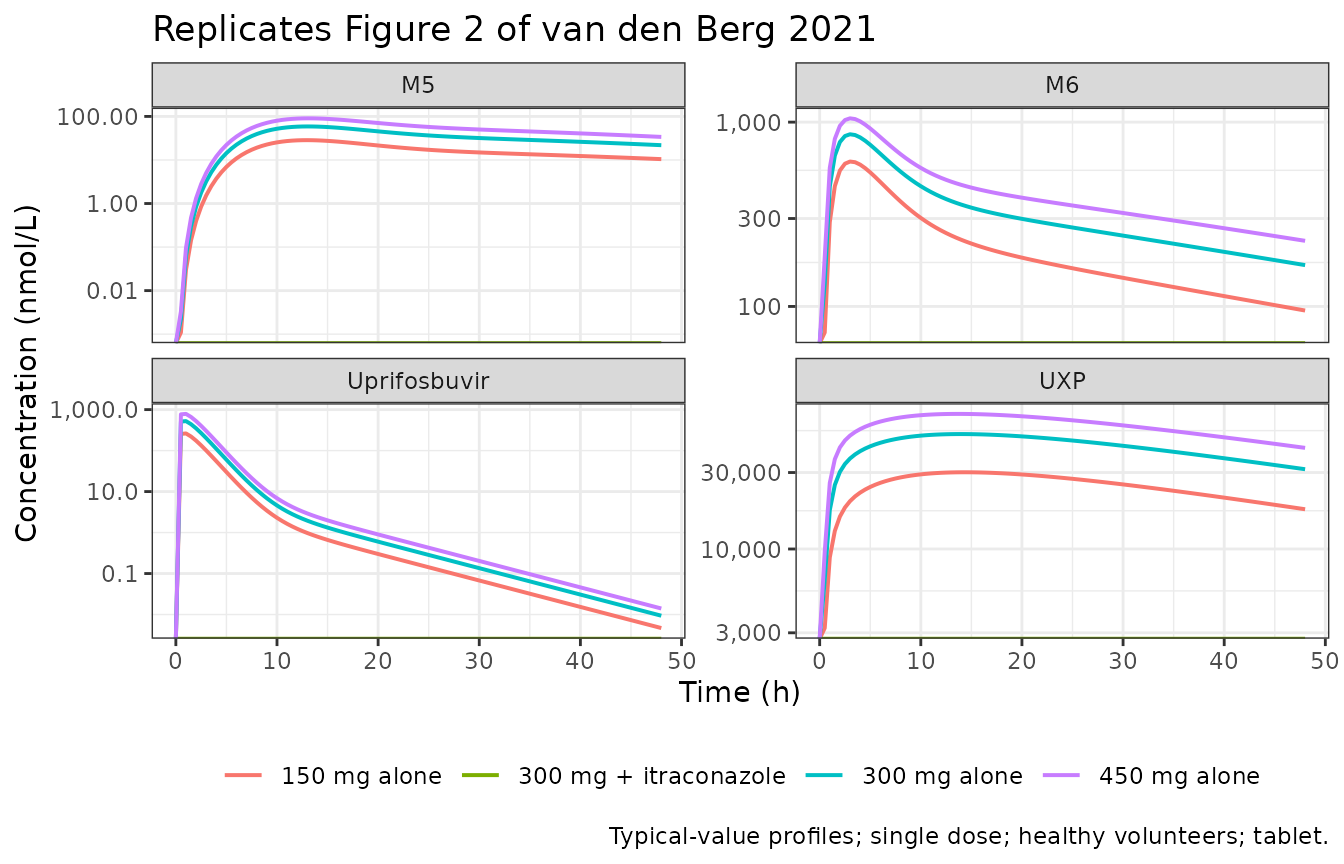
The characteristic two-peak M6 profile is visible in the 150-450 mg alone arms (early “inactive” gut-mediated first peak, later “active” hepatic UXP- mediated second peak). Itraconazole abolishes the early M6 peak, delays the uprifosbuvir Tmax, and increases uprifosbuvir exposure – consistent with the paper’s mechanistic interpretation of itraconazole shunting uprifosbuvir away from gut CYP3A4 / P-glycoprotein-mediated first-pass metabolism.
Multiple-dose tablet in HCV patients (paper Figure 3, typical-value)
The paper’s Figure 3 shows a VPC of multiple 300-mg tablet oral doses QD for seven days in HCV patients. Below we reproduce the typical-value profile.
dose_times <- 0:6 * 24                          # 7 daily doses
obs_times  <- seq(0, 168, by = 1)               # 7-day window
ev_md <- make_events(
  id = 1L, dose_mg = 300,
  dose_times = dose_times, obs_times = obs_times,
  FORM_CAPSULE = 0, ROUTE_IV = 0,
  CONMED_ITRACONAZOLE = 0, HCV_POS = 1
)
sim_md <- rxode2::rxSolve(mod_typical, events = ev_md, keep = c("cmt", "DOSE"))
#> ℹ omega/sigma items treated as zero: 'etalcl_int_h', 'etalvc', 'etalcl_m6', 'etalcl_m5'

sim_md_long <- sim_md |>
  dplyr::filter(cmt == 22L) |>
  dplyr::select(time,
                Uprifosbuvir = Cc, M5 = Cc_m5, M6 = Cc_m6) |>
  tidyr::pivot_longer(cols = -time, names_to = "analyte", values_to = "conc")

ggplot(sim_md_long, aes(time, conc)) +
  geom_line(colour = "#1f78b4", size = 0.7) +
  facet_wrap(~ analyte, scales = "free_y", ncol = 1) +
  scale_x_continuous(breaks = seq(0, 168, by = 24)) +
  scale_y_continuous(trans = "log10",
                     labels = function(x) format(x, big.mark = ",", scientific = FALSE)) +
  labs(x = "Time (h)", y = "Concentration (nmol/L)",
       title = "Multiple-dose 300 mg tablet QD x 7d (HCV patient)",
       caption = "Reproduces the qualitative pattern of Figure 3 of van den Berg 2021.") +
  theme_bw()
#> Warning in scale_y_continuous(trans = "log10", labels = function(x) format(x, :
#> log-10 transformation introduced infinite values.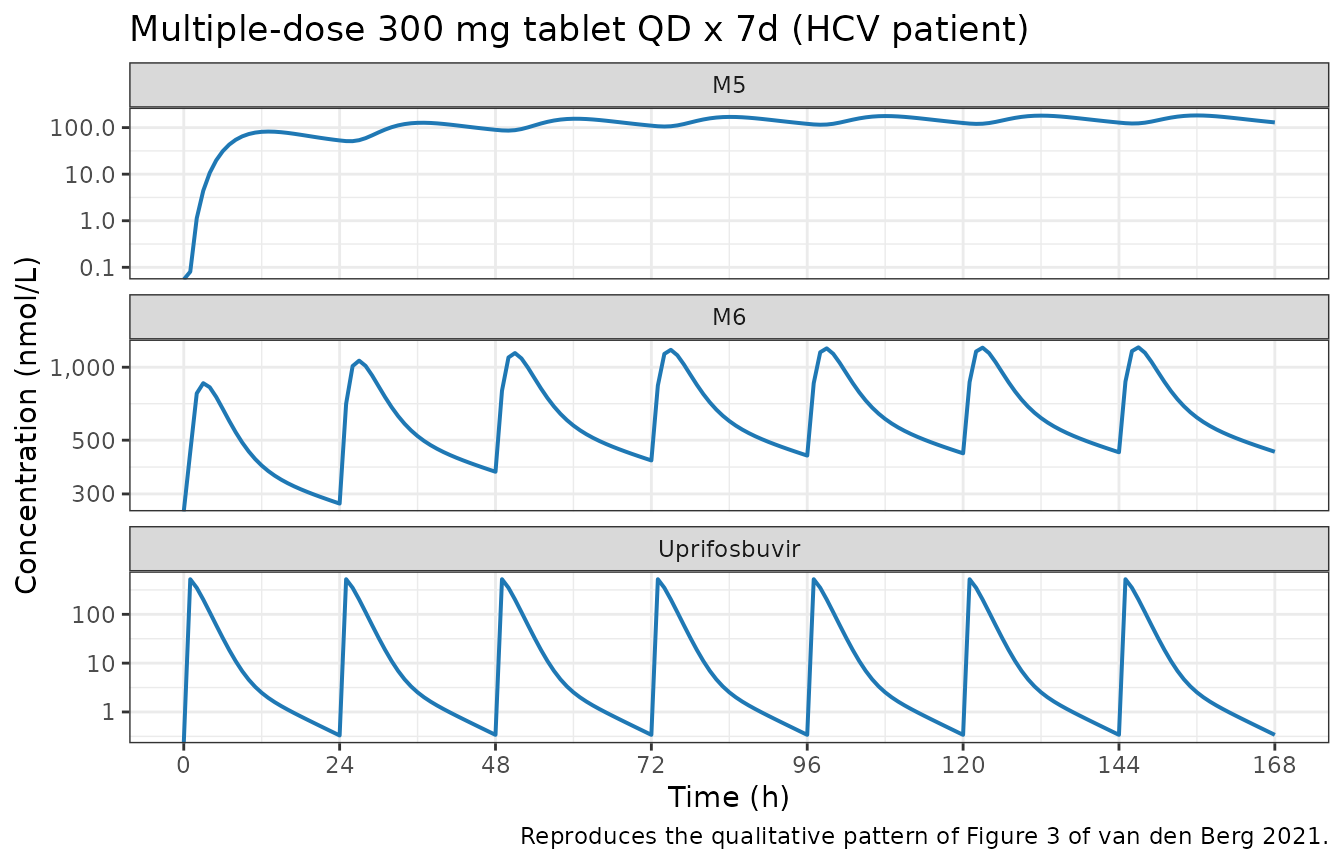
The M5 clearance in HCV patients is 28.4% lower than in healthy
volunteers (e_hcv_cl_m5 = 0.716); the plot shows a
correspondingly higher M5 steady-state exposure than the same regimen
would produce in HV.
Capsule vs tablet at 300 mg single dose (paper Step 2g)
Capsules absorb faster (91% of dose via KA1 vs 67% for tablets) and
produce 17% higher bioavailability but lower gut-M6 exposure due to the
separate capsule-specific concentration-dependent M6 elimination rate.
This formulation stratification is switched by
FORM_CAPSULE.
sim_form <- function(is_capsule) {
  ev <- make_events(
    id = 1L, dose_mg = 300, dose_times = 0,
    obs_times = seq(0, 24, by = 0.25),
    FORM_CAPSULE = as.integer(is_capsule),
    ROUTE_IV = 0, CONMED_ITRACONAZOLE = 0, HCV_POS = 0
  )
  sim <- rxode2::rxSolve(mod_typical, events = ev, keep = c("cmt", "DOSE"))
  sim$formulation <- ifelse(is_capsule, "Capsule", "Tablet")
  sim
}

sim_form_all <- dplyr::bind_rows(sim_form(FALSE), sim_form(TRUE)) |>
  dplyr::filter(cmt == 22L) |>
  dplyr::select(time, formulation,
                Uprifosbuvir = Cc, M5 = Cc_m5, M6 = Cc_m6) |>
  tidyr::pivot_longer(cols = -c(time, formulation),
                      names_to = "analyte", values_to = "conc")
#> ℹ omega/sigma items treated as zero: 'etalcl_int_h', 'etalvc', 'etalcl_m6', 'etalcl_m5'
#> ℹ omega/sigma items treated as zero: 'etalcl_int_h', 'etalvc', 'etalcl_m6', 'etalcl_m5'

ggplot(sim_form_all, aes(time, conc, colour = formulation)) +
  geom_line(size = 0.7) +
  facet_wrap(~ analyte, scales = "free_y", ncol = 3) +
  scale_y_continuous(trans = "log10",
                     labels = function(x) format(x, big.mark = ",", scientific = FALSE)) +
  labs(x = "Time (h)", y = "Concentration (nmol/L)", colour = NULL,
       title = "Capsule vs tablet, 300 mg single dose, healthy volunteers",
       caption = "Capsule KA1 is 2.02-fold higher than tablet; F 17% higher.") +
  theme_bw() +
  theme(legend.position = "bottom")
#> Warning in scale_y_continuous(trans = "log10", labels = function(x) format(x, :
#> log-10 transformation introduced infinite values.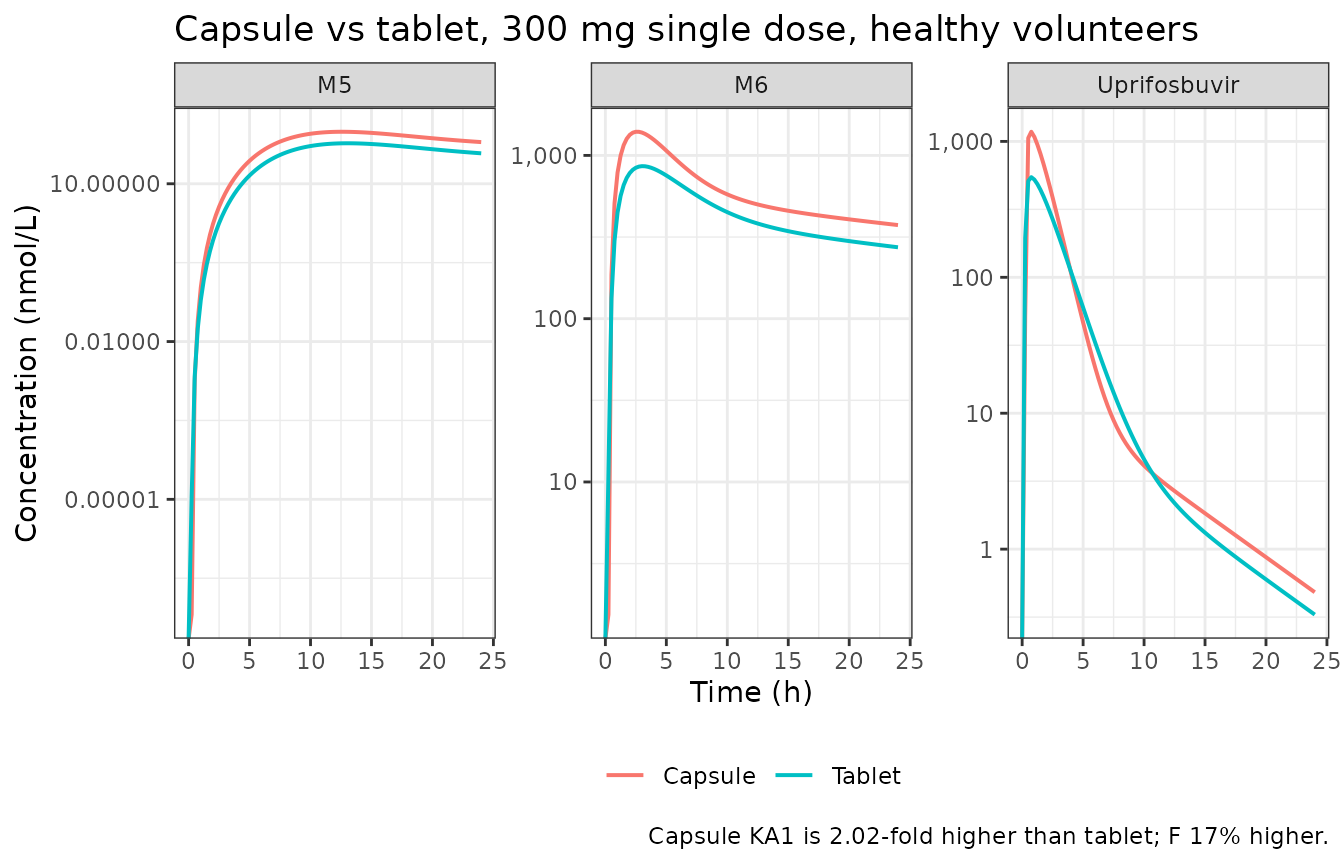
Viral inhibition (paper Figure 5, typical-value)
The final Step 4 of the paper links intrahepatic UXP predictions to
the viral inhibition estimate epsilon via a sigmoid Emax function. In
the model the observable
eff = 1 + Emax * UXP^Hill / (EC50^Hill + UXP^Hill) (with
Emax = 1 fixed) approaches 2 as UXP saturates the EC50 =
17,500 nmol/L threshold; the paper reports epsilon (which is the paper’s
raw dependent variable) as EFFW - 1 for numerical stability, so
effective viral inhibition (the y-axis of Figure 5) is
eff - 1.
sim_fig5 <- dplyr::bind_rows(
  sim_dose(50)  |> dplyr::mutate(dose = "50 mg"),
  sim_dose(150) |> dplyr::mutate(dose = "150 mg"),
  sim_dose(300) |> dplyr::mutate(dose = "300 mg"),
  sim_dose(450) |> dplyr::mutate(dose = "450 mg")
) |>
  dplyr::filter(cmt == 22L) |>
  dplyr::mutate(epsilon = eff - 1,
                dose = factor(dose, levels = c("50 mg", "150 mg", "300 mg", "450 mg")))
#> ℹ omega/sigma items treated as zero: 'etalcl_int_h', 'etalvc', 'etalcl_m6', 'etalcl_m5'
#> ℹ omega/sigma items treated as zero: 'etalcl_int_h', 'etalvc', 'etalcl_m6', 'etalcl_m5'
#> ℹ omega/sigma items treated as zero: 'etalcl_int_h', 'etalvc', 'etalcl_m6', 'etalcl_m5'
#> ℹ omega/sigma items treated as zero: 'etalcl_int_h', 'etalvc', 'etalcl_m6', 'etalcl_m5'

ggplot(sim_fig5, aes(time, epsilon, colour = dose)) +
  geom_line(size = 0.7) +
  labs(x = "Time (h)", y = expression(epsilon~"(viral inhibition, unitless)"),
       colour = "Dose",
       title = "Replicates Figure 5 of van den Berg 2021 (typical-value)",
       caption = "Emax = 1 (fixed); EC50 = 17,500 nmol/L UXP; Hill = 2.80.") +
  theme_bw()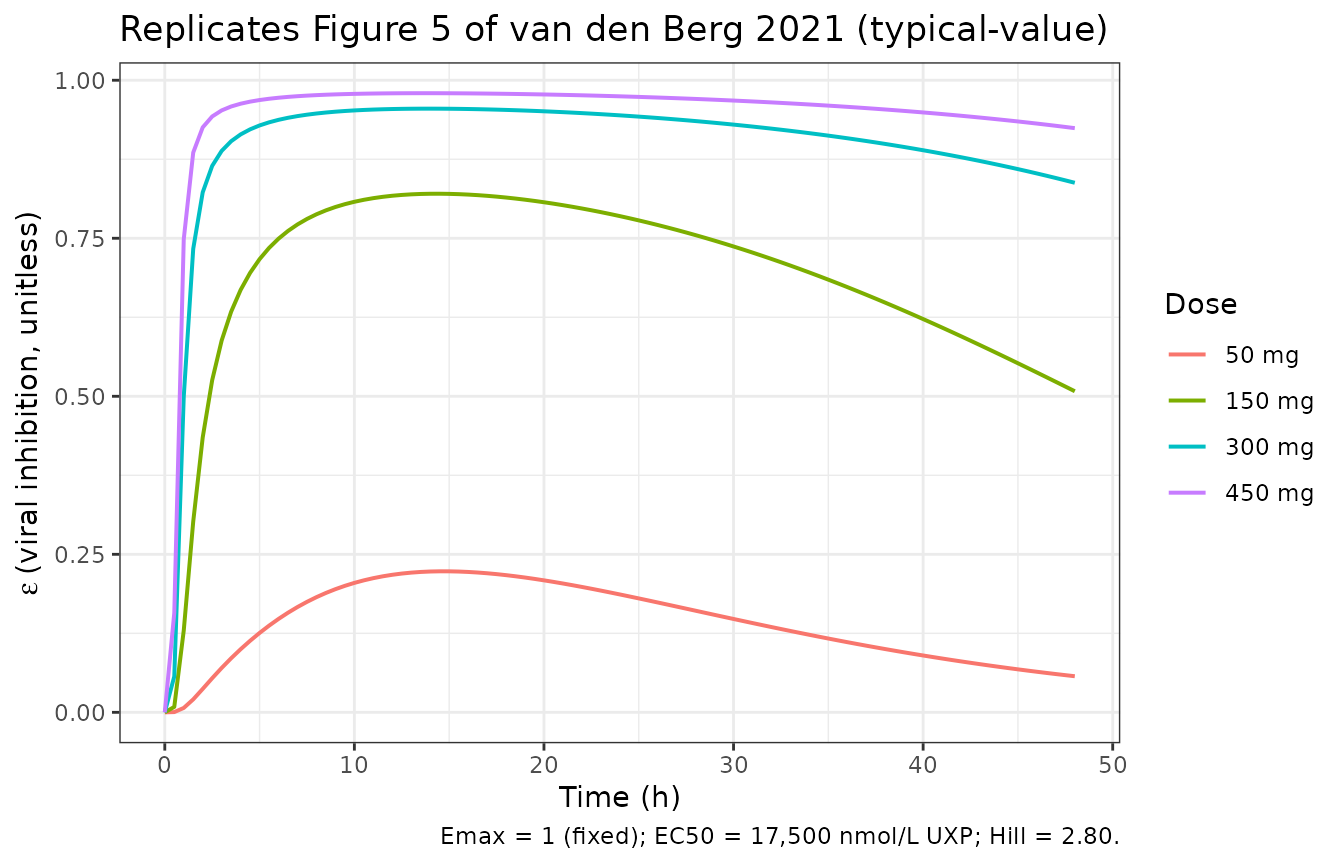
Higher uprifosbuvir doses produce a stronger and more sustained epsilon value in the typical-value simulation, matching the qualitative pattern of Figure 5 of the paper.
Assumptions and deviations
-
Amount units. The paper’s NONMEM dataset carries
AMTin nmol. This model preserves the same unit; the helpermg_to_nmol()uses MW_UPRI = 462.42 g/mol (PubChem CID 91885728) to convert doses in mg. - IIV encoding is a subset of Table 4. The full paper reports 15 etas (Table 4) with a 2 x 2 covariance block between kCnuc and CLM5. This extraction encodes the four etas that carry the largest information content (CL_int,H, Vc, CLM6, CLM5, all as fixed diagonal variances). The remaining 11 etas (KA2, FDOS1, CL_int,G, KelM6g, FrM5g, FrM4g, KA1_capsule, kUnuc1, F_capsule, kCnuc, ALAG1 factor) and the CLM5-kCnuc covariance are documented in the paper’s Table 4 but not encoded here. Downstream users wanting the full 15-eta structure should extend the model file per Table 4.
-
Residual error is tablet-oral only. The paper’s
Table 5 reports separate proportional and additive components for tablet
oral, IV, and capsule oral for each of the three analytes (13 residual
terms in total). This extraction encodes only the tablet-oral values as
the default residuals for
Cc(prop 0.155 + add 3.36),Cc_m5(prop 0.0294), andCc_m6(prop 0.0153 + add 342). Full IV and capsule residual sets are:- Uprifosbuvir IV: prop sigma^2 = 0.0104 (SD = 0.102)
- Uprifosbuvir capsule oral: prop 0.218 (SD = 0.467) + add 1e-5 FIX
- M5 IV: prop sigma^2 = 0.0102 (SD = 0.101)
- M5 capsule oral: prop 0.0177 (SD = 0.133) + add 1e-5 FIX
- M6 IV: prop sigma^2 = 0.00845 (SD = 0.0919)
- M6 capsule oral: prop 0.0155 (SD = 0.124) + add 301 (SD = 17.3 nmol/L)
-
Structural framework acknowledgement. The paper
credits Brill et al.
- Understanding the influence of body weight, obesity, gastric bypass surgery and pregnancy on the pharmacokinetics of drugs commonly used in intensive care (JPKPD 43:75-87) as the mPBPK starting point. All equations and parameters used in the current model are those reported directly in the van den Berg 2021 paper and supplement; no parameter value was carried in from the Brill 2016 paper.
-
Guard against t = 0 division-by-zero in
concentration-dependent rates. The conc-dependent gut-M6
elimination
KelM6g = TKelM6g * (gut_m6 / 50000)^POWand conc-dependent UXP -> CXP fluxkelUXP = TkelUXP * (uxp / 50000)^POW3are wrapped inif (state > 0)guards insidemodel()(matching the NONMEMIF(CON4.GT.0)andIF(CON8.GT.0)gates), so both rates evaluate to zero when the corresponding pool amount is zero. -
Multi-output DVID mapping requires numeric compartment
slots. See the event-table section above. This is a consequence
of having three algebraic observables (
Cc,Cc_m5,Cc_m6) each with residual error in the model. Downstream nlmixr2est estimation workflows would set the DVID / CMT columns on real observation records the same way (DVID 1 = uprifosbuvir, 2 = M5, 3 = M6, per the paper’s dataset conventions). -
DUMMY compartment omitted. NONMEM
$MODELslot 10 (DUMMY) is declared but never receives mass (DADT(10) = 0); it is omitted from the rxode2 model. - Population NCA validation is not attempted here. The paper reports no NCA output table – the primary validation targets are the VPCs of Figures 2-4 (typical-value + variability) and the exposure-response fit of Figure 5. This vignette replicates the typical-value profiles for those figures; matching the full VPC bands requires encoding the complete Table 4 eta structure and simulating stochastically.