Ethambutol (Horita 2018)
Source:vignettes/articles/Horita_2018_ethambutol.Rmd
Horita_2018_ethambutol.RmdModel and source
- Citation: Horita Y, Alsultan A, Kwara A, Antwi S, Enimil A, Ortsin A, Dompreh A, Yang H, Wiesner L, Peloquin CA. Evaluation of the Adequacy of WHO Revised Dosages of the First-Line Antituberculosis Drugs in Children with Tuberculosis Using Population Pharmacokinetic Modeling and Simulations. Antimicrob Agents Chemother. 2018;62(9):e00008-18. doi:10.1128/AAC.00008-18
- Description: Two-compartment population pharmacokinetic model with zero-order absorption (lag time + zero-order duration) and first-order elimination for oral ethambutol in Ghanaian children with active tuberculosis (Horita 2018); allometric weight scaling on CL/F, Q/F, V1/F, V2/F with non-canonical estimated exponents (0.382, 0.474, 0.228, 0.858) normalised to the cohort median 14.3 kg.
- Article: https://doi.org/10.1128/AAC.00008-18
Population
The model was developed from 113 Ghanaian children with active tuberculosis enrolled at Komfo Anokye Teaching Hospital, Kumasi, Ghana between October 2012 and August 2015 (ClinicalTrials.gov NCT01687504). The cohort spans 3 months to 14 years of age and 5 to 30 kg in body weight (median 14.3 kg). 547 ethambutol concentration-time data points were available; 48 below-LLOQ values were left-censored and analyzed via the SAEM algorithm in MonolixSuite2016R1. Three children with only-BLQ values (malabsorption group; two of those were under 2 years old) were excluded from model building.
Children received ethambutol 15-25 mg/kg orally daily (median 16.8 mg/kg, IQR 15.0-20.3) during the initial 2-month intensive phase of TB therapy. PK sampling was at steady state with blood samples at 0, 1, 2, 4, and 8 hours postdose. EMB was quantified by LC-MS/MS over 0.0844 to 5.46 ug/mL.
The same information is available programmatically via
readModelDb("Horita_2018_ethambutol")$population.
Source trace
| Equation / parameter | Value | Source location |
|---|---|---|
| Structural model: 2-compartment with zero-order absorption + lag time | – | Results “EMB” paragraph 1; Table 4 |
Tlag (absorption lag time) |
0.723 h | Table 4 |
Tk0 (zero-order absorption duration) |
0.9 h | Table 4 |
CL/F (typical at WT = 14.3 kg) |
32.5 L/h | Table 4 |
V1/F (typical at WT = 14.3 kg) |
112 L | Table 4 |
Q/F (typical at WT = 14.3 kg) |
15.4 L/h | Table 4 |
V2/F (typical at WT = 14.3 kg) |
97.8 L | Table 4 |
| Allometric exponent on CL/F (estimated) | 0.382 (RSE 24%) | Table 4 |
| Allometric exponent on Q/F (estimated) | 0.474 (RSE 44%) | Table 4 |
| Allometric exponent on V1/F (estimated) | 0.228 (RSE 84%) | Table 4 |
| Allometric exponent on V2/F (estimated) | 0.858 (RSE 60%) | Table 4 |
| IIV on Tlag (omega) | 0.174 (17.5% CV) | Table 4 |
| IIV on Tk0 (omega) | 0.605 (66.5% CV) | Table 4 |
| IIV on CL/F (omega) | 0.458 (48.3% CV) | Table 4 |
| IIV on V1/F (omega) | 0.607 (66.7% CV) | Table 4 |
| IIV on Q/F (omega) | 0.274 (27.9% CV) | Table 4 |
| IIV on V2/F (omega) | 0.310 (31.8% CV) | Table 4 |
| Residual error: slope b (proportional only) | 0.272 (fraction) | Table 4 |
Virtual cohort
The dose event uses cmt = "central" with
rate = -2 so the model’s
dur(central) <- tk0 applies the zero-order absorption
duration, and alag(central) <- tlag delays the start of
absorption.
set.seed(20260526)

weight_bands <- tibble::tibble(
  band = c("5-7 kg", "8-14 kg", "15-20 kg", "21-30 kg"),
  weight_median = c(6.45, 12.5, 17.7, 22.4),
  dose_mg = c(400, 550, 550, 550),  # Horita 2018 Table 3: Cmax 2 ug/mL TA dose
  band_idx = seq_len(4)
)

n_per_band <- 100L
make_cohort <- function(band_idx, n, id_offset = 0L) {
  row <- weight_bands[band_idx, ]
  ids <- id_offset + seq_len(n)
  obs_times <- seq(0, 24, by = 0.5)
  rxode2::et(amt = row$dose_mg, time = 0, cmt = "central", rate = -2) |>
    rxode2::et(obs_times) |>
    rxode2::et(id = ids) |>
    as.data.frame() |>
    dplyr::mutate(
      WT   = row$weight_median,
      band = row$band
    )
}

events <- dplyr::bind_rows(
  make_cohort(1L, n_per_band, id_offset =   0L),
  make_cohort(2L, n_per_band, id_offset = 200L),
  make_cohort(3L, n_per_band, id_offset = 400L),
  make_cohort(4L, n_per_band, id_offset = 600L)
)
stopifnot(!anyDuplicated(unique(events[, c("id", "time", "evid")])))
Simulation
mod <- readModelDb("Horita_2018_ethambutol")
sim <- rxode2::rxSolve(mod, events = events, keep = c("band", "WT"))
#> ℹ parameter labels from comments will be replaced by 'label()'
Replicate published figures
sim_cmax <- sim |>
  dplyr::filter(time <= 24, !is.na(Cc)) |>
  dplyr::group_by(id, band) |>
  dplyr::summarise(cmax = max(Cc), .groups = "drop")

ggplot(sim_cmax, aes(x = band, y = cmax)) +
  geom_boxplot(outlier.size = 0.5) +
  geom_hline(yintercept = 2.0, linetype = "dashed", colour = "red") +
  labs(x = "Weight band",
       y = "Simulated steady-state Cmax (ug/mL)",
       title = "Ethambutol steady-state Cmax by weight band",
       caption = "Replicates Horita 2018 Figure 9A. Dashed: 2 ug/mL adult normal range lower bound (tentative paediatric target).")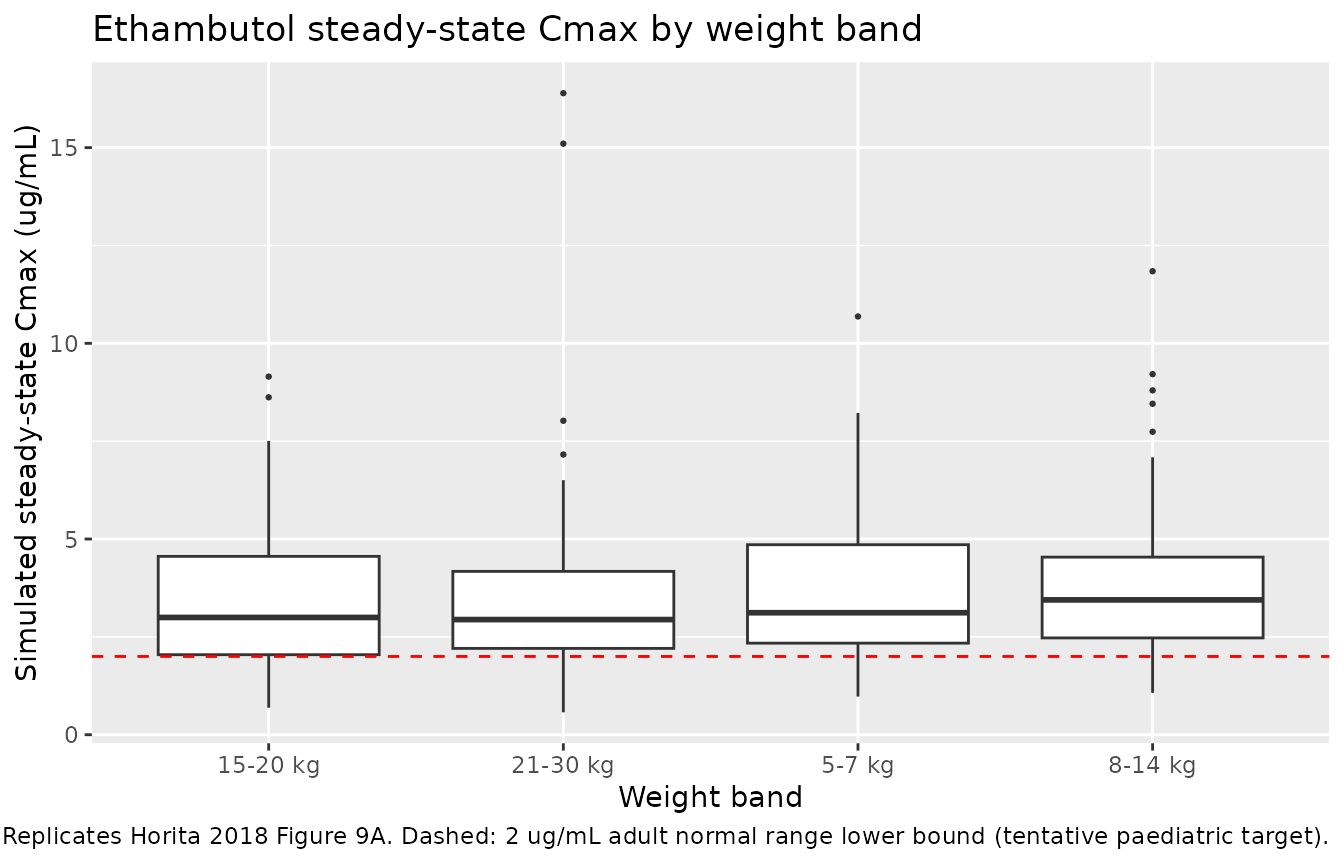
Replicates Figure 9 of Horita 2018 (ethambutol Cmax by weight band).
PKNCA validation
sim_nca <- sim |>
  dplyr::filter(!is.na(Cc), time <= 24) |>
  dplyr::select(id, time, Cc, band)

conc_obj <- PKNCA::PKNCAconc(sim_nca, Cc ~ time | band + id)

dose_df <- events |>
  dplyr::filter(evid == 1) |>
  dplyr::select(id, time, amt, band) |>
  dplyr::distinct()

dose_obj <- PKNCA::PKNCAdose(dose_df, amt ~ time | band + id)

intervals <- data.frame(
  start      = 0,
  end        = 24,
  cmax       = TRUE,
  tmax       = TRUE,
  auclast    = TRUE
)

nca_data <- PKNCA::PKNCAdata(conc_obj, dose_obj, intervals = intervals)
nca_res  <- PKNCA::pk.nca(nca_data)

nca_summary <- summary(nca_res)
knitr::kable(nca_summary, caption = "Simulated NCA parameters by weight band (Horita 2018 ethambutol).")| start | end | band | N | auclast | cmax | tmax |
|---|---|---|---|---|---|---|
| 0 | 24 | 15-20 kg | 100 | 13.9 [39.3] | 2.97 [59.7] | 1.50 [1.00, 6.00] |
| 0 | 24 | 21-30 kg | 100 | 12.6 [39.9] | 3.02 [57.5] | 2.00 [1.00, 4.50] |
| 0 | 24 | 5-7 kg | 100 | 15.3 [39.1] | 3.27 [55.2] | 2.00 [1.00, 5.00] |
| 0 | 24 | 8-14 kg | 100 | 16.0 [40.4] | 3.37 [52.2] | 2.00 [1.00, 4.00] |
Comparison against published NCA
Horita 2018 (Results “EMB” paragraph 1; supplementary Table S1) reports the observed cohort-pooled NCA: median dose 16.67 mg/kg (IQR 15.04-20.17), median Cmax 1.67 ug/mL (IQR 0.88-2.68), median AUC0-8 5.79 mgh/L (IQR 3.58-8.92). Cmax and AUC0-8 were significantly lower in children under 2 years (median Cmax 0.74 ug/mL, median AUC0-8 3.15 mgh/L; Results “EMB” paragraph 1). The paper notes that exposure was “quite low, regardless of weight, compared to that in adults.”
Assumptions and deviations
- Reference weight 14.3 kg. See the rifampicin vignette for the reference-weight derivation.
- Non-canonical allometric exponents. Horita 2018 uses estimated exponents (0.382, 0.474, 0.228, 0.858) rather than the canonical theoretical 0.75 / 1.0 values. The paper reports these as “Fixed” in the Table 4 IIV column, meaning no IIV is estimated on the exponent itself; the exponent values are population point estimates with reported RSEs (24-84%). The unusually low exponent on CL/F (0.382) and on V1/F (0.228) reflects the paper’s observation that EMB exposure is dissociated from weight in young children, consistent with the absorption-mechanism limitations discussed in Horita 2018 Discussion paragraph 4.
-
Zero-order absorption directly into central. The
model uses
dur(central) <- tk0andalag(central) <- tlag, so a dose event must specifycmt = "central"withrate = -2to invoke the model duration. This avoids a separate “depot” absorption compartment, which would be redundant for a pure zero-order absorption mechanism with no first-order phase. - Proportional residual error only. The paper selected a proportional-only error model based on OFV (Results “EMB” paragraph 1); no additive component is fit.
- Simulated cohort. The per-band doses are taken from Horita 2018 Table 3 (the 2-ug/mL Cmax target attainment row).