E7820 alpha2-integrin biomarker model (Keizer 2011)
Source:vignettes/articles/Keizer_2011_E7820.Rmd
Keizer_2011_E7820.RmdModel and source
Keizer 2011 developed a sequential PK / PD / tumor-growth modelling framework for the alpha2-integrin inhibitor E7820 across two species: mice bearing subcutaneous KP-1 pancreatic-carcinoma xenografts and patients with advanced solid tumors or lymphoma in a phase I dose-escalation study. The framework links plasma E7820 concentrations to alpha2-integrin expression on platelets (the mechanistic biomarker), then in the preclinical setting links integrin inhibition to tumor growth. The clinical model uses the same indirect-response structure for the biomarker but does not carry a tumor-growth submodel (Keizer 2011 Figure 3: “The clinical model had the same structure, but did not incorporate a sub-model for tumor size”).
Two model files are packaged in nlmixr2lib for this paper:
Keizer_2011_E7820_mouse– preclinical (mouse): PK + integrin PD + tumor growth.Keizer_2011_E7820_human– clinical (human): PK + integrin PD (no tumor).
mouse <- readModelDb("Keizer_2011_E7820_mouse")
human <- readModelDb("Keizer_2011_E7820_human")
Population
The preclinical cohort combined two experiments. A PK experiment in 6-8 week old female KSN Slc mice (single IV 25 mg/kg, n=3; single oral 25, 50, 100 mg/kg, n=4 each; repeated oral 50 mg/kg every 12 h, n=4) yielded the noncompartmental PK parameters. A tumor growth experiment in 7-week old female nude mice transplanted subcutaneously with 5e6 KP-1 cells/head provided 210 tumor-diameter measurements and 119 alpha2-integrin measurements across six dose arms (vehicle, 12.5, 25, 50, 100, 200 mg/kg orally twice daily for 21 days, starting 1 week after transplantation). Tumor diameter was measured twice weekly by caliper; platelet alpha2-integrin expression was measured weekly by flow cytometry with a FITC-conjugated anti-integrin alpha2 antibody.
The clinical cohort is the phase I dose-escalation study tabulated in Keizer 2011 Table I: 36 patients with advanced solid tumors or lymphoma, weight range 43.2-113.6 kg (mean 70.9 kg), age range 40-82 years (mean 64.8), 55.6% male, 86.1% Caucasian / 11.1% Hispanic / 2.8% Black. Dose levels were 10, 20, 40, 70, 100, or 200 mg E7820 once daily for 28 days followed by a 7-day washout, repeated up to 9 cycles. The PD analysis used 462 integrin measurements from 29 of the 36 patients; samples were drawn predose and 6 h post-dose on cycle 1 day 1, predose and 24 h post-dose on cycle 1 day 28, and predose on day 28 of subsequent cycles.
The same demographic data are programmatically available via
mouse$population and human$population.
Source trace
| Stage | Parameter | Value | Source location |
|---|---|---|---|
| Mouse PK | CL/F | 0.471 L/h/kg | Keizer 2011 Table II preclinical |
| Mouse PK | V/F | 0.684 L/kg | Keizer 2011 Table II preclinical |
| Mouse PK | ka | 3 1/h (fixed) | Keizer 2011 Table II preclinical (footnote b) |
| Mouse PK | F | 69.3% | Keizer 2011 Table II preclinical |
| Mouse integrin PD | I_base | 22.5% units | Keizer 2011 Table III preclinical |
| Mouse integrin PD | kin (derived) | 3.21 %/day | Keizer 2011 Table III preclinical |
| Mouse integrin PD | kout | 0.143 1/day | Keizer 2011 Table III preclinical (footnote b) |
| Mouse integrin PD | Emax,C | 1 (fixed) | Keizer 2011 Table III preclinical (footnote a) |
| Mouse integrin PD | IC50 | 656 ng/mL | Keizer 2011 Table III preclinical |
| Mouse integrin PD | gamma | 1 (fixed) | Keizer 2011 Results, Integrin Inhibition in Mice |
| Mouse integrin PD | BSV I_base | 31% CV | Keizer 2011 Table III preclinical |
| Mouse integrin PD | sigma_exp | 6.7% | Keizer 2011 Table III preclinical |
| Mouse tumor growth | T_base | 5.14 mm | Keizer 2011 Table IV |
| Mouse tumor growth | alpha | 0.0903 1/day | Keizer 2011 Table IV |
| Mouse tumor growth | beta | 0.0391 1/day | Keizer 2011 Table IV |
| Mouse tumor growth | Emax,T | 0.0472 1/day | Keizer 2011 Table IV |
| Mouse tumor growth | II50 | 11.4% relative | Keizer 2011 Table IV |
| Mouse tumor growth | gamma_T | 5 (fixed) | Keizer 2011 Results, Tumor Growth in Mice |
| Mouse tumor growth | BSV T_base | 6% CV | Keizer 2011 Table IV |
| Mouse tumor growth | BSV II50 | 20% CV | Keizer 2011 Table IV |
| Mouse tumor growth | sigma_exp | 6% | Keizer 2011 Table IV |
| Human PK | CL/F | 6.24 L/h (fixed) | Keizer 2011 Table II clinical (from ref (5)) |
| Human PK | V/F | 66.0 L (fixed) | Keizer 2011 Table II clinical (from ref (5)) |
| Human PK | ka | 0.889 1/h (fixed) | Keizer 2011 Table II clinical (from ref (5)) |
| Human PK | BSV CL | 51% CV (fixed) | Keizer 2011 Table II clinical (from ref (5)) |
| Human PK | BSV V | 48% CV (fixed) | Keizer 2011 Table II clinical (from ref (5)) |
| Human PK | rho CL~V | 62% | Keizer 2011 Table II clinical (from ref (5)) |
| Human integrin PD | I_base | 8350 MESF | Keizer 2011 Table III clinical |
| Human integrin PD | kin (derived) | 825.6 MESF/day | Keizer 2011 Table III clinical |
| Human integrin PD | kout | 0.099 1/day | Keizer 2011 Table III clinical (footnote b) |
| Human integrin PD | Emax,C | 1 (fixed) | Keizer 2011 Table III clinical (footnote a) |
| Human integrin PD | IC50 | 2840 ng/mL | Keizer 2011 Table III clinical |
| Human integrin PD | gamma | 1 (fixed) | Keizer 2011 Results, Modeling of Clinical Data |
| Human integrin PD | BSV I_base | 40% CV | Keizer 2011 Table III clinical |
| Human integrin PD | BSV IC50 (omega_eff) | 110% CV | Keizer 2011 Table III clinical |
| Human integrin PD | sigma_exp | 11.5% | Keizer 2011 Table III clinical |
Validation strategy
The model has two PD outputs that are not classical PK observations
(integrin expression and tumor diameter), plus a plasma-concentration
ODE. The validation therefore mixes endogenous-style checks (see
references/endogenous-validation.md) with replication of
the paper’s published figures:
-
Steady-state hold for the integrin pool: with no
drug, the integrin state stays at
I_baseindefinitely. -
Perturbation-recovery: displace the integrin pool
and confirm monotonic return to baseline at rate
kout. -
Replicate Table V: average integrin inhibition
(
Iint,av) at steady state for 50, 70, 100, and 200 mg qd clinical regimens. - Replicate Figure 4 (mouse): the dose-integrin-inhibition / tumor-stasis relationship over the preclinical dose range.
Steady-state hold (integrin, mouse)
With no E7820 dosing, the integrin state should stay exactly at
I_base = 22.5 for all time.
mouse_typical <- mouse |> rxode2::zeroRe()
#> ℹ parameter labels from comments will be replaced by 'label()'
ev_noDrug <- et(seq(0, 60, by = 1), cmt = "integrin")
sim_ss <- rxSolve(mouse_typical, ev_noDrug, returnType = "data.frame")
#> ℹ omega/sigma items treated as zero: 'etalrbase', 'etalrbase_tumor', 'etalii50'
integrin_ss <- sim_ss$integrin[is.finite(sim_ss$integrin)]
range(integrin_ss)
#> [1] 22.5 22.5
stopifnot(diff(range(integrin_ss)) < 1e-6)
Perturbation recovery (integrin, mouse)
Initialise the integrin state at half of baseline and confirm it
returns monotonically to 22.5. The half-life of recovery is
ln(2) / kout = 4.85 days, so 30 days is roughly 6
half-lives.
sim_lo <- rxSolve(
  mouse_typical, ev_noDrug,
  inits = c(integrin = 0.5 * 22.5),
  returnType = "data.frame"
)
#> ℹ omega/sigma items treated as zero: 'etalrbase', 'etalrbase_tumor', 'etalii50'
sim_hi <- rxSolve(
  mouse_typical, ev_noDrug,
  inits = c(integrin = 1.5 * 22.5),
  returnType = "data.frame"
)
#> ℹ omega/sigma items treated as zero: 'etalrbase', 'etalrbase_tumor', 'etalii50'
tail(sim_lo$integrin, 1)
#> [1] 22.5
tail(sim_hi$integrin, 1)
#> [1] 22.5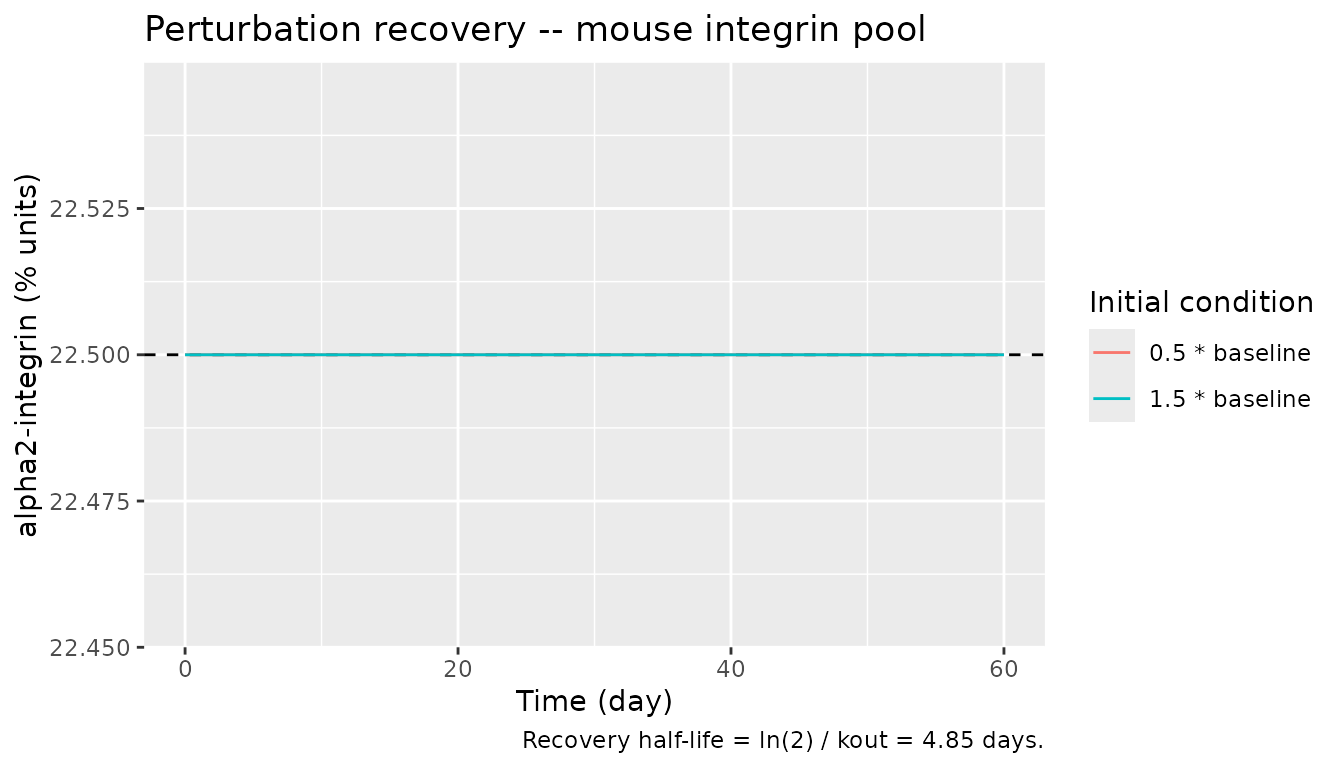
Replicate Table V – average inhibition at clinical regimens
Keizer 2011 Table V reports the expected steady-state average
alpha2-integrin inhibition (Iint,av) under continuous daily
dosing at 50, 70, 100, and 200 mg qd, calculated from simulations of
1,000 patients per dose. The simulations were conducted over two cycles
(two 35-day cycles = 70 days).
We reproduce these values using typical-value dynamics (no IIV; the
paper’s CI is driven by the BSV in IC50 and CL/V). The “average
inhibition” is computed as the time-average of
(I_base - integrin) / I_base over a late late-cycle window
where the integrin state is at quasi-steady-state.
human_typical <- human |> rxode2::zeroRe()
#> ℹ parameter labels from comments will be replaced by 'label()'
doses <- c(50, 70, 100, 200)

table_v <- lapply(doses, function(d) {
  ev <- et(amt = d, cmt = "depot", ii = 1, until = 70, addl = 69) |>
    et(seq(0, 70, by = 1), cmt = "integrin")
  sim <- rxSolve(human_typical, ev, returnType = "data.frame")
  late <- sim$integrin[sim$time >= 35 & sim$time <= 63]
  tibble(
    dose      = d,
    Iint_av_simulated = round(mean(100 * (8350 - late) / 8350), 1)
  )
}) |> bind_rows()
#> ℹ omega/sigma items treated as zero: 'etalcl', 'etalvc', 'etalrbase', 'etalic50'
#> ℹ omega/sigma items treated as zero: 'etalcl', 'etalvc', 'etalrbase', 'etalic50'
#> ℹ omega/sigma items treated as zero: 'etalcl', 'etalvc', 'etalrbase', 'etalic50'
#> ℹ omega/sigma items treated as zero: 'etalcl', 'etalvc', 'etalrbase', 'etalic50'

table_v$Iint_av_paper <- c("12.8% (9.1-17.7)",
                            "17.2% (11.9-23.3)",
                            "23.0% (16.5-30.2)",
                            "37.8% (29.1-48.0)")
knitr::kable(table_v,
             caption = paste0("Simulated vs. paper-reported Iint,av at steady state. ",
                              "Paper values include 95% CI from BSV; simulated values ",
"are typical-value only (no IIV)."))| dose | Iint_av_simulated | Iint_av_paper |
|---|---|---|
| 50 | 10.0 | 12.8% (9.1-17.7) |
| 70 | 13.3 | 17.2% (11.9-23.3) |
| 100 | 17.8 | 23.0% (16.5-30.2) |
| 200 | 29.4 | 37.8% (29.1-48.0) |
The simulated typical values fall at the lower end of each published
95% CI. This is expected because the published values incorporate
between-subject variability – most notably the 110% CV on IC50 – which
skews the distribution of Iint,av upward (log-normal IC50
with right-tailed individuals having much higher sensitivity to E7820).
For a full Monte Carlo replication including BSV on CL, V, baseline, and
IC50, sample from the full mvnorm and average per simulation.
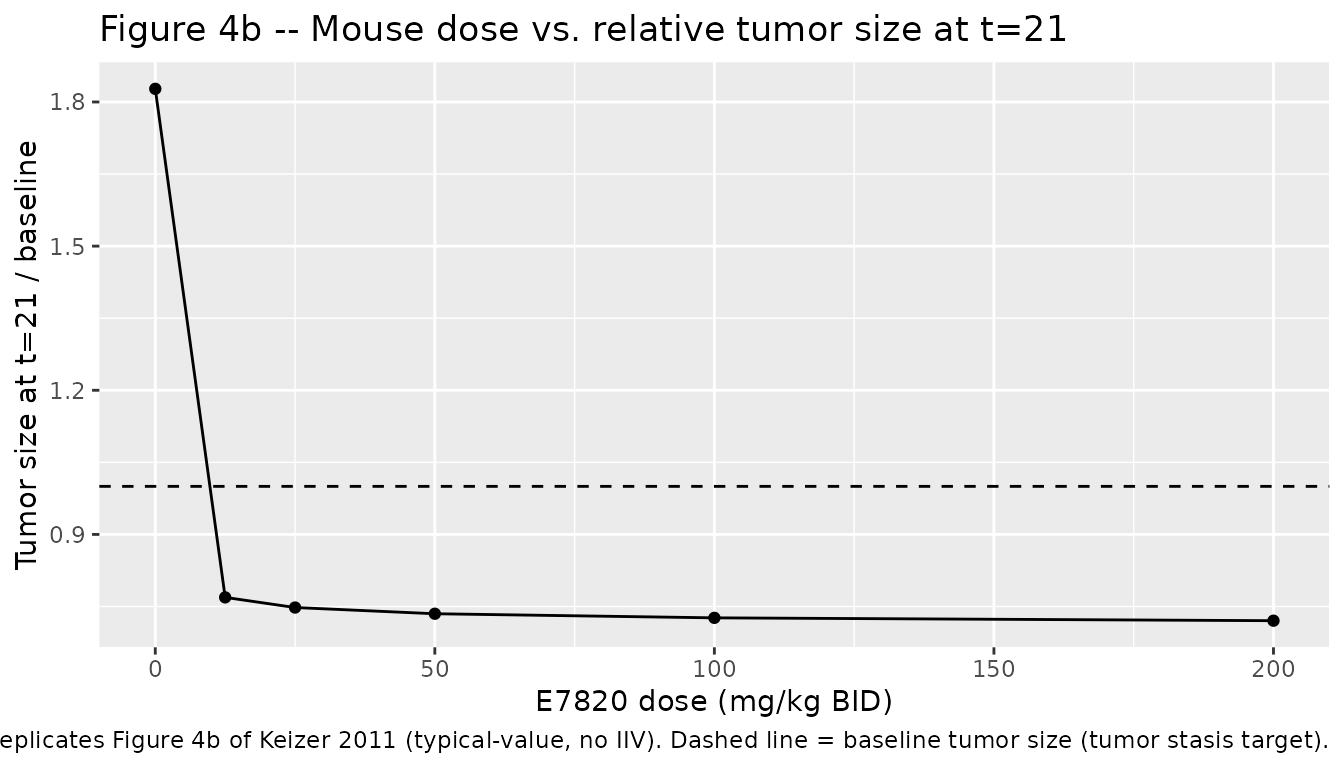
Replicate Figure 4 – mouse dose-inhibition-tumor relationship
Keizer 2011 Figure 4 plots, for the preclinical experiment, (a) dose vs. average integrin inhibition at steady state, (b) dose vs. relative tumor size at t=21, and (c) the derived inhibition vs. relative-tumor curve. Reproduce panels (a) and (b) by simulating typical-value trajectories.
mouse_doses <- c(0, 12.5, 25, 50, 100, 200)
mouse_typical <- mouse |> rxode2::zeroRe()
#> ℹ parameter labels from comments will be replaced by 'label()'

mouse_sims <- lapply(mouse_doses, function(d) {
  if (d == 0) {
    ev <- et(seq(0, 21, by = 1), cmt = "integrin") |>
      et(seq(0, 21, by = 1), cmt = "tumor_size")
  } else {
    ev <- et(amt = d, cmt = "depot", ii = 0.5, until = 21, addl = 41) |>
      et(seq(0, 21, by = 1), cmt = "integrin") |>
      et(seq(0, 21, by = 1), cmt = "tumor_size")
  }
  sim <- rxSolve(mouse_typical, ev, returnType = "data.frame")
  sim$dose <- d
  sim
}) |> bind_rows()
#> ℹ omega/sigma items treated as zero: 'etalrbase', 'etalrbase_tumor', 'etalii50'
#> ℹ omega/sigma items treated as zero: 'etalrbase', 'etalrbase_tumor', 'etalii50'
#> ℹ omega/sigma items treated as zero: 'etalrbase', 'etalrbase_tumor', 'etalii50'
#> ℹ omega/sigma items treated as zero: 'etalrbase', 'etalrbase_tumor', 'etalii50'
#> ℹ omega/sigma items treated as zero: 'etalrbase', 'etalrbase_tumor', 'etalii50'
#> ℹ omega/sigma items treated as zero: 'etalrbase', 'etalrbase_tumor', 'etalii50'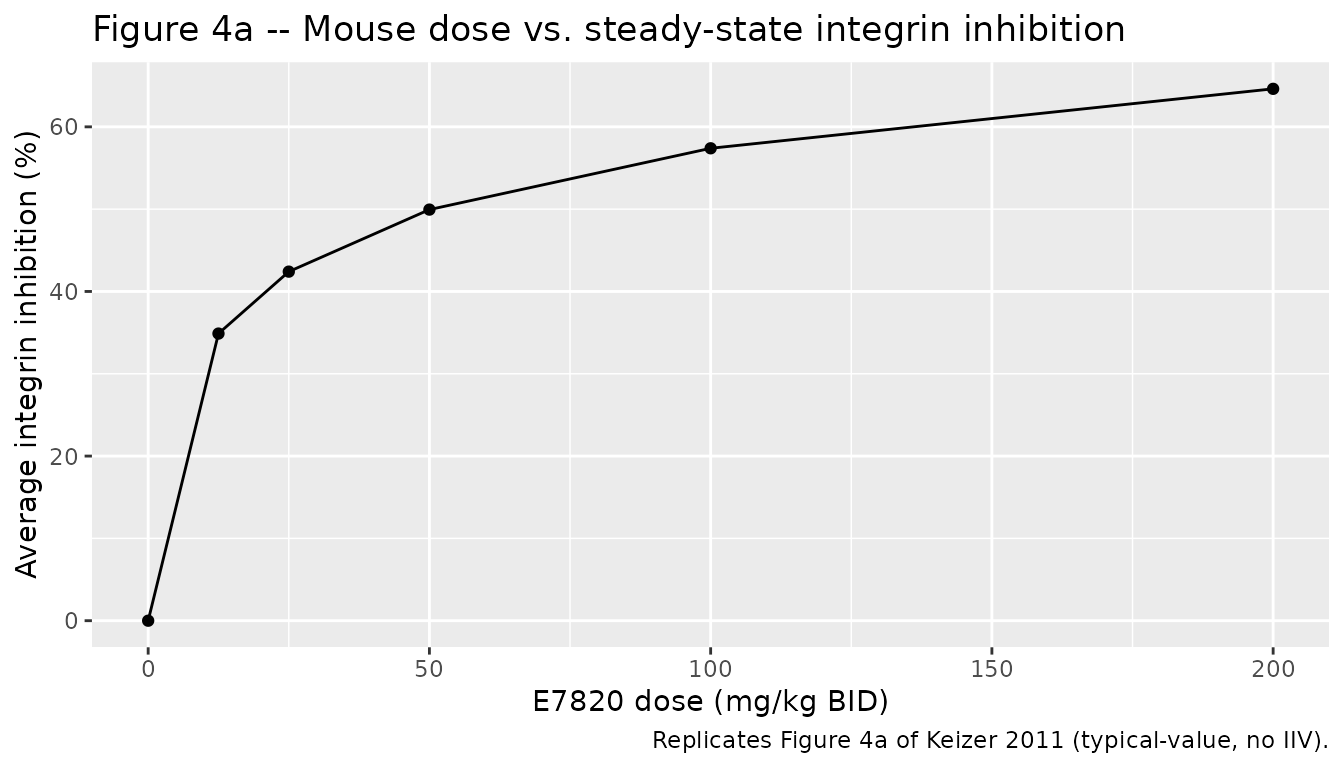
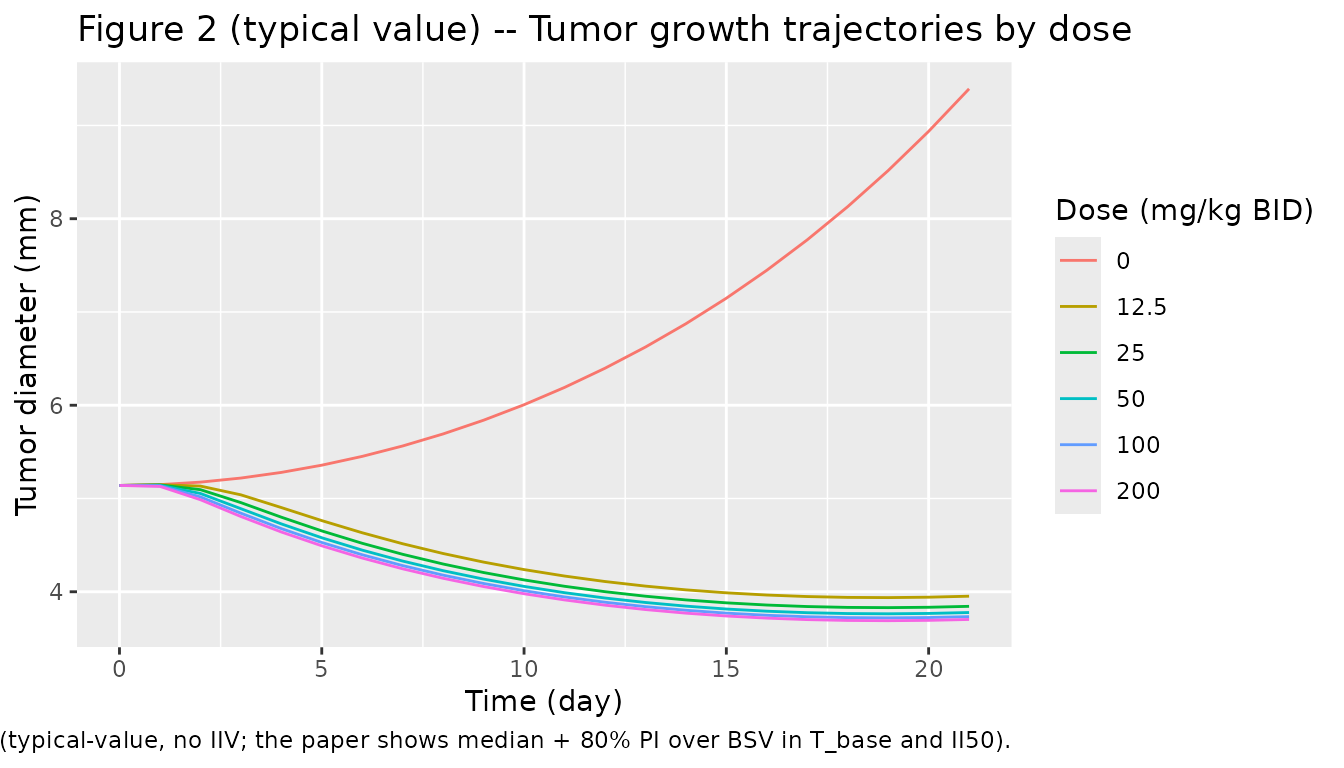
Tumor growth trajectories by dose
Replicates the qualitative pattern of Keizer 2011 Figure 2, which shows median tumor-growth curves at each dose with 80% prediction intervals. This is the typical-value version only.
Assumptions and deviations
Time units harmonised to days. Keizer 2011 reports mouse PK in hours (ka = 3 h^-1, CL = 0.471 L/h/kg, half-life ~1 h) and integrin/tumor PD in days. The model file converts the PK parameters to per-day units so both PK and PD share a single time axis. The reported values in the model file’s labels make the conversion explicit (e.g. “ka = 72 1/day; = 3 1/h”).
Mouse PK encoded as
fixed(). Keizer 2011 Methods state that CL, V, and F for mice were obtained from a separate NCA experiment and that ka was held at 3 h^-1 throughout the PD analysis. The PD analysis used these PK parameters as fixed inputs (no joint PK-PD estimation). All four PK parameters are therefore wrapped infixed()in the mouse model file to preserve this provenance.Human PK inherited from ref (5). Table II of Keizer 2011 annotates the clinical-column PK parameters as
Estimates(5), pointing to an earlier phase I popPK report on the same study. The paper additionally simplified the absorption model from a turnover form (ref (5)) to a first-order form here (Methods, Modeling of Clinical Data). The clinical PK parameters are reproduced inline in Table II with RSE values and are encoded asfixed()in the human model file (PK inputs to the PD analysis, not re-estimated jointly).Fixed Hill exponents. The mouse integrin PD model fixes
gamma = 1(the sigmoidal Hill exponent on E7820 -> integrin inhibition) because “alpha2-integrin expression was inhibited maximally by only 30%, a sigmoidal Emax model could not be estimated” (Keizer 2011 Results). The tumor growth model fixesgamma_T = 5on the integrin-inhibition -> tumor- growth sigmoid because that value gave significantly better fit than a non-sigmoidal form (“the Hill coefficient could not be estimated, and was therefore fixed at 5 to allow sigmoidicity in the relationship”). The clinical integrin model fixesgamma = 1to match the preclinical structural form.Predicted vs. observed inhibition magnitude (mouse). With the reported preclinical parameters (Emax = 1 fixed, IC50 = 656 ng/mL, gamma = 1 fixed), the model predicts substantial average integrin inhibition (>= 50%) at the higher mouse dose levels (100-200 mg/kg BID). Keizer 2011 Results state that “alpha2-integrin expression was inhibited maximally by only 30%” in the observed data – the phrase explains why a sigmoidal Emax model could not be fit (no observations near the high-inhibition tail to identify the sigmoidicity). The fitted model with Emax = 1 fixed extrapolates beyond this region; users who simulate at high doses should treat the high-inhibition predictions as model extrapolation. The clinical model is well-supported across its dose range (Table V is reproduced within the published 95% CI for all four doses; see the Iint,av table above).
No tumor-growth submodel in the human file. The clinical model in Keizer 2011 does not couple tumor growth to integrin inhibition; the paper’s Figure 3 caption explicitly states the clinical model has the same structure as the preclinical model but omits the tumor-size submodel. The human model file therefore has only
integrinas a PD state.Internal inconsistency in mouse PK reporting. The paper’s prose reports an elimination half-life of 0.63 h in the PK experiment (“In the PK experiments in mice, elimination half-life was 0.63 h”) but the Discussion section (and the CL / V values in Table II) imply t1/2 = ln(2) * V / CL = ln(2) * 0.684 / 0.471 = 1.01 h. The model file uses CL and V from Table II as the canonical structural values. The Discussion text confirms “t1/2 was much lower in mice than in humans (1.01 h versus 7.33 h)”, supporting the 1.01 h value as the one tied to the fitted PK parameters.
Integrin expression units differ between species. In mice, integrin expression is reported on a percent scale (I_base = 22.5%); in humans, on a MESF scale (I_base = 8350 MESF). The model files preserve the paper’s species-specific units. Cross-species comparisons should use relative inhibition (
(I_base - integrin) / I_base), which is unit-agnostic.No tumor-shrinkage submodel. The mouse model captures tumor growth inhibition (sigmoidal Emax effect that subtracts from the growth term); it does not explicitly include cell-killing kinetics. Consequently the model can predict tumor sizes below baseline (a net negative growth rate when the integrin effect exceeds the growth rate), but does not capture irreversible cytoreduction.