Bepotastine (Yoon 2024)
Source:vignettes/articles/Yoon_2024_bepotastine.Rmd
Yoon_2024_bepotastine.RmdModel and source
- Citation: Yoon S, Jin BH, Kim CO, Park K, Park MS, Chae D. Pharmacokinetic Modeling of Bepotastine for Determination of Optimal Dosage Regimen in Pediatric Patients with Allergic Rhinitis or Urticaria. Pharmaceutics. 2024;16(3):334. doi:10.3390/pharmaceutics16030334. PMCID: PMC10975960.
- Description: One-compartment population PK model for oral bepotastine in healthy Korean adults and Korean children aged 2-6 years with allergic rhinitis or urticaria (Yoon 2024). First-order absorption with an absorption lag time feeds a one-compartment disposition model. Body weight is the only covariate, entering apparent clearance and apparent volume as fixed allometric power functions (exponents 0.75 and 1) normalised to 70 kg. IIV on ka, CL/F, V/F and lag time with CL-V and CL-lag correlations; combined proportional and additive residual error.
- Article: https://doi.org/10.3390/pharmaceutics16030334
Yoon et al. pooled a single-dose study in healthy adults with a sparse-sampling study in children aged 2-6 years to build a population PK model for oral bepotastine, and used it (alongside a separate PK-Sim PBPK model) to propose pediatric doses that match the exposure of a 10 mg dose in a 70 kg adult. This package contains the population PK model only; the PBPK model is a platform model whose physiology comes from the PK-Sim database and is not reproducible from the published tables.
Population
The analysis pooled two prospective studies run at Severance Hospital, Seoul (Methods 2.1, Table 1):
- Study 1 – 32 healthy Korean men, median age 24 (19-37) years, median weight 70.8 (56.8-89.6) kg, a single 10 mg bepotastine tablet, 13 samples over 24 h.
- Study 2 – 30 Korean children with allergic rhinitis or urticaria, median age 5 (2-6) years, median weight 17.8 (13-26) kg, 19 boys and 11 girls, given 1.5 mL of a 2 mg/mL dry syrup (3 mg) twice daily for at least four days, with two samples per child (one at 0.5-2 h and one at 6-12 h post-dose).
str(rxode2::rxode(readModelDb("Yoon_2024_bepotastine"))$population)
#> List of 11
#>  $ species       : chr "human"
#>  $ n_subjects    : num 62
#>  $ n_studies     : num 2
#>  $ age_range     : chr "2-37 years (adults 19-37, median 24; children 2-6, median 5)"
#>  $ weight_range  : chr "13-89.6 kg (adults 56.8-89.6, median 70.8; children 13-26, median 17.8)"
#>  $ sex_female_pct: num 17.7
#>  $ race_ethnicity: chr "Korean (62/62)"
#>  $ disease_state : chr "32 healthy adult men plus 30 children aged 2-6 years with allergic rhinitis or urticaria"
#>  $ dose_range    : chr "Adults: single 10 mg oral tablet. Children: 3 mg oral dry syrup (1.5 mL of 2 mg/mL) twice daily for at least four days."
#>  $ regions       : chr "Republic of Korea (Severance Hospital, Seoul)"
#>  $ notes         : chr "Table 1 gives the baseline demographics by study. Adults were sampled intensively (13 samples over 24 h; the 0 "| __truncated__
Source trace
Every ini() value carries an in-file comment naming its
source. The table collects them.
| Equation / parameter | Value | Source location |
|---|---|---|
lka |
log(4.21) 1/h | Table 2, KA; Results 3.1 |
lcl |
log(28.0) L/h | Table 2, CL; Results 3.1 |
lvc |
log(103.0) L | Table 2, V; Results 3.1 |
ltlag |
log(0.27) h | Table 2, ALAG; Results 3.1 |
e_wt_cl |
0.75 (fixed) | Table 2, ‘Exponent of CL’; Methods 2.2 equation |
e_wt_vc |
1.0 (fixed) | Table 2, ‘Exponent of V’; Methods 2.2 equation |
etalka |
0.8198 (CV 112.7%) | Table 2, IIV of KA |
etalcl |
0.04939 (CV 22.5%) | Table 2, IIV of CL |
etalvc |
0.04727 (CV 22.0%) | Table 2, IIV of V |
etaltlag |
0.09982 (CV 32.4%) | Table 2, IIV of ALAG |
cov(etalcl, etalvc) |
0.03140 (r = 0.65) | Table 2, CORR of CL-V |
cov(etalcl, etaltlag) |
0.03300 (r = 0.47) | Table 2, CORR of CL-ALAG |
propSd |
0.103 | Table 2, proportional error 10.3 |
addSd |
sqrt(0.1) = 0.316 ng/mL (fixed) | Table 2, additive error 0.1; Results 3.1 (‘additive error variance fixed at 0.1’) |
cl, vc allometry |
(WT/70)^0.75, (WT/70)^1
|
Methods 2.2 equations |
d/dt(depot), d/dt(central),
alag(depot)
|
one compartment, first-order absorption with lag | Results 3.1 |
Virtual cohort
The individual data are not public. Two virtual cohorts mirror Table 1: adults with weight drawn from a normal distribution with mean 70.95 kg and SD 8.04 kg truncated to the observed 56.8-89.6 kg range, and children with mean 18.90 kg and SD 3.78 kg truncated to 13-26 kg. Adults receive one 10 mg dose; children receive 3 mg every 12 h for five days and are observed over the last dosing interval, the steady-state window in which the pediatric samples were taken.
set.seed(20240227)
rxode2::rxSetSeed(20240227)

n_per_arm <- 150

draw_wt <- function(n, mean, sd, lo, hi) {
  wt <- rnorm(n * 3, mean, sd)
  wt <- wt[wt >= lo & wt <= hi]
  wt[seq_len(n)]
}

obs_grid <- c(0.25, 0.33, 0.5, 0.67, 0.75, 1, 1.33, 1.5, 1.67, 2, 2.5, 3, 4, 5, 6, 8, 10, 12, 16, 20, 24)

adults <- tibble(
  id = seq_len(n_per_arm),
  WT = draw_wt(n_per_arm, 70.95, 8.04, 56.8, 89.6),
  group = "Healthy adults (10 mg single dose)"
)
children <- tibble(
  id = n_per_arm + seq_len(n_per_arm),
  WT = draw_wt(n_per_arm, 18.90, 3.78, 13, 26),
  group = "Children 2-6 y (3 mg every 12 h)"
)

adult_events <- bind_rows(
  adults |> mutate(time = 0, amt = 10, evid = 1L, cmt = "depot"),
  tidyr::crossing(adults, time = c(0, obs_grid)) |>
    mutate(amt = 0, evid = 0L, cmt = "central")
)

last_dose <- 9 * 12
child_events <- bind_rows(
  tidyr::crossing(children, time = seq(0, last_dose, by = 12)) |>
    mutate(amt = 3, evid = 1L, cmt = "depot"),
  tidyr::crossing(children, time = last_dose + c(0, obs_grid[obs_grid <= 12])) |>
    mutate(amt = 0, evid = 0L, cmt = "central")
)

events <- bind_rows(adult_events, child_events) |>
  arrange(id, time, desc(evid))
stopifnot(!anyDuplicated(unique(events[, c("id", "time", "evid")])))
Simulation
mod <- readModelDb("Yoon_2024_bepotastine")
sim <- rxode2::rxSolve(mod, events = events, keep = c("group", "WT")) |>
  as.data.frame() |>
  mutate(
    tad = ifelse(grepl("^Children", group), time - last_dose, time),
    group = factor(group, levels = c(adults$group[1], children$group[1]))
  )
Replicate published figures
Figure 4 – visual predictive check
# Replicates Figure 4 of Yoon 2024: 5th, 50th and 95th percentiles of the
# simulated concentrations (including residual error) by time after dose.
sim |>
  filter(tad >= 0) |>
  group_by(group, tad) |>
  summarise(
    Q05 = quantile(sim, 0.05),
    Q50 = quantile(sim, 0.50),
    Q95 = quantile(sim, 0.95),
    .groups = "drop"
  ) |>
  ggplot(aes(tad, Q50)) +
  geom_ribbon(aes(ymin = Q05, ymax = Q95), fill = "steelblue", alpha = 0.25) +
  geom_line(colour = "firebrick") +
  facet_wrap(~group) +
  coord_cartesian(xlim = c(0, 24), ylim = c(0, 175)) +
  labs(
    x = "Time after dose (h)", y = "Bepotastine concentration (ng/mL)",
    caption = "Replicates Figure 4 of Yoon 2024 (median and 90% prediction interval)."
  )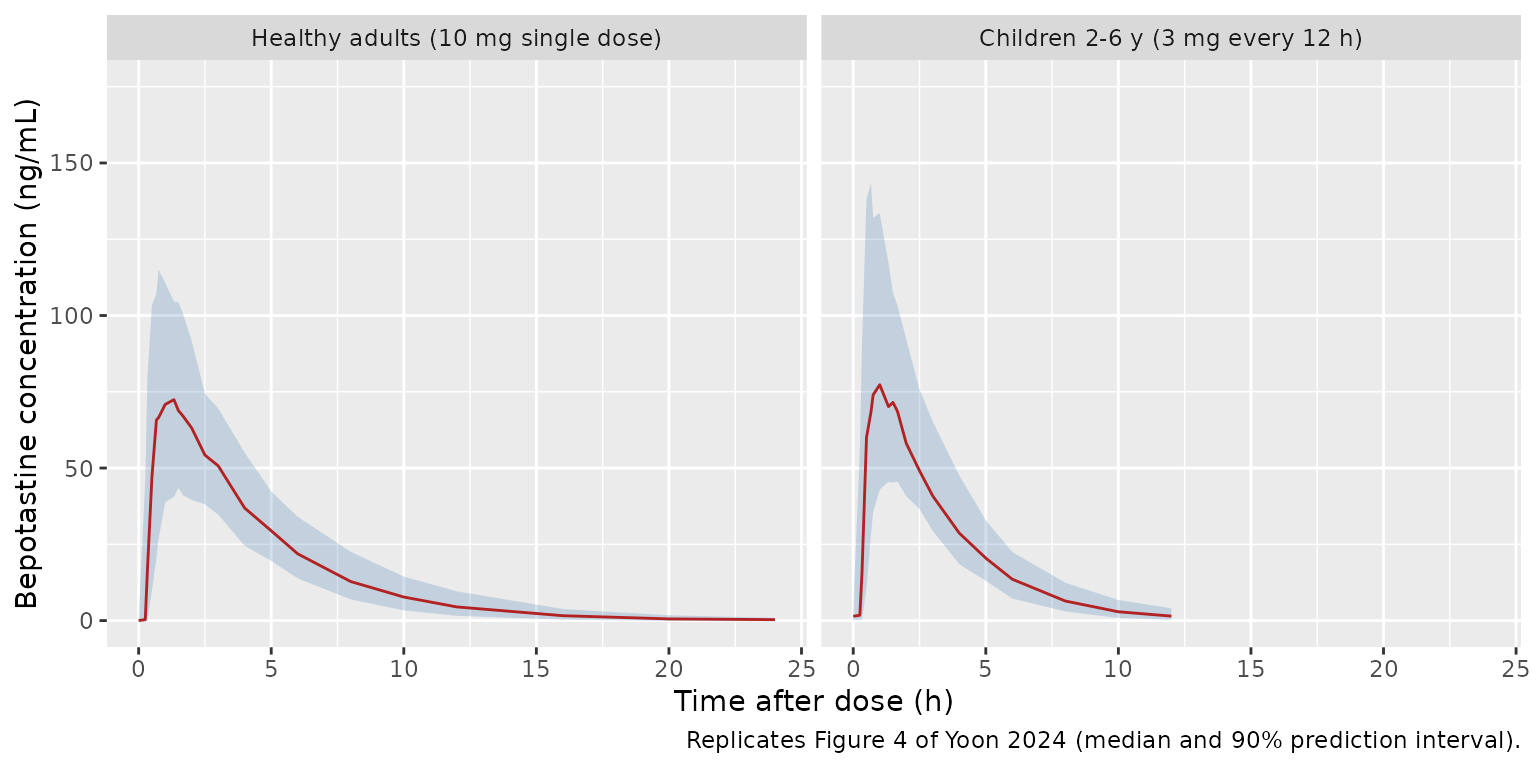
The published VPC shows an adult median peak near 75 ng/mL at about 1 h with a 95th percentile near 125 ng/mL, and a pediatric median peak near 70 ng/mL; the simulated bands sit in the same place.
Table 3 and Table 6 – weight-based pediatric doses
The paper’s dose search (Methods 2.4) used typical-value simulations: for each weight, the dose that gives the same Cmax, or the same AUClast, as 10 mg in a 70 kg adult. With linear kinetics that dose is the ratio of the adult exposure after 10 mg to the child exposure after 1 mg, computed here on a 0.01 h grid over 24 h after a single dose.
mod_typical <- rxode2::zeroRe(mod)
fine_grid <- seq(0, 24, by = 0.01)

typical_exposure <- function(wt, dose) {
  ev <- rxode2::et(amt = dose, cmt = "depot") |>
    rxode2::et(fine_grid, cmt = "central")
  s <- as.data.frame(rxode2::rxSolve(mod_typical, ev, params = data.frame(WT = wt)))
  c(
    cmax = max(s$Cc),
    auclast = sum(diff(s$time) * (head(s$Cc, -1) + tail(s$Cc, -1)) / 2)
  )
}

adult_ref <- typical_exposure(70, 10)
#> ℹ omega/sigma items treated as zero: 'etaltlag', 'etalcl', 'etalvc', 'etalka'

dose_for_weight <- function(wt) {
  child <- typical_exposure(wt, 1)
  tibble(
    WT = wt,
    dose_cmax = adult_ref[["cmax"]] / child[["cmax"]],
    dose_auc = adult_ref[["auclast"]] / child[["auclast"]]
  )
}

table3 <- tibble(
  WT = 10:31,
  pub_cmax = c(1.6, 1.7, 1.9, 2.0, 2.1, 2.3, 2.4, 2.6, 2.7, 2.9, 3.0,
               3.2, 3.3, 3.4, 3.6, 3.7, 3.9, 4.0, 4.1, 4.3, 4.4, 4.6),
  pub_auc = c(2.3, 2.5, 2.7, 2.8, 3.0, 3.1, 3.3, 3.5, 3.6, 3.8, 3.9,
              4.0, 4.2, 4.3, 4.5, 4.6, 4.8, 4.9, 5.0, 5.2, 5.3, 5.4)
) |>
  left_join(bind_rows(lapply(10:31, dose_for_weight)), by = "WT")
#> ℹ omega/sigma items treated as zero: 'etaltlag', 'etalcl', 'etalvc', 'etalka'
#> ℹ omega/sigma items treated as zero: 'etaltlag', 'etalcl', 'etalvc', 'etalka'
#> ℹ omega/sigma items treated as zero: 'etaltlag', 'etalcl', 'etalvc', 'etalka'
#> ℹ omega/sigma items treated as zero: 'etaltlag', 'etalcl', 'etalvc', 'etalka'
#> ℹ omega/sigma items treated as zero: 'etaltlag', 'etalcl', 'etalvc', 'etalka'
#> ℹ omega/sigma items treated as zero: 'etaltlag', 'etalcl', 'etalvc', 'etalka'
#> ℹ omega/sigma items treated as zero: 'etaltlag', 'etalcl', 'etalvc', 'etalka'
#> ℹ omega/sigma items treated as zero: 'etaltlag', 'etalcl', 'etalvc', 'etalka'
#> ℹ omega/sigma items treated as zero: 'etaltlag', 'etalcl', 'etalvc', 'etalka'
#> ℹ omega/sigma items treated as zero: 'etaltlag', 'etalcl', 'etalvc', 'etalka'
#> ℹ omega/sigma items treated as zero: 'etaltlag', 'etalcl', 'etalvc', 'etalka'
#> ℹ omega/sigma items treated as zero: 'etaltlag', 'etalcl', 'etalvc', 'etalka'
#> ℹ omega/sigma items treated as zero: 'etaltlag', 'etalcl', 'etalvc', 'etalka'
#> ℹ omega/sigma items treated as zero: 'etaltlag', 'etalcl', 'etalvc', 'etalka'
#> ℹ omega/sigma items treated as zero: 'etaltlag', 'etalcl', 'etalvc', 'etalka'
#> ℹ omega/sigma items treated as zero: 'etaltlag', 'etalcl', 'etalvc', 'etalka'
#> ℹ omega/sigma items treated as zero: 'etaltlag', 'etalcl', 'etalvc', 'etalka'
#> ℹ omega/sigma items treated as zero: 'etaltlag', 'etalcl', 'etalvc', 'etalka'
#> ℹ omega/sigma items treated as zero: 'etaltlag', 'etalcl', 'etalvc', 'etalka'
#> ℹ omega/sigma items treated as zero: 'etaltlag', 'etalcl', 'etalvc', 'etalka'
#> ℹ omega/sigma items treated as zero: 'etaltlag', 'etalcl', 'etalvc', 'etalka'
#> ℹ omega/sigma items treated as zero: 'etaltlag', 'etalcl', 'etalvc', 'etalka'

table3 |>
  transmute(
    "Weight (kg)" = WT,
    "Cmax-based, model" = round(dose_cmax, 2),
    "Cmax-based, Table 3" = pub_cmax,
    "AUClast-based, model" = round(dose_auc, 2),
    "AUClast-based, Table 3" = pub_auc
  ) |>
knitr::kable(caption = "Recommended doses (mg) by body weight: model vs. Yoon 2024 Table 3.")| Weight (kg) | Cmax-based, model | Cmax-based, Table 3 | AUClast-based, model | AUClast-based, Table 3 |
|---|---|---|---|---|
| 10 | 1.54 | 1.6 | 2.32 | 2.3 |
| 11 | 1.69 | 1.7 | 2.49 | 2.5 |
| 12 | 1.83 | 1.9 | 2.66 | 2.7 |
| 13 | 1.98 | 2.0 | 2.82 | 2.8 |
| 14 | 2.13 | 2.1 | 2.99 | 3.0 |
| 15 | 2.27 | 2.3 | 3.14 | 3.1 |
| 16 | 2.42 | 2.4 | 3.30 | 3.3 |
| 17 | 2.56 | 2.6 | 3.45 | 3.5 |
| 18 | 2.70 | 2.7 | 3.61 | 3.6 |
| 19 | 2.85 | 2.9 | 3.75 | 3.8 |
| 20 | 2.99 | 3.0 | 3.90 | 3.9 |
| 21 | 3.13 | 3.2 | 4.05 | 4.0 |
| 22 | 3.28 | 3.3 | 4.19 | 4.2 |
| 23 | 3.42 | 3.4 | 4.33 | 4.3 |
| 24 | 3.56 | 3.6 | 4.47 | 4.5 |
| 25 | 3.71 | 3.7 | 4.61 | 4.6 |
| 26 | 3.85 | 3.9 | 4.75 | 4.8 |
| 27 | 3.99 | 4.0 | 4.89 | 4.9 |
| 28 | 4.13 | 4.1 | 5.02 | 5.0 |
| 29 | 4.28 | 4.3 | 5.16 | 5.2 |
| 30 | 4.42 | 4.4 | 5.29 | 5.3 |
| 31 | 4.56 | 4.6 | 5.42 | 5.4 |
# Typical-value calculation: both sides use the same parameters, so the only
# slack is the paper's rounding to 0.1 mg (and its unknown time grid for
# Cmax). Largest observed differences: 0.07 mg (Cmax) and 0.05 mg (AUClast).
stopifnot(
  max(abs(table3$dose_cmax - table3$pub_cmax)) < 0.1,
  max(abs(table3$dose_auc - table3$pub_auc)) < 0.1
)
table6 <- tibble(
  age = 2:6,
  WT = c(14.0, 14.4, 15.9, 17.9, 19.6),
  pub_auc = c(3.0, 3.0, 3.3, 3.6, 3.8),
  pub_cmax = c(2.1, 2.2, 2.4, 2.7, 3.0)
) |>
  left_join(bind_rows(lapply(c(14.0, 14.4, 15.9, 17.9, 19.6), dose_for_weight)), by = "WT")
#> ℹ omega/sigma items treated as zero: 'etaltlag', 'etalcl', 'etalvc', 'etalka'
#> ℹ omega/sigma items treated as zero: 'etaltlag', 'etalcl', 'etalvc', 'etalka'
#> ℹ omega/sigma items treated as zero: 'etaltlag', 'etalcl', 'etalvc', 'etalka'
#> ℹ omega/sigma items treated as zero: 'etaltlag', 'etalcl', 'etalvc', 'etalka'
#> ℹ omega/sigma items treated as zero: 'etaltlag', 'etalcl', 'etalvc', 'etalka'

table6 |>
  transmute(
    "Age (y)" = age,
    "Median weight (kg)" = WT,
    "AUClast-based, model" = round(dose_auc, 2),
    "AUClast-based, Table 6 PopPK" = pub_auc,
    "Cmax-based, model" = round(dose_cmax, 2),
    "Cmax-based, Table 6 PopPK" = pub_cmax
  ) |>
knitr::kable(caption = "PopPK doses (mg) at the median weight of each age group: model vs. Yoon 2024 Table 6.")| Age (y) | Median weight (kg) | AUClast-based, model | AUClast-based, Table 6 PopPK | Cmax-based, model | Cmax-based, Table 6 PopPK |
|---|---|---|---|---|---|
| 2 | 14.0 | 2.99 | 3.0 | 2.13 | 2.1 |
| 3 | 14.4 | 3.05 | 3.0 | 2.18 | 2.2 |
| 4 | 15.9 | 3.28 | 3.3 | 2.40 | 2.4 |
| 5 | 17.9 | 3.59 | 3.6 | 2.69 | 2.7 |
| 6 | 19.6 | 3.84 | 3.8 | 2.93 | 3.0 |
stopifnot(
  max(abs(table6$dose_cmax - table6$pub_cmax)) < 0.1,
  max(abs(table6$dose_auc - table6$pub_auc)) < 0.1
)
All 54 published popPK doses are reproduced to within 0.1 mg, which is the precision at which the paper reports them.
PKNCA validation
sim_nca <- sim |>
  filter(!is.na(Cc), tad >= 0) |>
  transmute(id, time = tad, Cc, group = as.character(group))
sim_nca <- bind_rows(
  sim_nca,
  sim_nca |> distinct(id, group) |> mutate(time = 0, Cc = 0)
) |>
  distinct(id, group, time, .keep_all = TRUE) |>
  arrange(id, group, time)

dose_df <- sim_nca |>
  distinct(id, group) |>
  mutate(time = 0, amt = ifelse(grepl("^Healthy", group), 10, 3))

conc_obj <- PKNCA::PKNCAconc(sim_nca, Cc ~ time | group + id)
dose_obj <- PKNCA::PKNCAdose(dose_df, amt ~ time | group + id)

intervals <- bind_rows(
  data.frame(
    group = adults$group[1], start = 0, end = 24,
    cmax = TRUE, tmax = TRUE, auclast = TRUE, half.life = TRUE
  ),
  data.frame(
    group = children$group[1], start = 0, end = 12,
    cmax = TRUE, tmax = TRUE, auclast = TRUE, half.life = TRUE
  )
)

nca_res <- PKNCA::pk.nca(PKNCA::PKNCAdata(conc_obj, dose_obj, intervals = intervals))
summary(nca_res)
#>  start end                              group   N    auclast        cmax
#>      0  24 Healthy adults (10 mg single dose) 150 353 [22.2] 75.3 [27.7]
#>      0  12   Children 2-6 y (3 mg every 12 h) 150 279 [24.1] 82.3 [33.1]
#>                tmax    half.life
#>  1.00 [0.330, 3.00] 2.62 [0.491]
#>  1.00 [0.330, 3.00] 1.86 [0.360]
#>
#> Caption: auclast, cmax: geometric mean and geometric coefficient of variation; tmax: median and range; half.life: arithmetic mean and standard deviation; N: number of subjects
Comparison against published NCA
The paper reports NCA values only for its PBPK model (Results 3.3): Cmax 88.67 ng/mL, AUClast 374.65 h*ng/mL, half-life 2.69 h and Tmax 0.95 h for a 10 mg tablet in adults, described as similar to the values reported in the literature. They are the closest published reference for the adult arm of the population PK model, with the caveat that they come from a different model of the same data.
published <- tibble::tribble(
  ~group, ~cmax, ~tmax, ~auclast, ~half.life,
  adults$group[1], 88.67, 0.95, 374.65, 2.69
)

cmp <- nlmixr2lib::ncaComparisonTable(
  simulated = nca_res,
  reference = published,
  by = "group",
  units = c(cmax = "ng/mL", tmax = "h", auclast = "h*ng/mL", half.life = "h"),
  tolerance_pct = 20
)

knitr::kable(
  cmp,
  caption = "Simulated popPK NCA (adults, 10 mg) vs. the paper's adult PBPK values. * differs by >20%."
)| NCA parameter | group | Reference | Simulated | % diff |
|---|---|---|---|---|
| Cmax (ng/mL) | Healthy adults (10 mg single dose) | 88.7 | 76.6 | -13.6% |
| Tmax (h) | Healthy adults (10 mg single dose) | 0.95 | 1 | +5.3% |
| AUClast (h*ng/mL) | Healthy adults (10 mg single dose) | 375 | 349 | -6.8% |
| t½ (h) | Healthy adults (10 mg single dose) | 2.69 | 2.57 | -4.4% |
adult_nca <- as.data.frame(nca_res) |>
  filter(group == adults$group[1], PPTESTCD %in% c("auclast", "half.life"))
med_auc <- median(adult_nca$PPORRES[adult_nca$PPTESTCD == "auclast"])
med_hl <- median(adult_nca$PPORRES[adult_nca$PPTESTCD == "half.life"])
# The typical adult AUC is 10 mg / 28 L/h = 357 h*ng/mL and the typical
# half-life 0.693 * 103 / 28 = 2.55 h. A wrong CL, V or unit factor moves the
# cohort medians by far more than 15%.
stopifnot(
  abs(med_auc / 374.65 - 1) < 0.15,
  abs(med_hl / 2.69 - 1) < 0.15
)
For the children, the PBPK model gave Cmax 75.46 ng/mL, AUClast 350.63 hng/mL, half-life 4.08 h and Tmax 1.90 h after 3 mg of dry syrup in the fed state. The population PK model has no age or formulation effect beyond body weight, so its typical child at 18.9 kg has CL/F = 28 x (18.9/70)^0.75 = 10.5 L/h (AUC about 286 hng/mL for 3 mg) and a half-life near 1.8 h; the paper discusses this difference between its two models (Discussion), so those PBPK values are not used as a gate here.
Assumptions and deviations
- IIV scale. Table 2 reports the inter-individual variability as CV% without stating the conversion. The variances use the log-normal relationship omega^2 = log(1 + CV^2). The alternative reading (CV% = 100 x omega) gives identical values to two significant figures for CL, V and lag time and a larger KA variance (1.27 instead of 0.82); simulations under the two readings give visually indistinguishable VPC bands for the adult study, so Figure 4 cannot separate them.
- Additive residual error. Table 2 prints ‘Additive error 0.1 fixed’ and Results 3.1 calls it the ‘additive error variance fixed at 0.1 ng/mL’. The model follows the text and uses SD = sqrt(0.1) = 0.316 ng/mL. With concentrations of 1-150 ng/mL the choice has a negligible effect.
- Proportional residual error. The Table 2 value 10.3 is read as a CV% (SD 0.103).
- Formulation and population. Adults received tablets and children dry syrup; the Discussion notes that formulation and population were aliased in their effect on KA, and the final model carries a single KA. The model therefore has no formulation covariate.
- Pediatric regimen. The children’s dosing (‘at least four days’) is simulated as five days of 3 mg every 12 h, with observations over the final interval.
- PBPK model. The paper’s PK-Sim PBPK model is not included; its organ volumes, blood flows and partition coefficients are PK-Sim database outputs that the paper does not tabulate.
- No correction notice for the article was found on Europe PMC as of 2026-10-29.