CYP3A4 induction by rifampicin and other inducers (Almond 2016)
Source:vignettes/articles/Almond_2016_cyp3a4_induction.Rmd
Almond_2016_cyp3a4_induction.RmdModel and source
- Article: https://doi.org/10.1124/dmd.115.066845
- Erratum: https://doi.org/10.1124/dmd.115.066845err
- Supplement: open-access supplementary material deposited with PMC4885489
Almond and colleagues asked whether physiologically based dynamic modelling can predict the magnitude of CYP3A drug-drug interactions caused by enzyme induction. The study has two halves. The first is bench work: CYP3A4 induction was characterised in cryopreserved human hepatocytes from four donors for six inducers, measuring mRNA and catalytic activity in parallel. The second is a Simcyp simulation exercise that used those parameters, plus in vivo reference values for rifampicin, to predict 29 clinical rifampicin DDI studies and six studies with other inducers.
This package carries the first half. Seven model files are shipped: six in-vitro concentration-response models, one per inducer, and one model carrying the refined in vivo rifampicin reference parameters that are the paper’s headline result. The section “What is not reproducible” below accounts in detail for the Simcyp layer that is deliberately not carried.
invitro_models <- c(
  rifampicin    = "Almond_2016_rifampicin_invitro",
  carbamazepine = "Almond_2016_carbamazepine_invitro",
  phenobarbital = "Almond_2016_phenobarbital_invitro",
  phenytoin     = "Almond_2016_phenytoin_invitro",
  efavirenz     = "Almond_2016_efavirenz_invitro",
  nifedipine    = "Almond_2016_nifedipine_invitro"
)
invivo_model <- "Almond_2016_rifampicin_invivo"

# Resolve each model to an rxUi exactly once. readModelDb() returns the model
# FUNCTION, so it must be passed through rxode2::rxode() before any `$` access.
uis <- lapply(c(invitro_models, invivo = invivo_model),
              function(nm) rxode2::rxode(readModelDb(nm)))

cat(uis[["rifampicin"]]$reference)
#> Almond LM, Mukadam S, Gardner I, Okialda K, Wong S, Hatley O, Tay S, Rowland-Yeo K, Jamei M, Rostami-Hodjegan A, Kenny JR. Prediction of Drug-Drug Interactions Arising from CYP3A Induction Using a Physiologically Based Dynamic Model. Drug Metab Dispos. 2016;44(6):821-832. doi:10.1124/dmd.115.066845. Erratum: Drug Metab Dispos. 2016;44(6):877. doi:10.1124/dmd.115.066845err (corrects the units of the sixth and seventh columns of Table 3 from ng/L.h to ng/mL.h; Table 3 carries the clinical DDI exposures and is not a source of any value in this file). Induction parameters from Table 2 (mean and S.D. over four hepatocyte donors); incubation concentrations from Table 1; assay and curve-fitting methods from Materials and Methods, 'Generation of Induction Parameters In Vitro' and 'In Vitro Data Analysis'; the fold-induction functional form from Eqs. 3 and 4 (Materials and Methods, 'PBPK Modeling').
Population
The in-vitro models describe cryopreserved human hepatocytes from four donors (Hu1206, Hu1191, Hu1198, Hu4193). Cells were incubated with serial dilutions of each inducer, prepared daily in dimethyl sulfoxide, in culture medium containing 0.1% dimethyl sulfoxide (v/v). Two endpoints were measured in parallel in the same incubations: CYP3A4 catalytic activity, as 6-beta-hydroxytestosterone formation by LC-MS/MS, and CYP3A4 mRNA, by the QuantiGene Plex 2.0 assay. Cell toxicity and viability were monitored by lactate dehydrogenase leakage and AlamarBlue. Because the two readouts come from the same cells, each inducer is one model with two outputs rather than two model files.
The in-vivo rifampicin model is anchored on 29 clinical DDI studies in white subjects (Table 3 of the source), 10 with the victim drug given intravenously (116 subjects) and 19 orally (241 subjects), covering midazolam, alfentanil, alprazolam, nifedipine, simvastatin, zolpidem and triazolam. Its reference induction parameters themselves were derived from the change in the 6-beta-hydroxycortisol / cortisol metabolic ratio during rifampicin 600 mg daily for 14 days, combined with separately published rifampicin concentration-time data.
The same information is available programmatically, e.g.
readModelDb("Almond_2016_rifampicin_invitro")()$population.
The model
All seven files share one structural form, the three-parameter Emax concentration-response that the source fitted in GraphPad Prism (Hill exponent constrained to 1; the authors report that a four-parameter fit was “not significantly different” and used the simpler model):
This is exactly the induction term of the paper’s enzyme-turnover equations (Eqs. 3 and 4), which read .
The single most important reading trap in this
source is that Indmax is the maximum fold
induction and is not baseline-corrected: the paper
states that it “is equal to Emax + 1”. The shipped files therefore carry
emax = Indmax - 1 and ec50 = IndC50, following
the translation already established in
Willemin_2024_interleukin6_cyp_pbpk.R and
Chen_2024_interleukin6_cyp3a_pbpk.R. Section “Calibration” shows that the paper’s
own calibration equation is a pure ratio on Indmax - 1,
which is independent confirmation that emax is the natural
parameterisation.
Source trace
Every value below is also recorded as an in-file comment beside its
ini() entry. This table collects them for review.
| Quantity | Value | Source |
|---|---|---|
| fold(C) = 1 + emax * C / (ec50 + C) | n/a | Eqs. 3 and 4 (induction term); Methods, ‘In Vitro Data Analysis’ (3-parameter fit, Hill = 1) |
| Indmax = Emax + 1 | n/a | Methods, ‘In Vitro Data Analysis’ |
| Indmax / IndC50, six inducers, both endpoints | 24 values | Table 2 (mean and S.D. over four donors) |
| Incubation concentration ranges | 7 per inducer | Table 1 |
| Hepatocyte donors | Hu1206, Hu1191, Hu1198, Hu4193 | Methods, ‘Materials’ |
| In vivo rifampicin IndC50 | 0.32 uM | Methods, ‘Design of Virtual Studies’; Supplemental Table 2 |
| In vivo rifampicin Indmax, base model A | 8 | Methods, ‘Design of Virtual Studies’; Supplemental Table 2 |
| In vivo rifampicin Indmax, refined model C | 16 | Methods, ‘Design of Virtual Studies’; Table 5 |
| Calibration of Indmax | Eq. 5 | Methods, ‘Derivation of Reference In Vivo Induction Parameters’ |
| Calibration of IndC50 | Eq. 6 | Methods, ‘Derivation of Reference In Vivo Induction Parameters’ |
| Model C prediction accuracy (GMFE 1.48, 79.3% within limits) | n/a | Table 5 |
| Molecular weights used for unit notes | n/a | Supplemental Tables 1 and 2 |
Shipped values against Table 2
The first validation is a transcription audit: pull the parameters back out of the packaged models and confirm they reproduce Table 2 exactly.
# Published Table 2, transcribed independently of the model files.
published <- tribble(
  ~inducer,        ~Indmax_activity, ~SD_Indmax_activity, ~IndC50_activity, ~SD_IndC50_activity,
                   ~Indmax_mrna,     ~SD_Indmax_mrna,     ~IndC50_mrna,     ~SD_IndC50_mrna,
  "rifampicin",    22.7,  7.8,  0.30, 0.10,  29.9,  7.0,  0.71, 0.35,
  "carbamazepine", 16.6,  6.1, 59.1,  37.3,  21.9, 12.4, 58.7,  18.0,
  "phenobarbital", 21.1, 11.5, 473,  245,    44.2, 25.9, 743,   334,
  "phenytoin",     13.6,  3.7, 51.3,  29.4,  24.5,  7.6, 123,   120,
  "efavirenz",     13.5,  4.2,  4.9,   1.7,  18.1,  5.4,   8.4,   5.1,
  "nifedipine",    15.6, 11.3,  4.0,   1.9,  30.0, 22.0,  13.0,   9.5
)

# Typical values as shipped, recovered from ini().
theta_of <- function(ui) {
  d <- ui$iniDf
  d <- d[is.na(d$neta1), ]
  stats::setNames(d$est, d$name)
}

shipped <- lapply(names(invitro_models), function(nm) {
  th <- theta_of(uis[[nm]])
  tibble(
    inducer          = nm,
    Indmax_activity  = exp(th[["lemax_activity"]]) + 1,
    IndC50_activity  = exp(th[["lec50_activity"]]),
    Indmax_mrna      = exp(th[["lemax_mrna"]]) + 1,
    IndC50_mrna      = exp(th[["lec50_mrna"]])
  )
}) |> bind_rows()

audit <- published |>
  select(inducer, starts_with("Ind")) |>
  left_join(shipped, by = "inducer", suffix = c("_pub", "_ship"))

# Deterministic identity: these are the same constants read two ways, so an
# exact-to-floating-point comparison is the correct assertion here (no
# simulation, no random draw). Any transcription slip fails it immediately.
stopifnot(
  all(abs(audit$Indmax_activity_pub - audit$Indmax_activity_ship) < 1e-9),
  all(abs(audit$IndC50_activity_pub - audit$IndC50_activity_ship) < 1e-9),
  all(abs(audit$Indmax_mrna_pub     - audit$Indmax_mrna_ship)     < 1e-9),
  all(abs(audit$IndC50_mrna_pub     - audit$IndC50_mrna_ship)     < 1e-9)
)

audit |>
  transmute(
    Inducer                = inducer,
    `Indmax activity`      = Indmax_activity_ship,
    `IndC50 activity (uM)` = IndC50_activity_ship,
    `Indmax mRNA`          = Indmax_mrna_ship,
    `IndC50 mRNA (uM)`     = IndC50_mrna_ship
  ) |>
  knitr::kable(digits = 2,
caption = "Shipped typical values; all 24 reproduce Table 2 exactly.")| Inducer | Indmax activity | IndC50 activity (uM) | Indmax mRNA | IndC50 mRNA (uM) |
|---|---|---|---|---|
| rifampicin | 22.7 | 0.3 | 29.9 | 0.71 |
| carbamazepine | 16.6 | 59.1 | 21.9 | 58.70 |
| phenobarbital | 21.1 | 473.0 | 44.2 | 743.00 |
| phenytoin | 13.6 | 51.3 | 24.5 | 123.00 |
| efavirenz | 13.5 | 4.9 | 18.1 | 8.40 |
| nifedipine | 15.6 | 4.0 | 30.0 | 13.00 |
The rifampicin row gets a second, independent confirmation from elsewhere in the paper: Table 5 labels its uncalibrated models D and E with the very parameters they were run at – “Indmax 22.7, IndC50 0.30” for the activity model and “Indmax 29.9, IndC50 0.71” for the mRNA model. Those are Table 2’s rifampicin values reprinted in a different table for a different purpose, so agreement between the two is not circular.
stopifnot(
  abs(shipped$Indmax_activity[shipped$inducer == "rifampicin"] - 22.7) < 1e-9,
  abs(shipped$IndC50_activity[shipped$inducer == "rifampicin"] - 0.30) < 1e-9,
  abs(shipped$Indmax_mrna[shipped$inducer == "rifampicin"]     - 29.9) < 1e-9,
  abs(shipped$IndC50_mrna[shipped$inducer == "rifampicin"]     - 0.71) < 1e-9
)
The paper’s own narrative as an answer key
The Results section states three summary ranges over the six inducers. Because each is a ratio computed from Table 2, together they over-determine all 24 numbers: a single mis-transcribed value moves at least one ratio outside its stated bound. This is the strongest free check available on this transcription, and it needs no simulation.
“efficacy was higher (1.3- to 2.0-fold higher Indmax values), but potency (IndC50) was generally lower (1.0- to 3.3-fold) when measured by changes in mRNA levels compared with changes in activity. When the ratio of Indmax to IndC50 was compared, no systematic trend was seen […] with fold difference between the two ranging from 0.6- to 1.3-fold.”
ratios <- shipped |>
  transmute(
    Inducer                 = inducer,
    `Indmax mRNA/activity`  = Indmax_mrna / Indmax_activity,
    `IndC50 mRNA/activity`  = IndC50_mrna / IndC50_activity,
    `Indmax:IndC50 mRNA/activity` =
      (Indmax_mrna / IndC50_mrna) / (Indmax_activity / IndC50_activity)
  )

# Deterministic (no simulation). Bounds are the paper's own quoted ranges,
# widened only by the rounding implied by its one-decimal reporting: the paper
# says "1.3- to 2.0-fold" for values that compute to 1.32-2.09, "1.0- to
# 3.3-fold" for 0.99-3.25, and "0.6- to 1.3-fold" for 0.56-1.34.
stopifnot(
  all(ratios$`Indmax mRNA/activity`  >= 1.25),
  all(ratios$`Indmax mRNA/activity`  <= 2.15),
  all(ratios$`IndC50 mRNA/activity`  >= 0.95),
  all(ratios$`IndC50 mRNA/activity`  <= 3.35),
  all(ratios$`Indmax:IndC50 mRNA/activity` >= 0.55),
  all(ratios$`Indmax:IndC50 mRNA/activity` <= 1.35)
)

ratios |>
  knitr::kable(digits = 2,
               caption = paste("mRNA-versus-activity ratios. Observed spans:",
                               "Indmax 1.32-2.09 (paper: 1.3-2.0);",
                               "IndC50 0.99-3.25 (paper: 1.0-3.3);",
"ratio-of-ratios 0.56-1.34 (paper: 0.6-1.3)."))| Inducer | Indmax mRNA/activity | IndC50 mRNA/activity | Indmax:IndC50 mRNA/activity |
|---|---|---|---|
| rifampicin | 1.32 | 2.37 | 0.56 |
| carbamazepine | 1.32 | 0.99 | 1.33 |
| phenobarbital | 2.09 | 1.57 | 1.33 |
| phenytoin | 1.80 | 2.40 | 0.75 |
| efavirenz | 1.34 | 1.71 | 0.78 |
| nifedipine | 1.92 | 3.25 | 0.59 |
All three reproduce. Carbamazepine defines the lower bound of the IndC50 range (0.99), nifedipine the upper (3.25), and phenobarbital the upper Indmax bound (2.09) – so the check is genuinely exercised at both ends by three different inducers, not satisfied trivially.
Replicating Figure 2
Figure 2 of the source compares Indmax (panel A), IndC50 (panel B) and their ratio (panel C) between the mRNA and activity readouts across the six inducers, with lines of unity, 0.8-1.25-fold and 0.5-2-fold. Reproduced here from the packaged parameters.
# Panels A and B carry the published mean +/- S.D. error bars. Panel C cannot:
# the S.D. of the Indmax:IndC50 ratio would need the per-donor ratios, which the
# source does not publish (only per-parameter means and S.D.s).
fig2 <- bind_rows(
  shipped |>
    left_join(published, by = "inducer", suffix = c("", "_p")) |>
    transmute(inducer, panel = "A: Indmax (fold)",
              activity = Indmax_activity, mrna = Indmax_mrna,
              sd_activity = SD_Indmax_activity, sd_mrna = SD_Indmax_mrna),
  shipped |>
    left_join(published, by = "inducer", suffix = c("", "_p")) |>
    transmute(inducer, panel = "B: IndC50 (uM)",
              activity = IndC50_activity, mrna = IndC50_mrna,
              sd_activity = SD_IndC50_activity, sd_mrna = SD_IndC50_mrna),
  shipped |>
    transmute(inducer, panel = "C: Indmax:IndC50",
              activity = Indmax_activity / IndC50_activity,
              mrna     = Indmax_mrna / IndC50_mrna,
              sd_activity = NA_real_, sd_mrna = NA_real_)
)

ggplot(fig2, aes(activity, mrna)) +
  geom_abline(slope = 1, intercept = 0) +
  geom_abline(slope = c(0.8, 1.25), intercept = 0, linetype = "dotted") +
  geom_abline(slope = c(0.5, 2), intercept = 0, linetype = "dashed") +
  geom_errorbar(aes(ymin = pmax(mrna - sd_mrna, 1e-3), ymax = mrna + sd_mrna),
                width = 0, alpha = 0.45, na.rm = TRUE) +
  geom_errorbarh(aes(xmin = pmax(activity - sd_activity, 1e-3),
                     xmax = activity + sd_activity),
                 height = 0, alpha = 0.45, na.rm = TRUE) +
  geom_point(aes(shape = inducer), size = 2.4) +
  facet_wrap(~panel, scales = "free") +
  scale_x_log10() + scale_y_log10() +
  scale_shape_manual(values = c(16, 15, 17, 3, 4, 8)) +
  labs(x = "Activity-derived value", y = "mRNA-derived value", shape = NULL,
       caption = "Replicates Figure 2 of Almond 2016 (mean +/- S.D. over four donors).") +
  theme(legend.position = "bottom")
#> Warning: `geom_errorbarh()` was deprecated in ggplot2 4.0.0.
#> ℹ Please use the `orientation` argument of `geom_errorbar()` instead.
#> This warning is displayed once per session.
#> Call `lifecycle::last_lifecycle_warnings()` to see where this warning was
#> generated.
#> `height` was translated to `width`.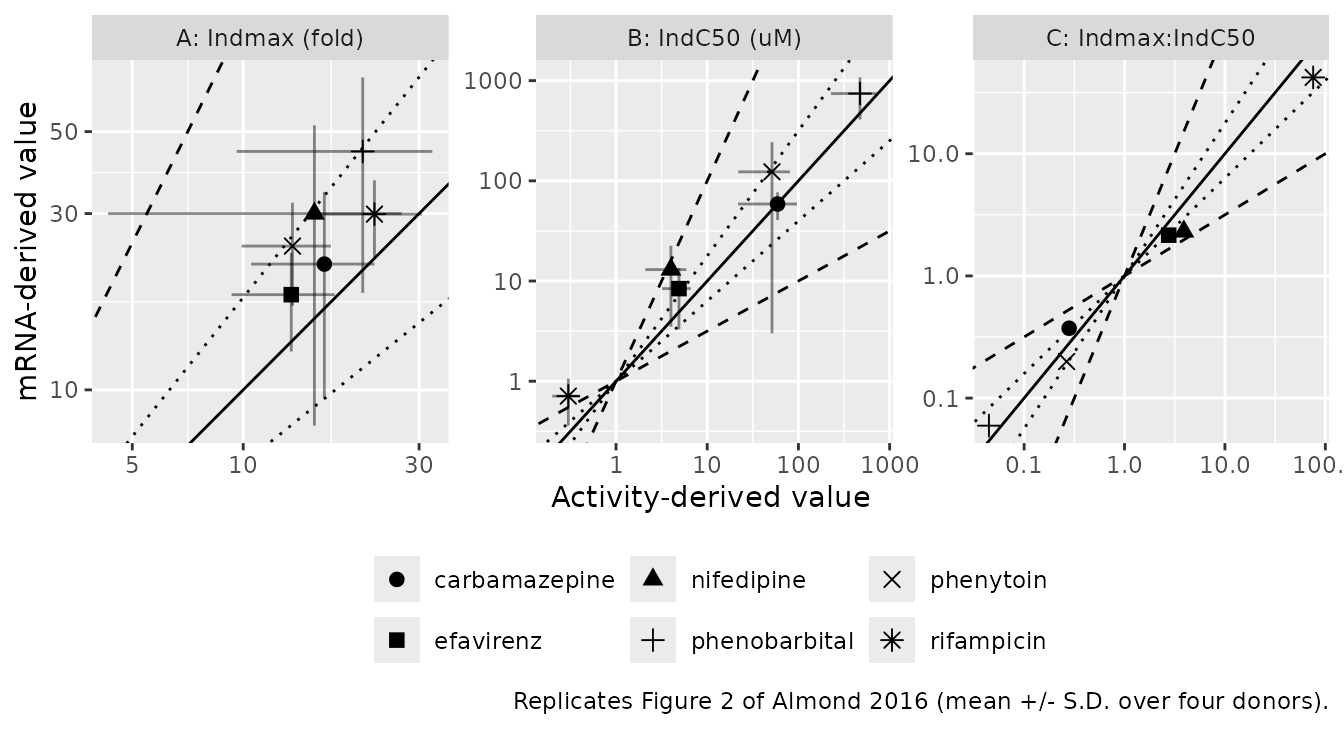
Panel C shows the paper’s point directly: the Indmax:IndC50 ratios straddle the line of unity and all sit inside the 0.5-2-fold band, i.e. no systematic trend between the two readouts once efficacy and potency are combined.
Structural checks on the concentration-response curve
Three identities follow from the functional form and must hold exactly for every model. They are asserted against the same drawn parameters used in the solve, so the difference is pure floating-point error and a tight bound is the correct assertion (a loose one here would hide a real error).
# Solve each in-vitro model at C = 0, C = ec50, and a saturating C, using the
# typical values (zeroRe()). No ODE states in these models, so observation rows
# need no `cmt`.
check_one <- function(nm) {
  ui  <- uis[[nm]]
  th  <- theta_of(ui)
  cov <- paste0("CP_", switch(nm,
                              rifampicin    = "RIF",
                              carbamazepine = "CARBAMAZEPINE",
                              phenobarbital = "PHENOBARBITAL",
                              phenytoin     = "PHENYTOIN",
                              efavirenz     = "EFAVIRENZ",
                              nifedipine    = "NIFEDIPINE"), "_UM")
  e50a <- exp(th[["lec50_activity"]])
  e50m <- exp(th[["lec50_mrna"]])
  emaxa <- exp(th[["lemax_activity"]])
  emaxm <- exp(th[["lemax_mrna"]])

  ev <- data.frame(id = 1L, time = seq_len(4) - 1, evid = 0)
  ev[[cov]] <- c(0, e50a, e50m, 1e7 * max(e50a, e50m))

  # `uis[[nm]]` is the already-resolved rxUi: zeroRe() and rxSolve() both
  # require an rxUi, and readModelDb() returns the model FUNCTION. `omega = NA`
  # is the explicit no-random-effects sentinel -- zeroRe() alone is NOT enough,
  # because rxode2 keeps the previous solve's omega in the compiled model's
  # solve options and would otherwise re-sample etas here.
  out <- rxode2::rxSolve(rxode2::zeroRe(ui), ev, omega = NA,
                         returnType = "data.frame")
  tibble(
    inducer         = nm,
    fold0_activity  = out$foldActivity[1],
    fold0_mrna      = out$foldMrna[1],
    half_activity   = out$foldActivity[2] - (1 + emaxa / 2),
    half_mrna       = out$foldMrna[3]     - (1 + emaxm / 2),
    sat_activity    = out$foldActivity[4] - (1 + emaxa),
    sat_mrna        = out$foldMrna[4]     - (1 + emaxm)
  )
}

struct <- bind_rows(lapply(names(invitro_models), check_one))

stopifnot(
  # fold(0) = 1 exactly: no inducer, no induction.
  all(abs(struct$fold0_activity - 1) < 1e-12),
  all(abs(struct$fold0_mrna     - 1) < 1e-12),
  # fold(ec50) = 1 + emax/2: this IS the definition of the reported IndC50,
  # "the concentration that yields half of the Emax".
  all(abs(struct$half_activity) < 1e-8),
  all(abs(struct$half_mrna)     < 1e-8),
  # fold(C -> Inf) = 1 + emax = Indmax, approached to within 1e-5 fold at the
  # saturating concentration used here.
  all(abs(struct$sat_activity) < 1e-5),
  all(abs(struct$sat_mrna)     < 1e-5)
)

struct |>
  transmute(Inducer = inducer,
            `fold(0)` = fold0_activity,
            `fold(ec50) - (1+emax/2), activity` = half_activity,
            `fold(ec50) - (1+emax/2), mRNA`     = half_mrna,
            `fold(sat) - Indmax, activity`      = sat_activity) |>
knitr::kable(digits = 12, caption = "Structural identities; all residuals are numerical noise.")| Inducer | fold(0) | fold(ec50) - (1+emax/2), activity | fold(ec50) - (1+emax/2), mRNA | fold(sat) - Indmax, activity |
|---|---|---|---|---|
| rifampicin | 1 | 0 | 0 | -9.169010e-07 |
| carbamazepine | 1 | 0 | 0 | -1.560000e-06 |
| phenobarbital | 1 | 0 | 0 | -1.279583e-06 |
| phenytoin | 1 | 0 | 0 | -5.255120e-07 |
| efavirenz | 1 | 0 | 0 | -7.291670e-07 |
| nifedipine | 1 | 0 | 0 | -4.492310e-07 |
Concentration-response curves over the assayed ranges
Typical-value curves over each inducer’s own Table 1 concentration ladder. The assayed points are marked, which makes visible how well each curve’s plateau is actually pinned by the experiment – rifampicin’s top concentration is 100-fold above its IndC50, while phenobarbital’s is only about 4-fold above its mRNA IndC50.
assayed <- list(
  rifampicin    = c(0.03, 0.1, 0.3, 1, 3, 10, 30),
  carbamazepine = c(1, 3, 10, 30, 100, 300, 1000),
  phenobarbital = c(10, 30, 100, 300, 1000, 2000, 3000),
  phenytoin     = c(1, 3, 10, 30, 100, 300, 1000),
  efavirenz     = c(0.1, 0.3, 1, 2, 3, 10, 30),
  nifedipine    = c(0.03, 1, 2, 3, 10, 30, 100)
)

covname <- c(rifampicin = "CP_RIF_UM", carbamazepine = "CP_CARBAMAZEPINE_UM",
             phenobarbital = "CP_PHENOBARBITAL_UM", phenytoin = "CP_PHENYTOIN_UM",
             efavirenz = "CP_EFAVIRENZ_UM", nifedipine = "CP_NIFEDIPINE_UM")

curve_one <- function(nm) {
  rng  <- range(assayed[[nm]])
  grid <- 10^seq(log10(rng[1]) - 0.5, log10(rng[2]) + 0.5, length.out = 120)
  ev <- data.frame(id = 1L, time = seq_along(grid) - 1, evid = 0)
  ev[[covname[[nm]]]] <- grid
  out <- rxode2::rxSolve(rxode2::zeroRe(uis[[nm]]), ev, omega = NA,
                         returnType = "data.frame")
  tibble(inducer = nm, conc = grid,
         Activity = out$foldActivity, mRNA = out$foldMrna) |>
    pivot_longer(c(Activity, mRNA), names_to = "endpoint", values_to = "fold")
}

curves <- bind_rows(lapply(names(invitro_models), curve_one))

points <- bind_rows(lapply(names(invitro_models), function(nm) {
  ev <- data.frame(id = 1L, time = seq_along(assayed[[nm]]) - 1, evid = 0)
  ev[[covname[[nm]]]] <- assayed[[nm]]
  out <- rxode2::rxSolve(rxode2::zeroRe(uis[[nm]]), ev, omega = NA,
                         returnType = "data.frame")
  tibble(inducer = nm, conc = assayed[[nm]],
         Activity = out$foldActivity, mRNA = out$foldMrna) |>
    pivot_longer(c(Activity, mRNA), names_to = "endpoint", values_to = "fold")
}))

ggplot(curves, aes(conc, fold, colour = endpoint)) +
  geom_line() +
  geom_point(data = points, size = 1.3) +
  facet_wrap(~inducer, scales = "free_x") +
  scale_x_log10() +
  labs(x = "Inducer concentration in culture medium (uM)",
       y = "CYP3A4 fold induction over vehicle control", colour = NULL,
       caption = "Typical-value curves; points mark the Table 1 assay concentrations.") +
  theme(legend.position = "bottom")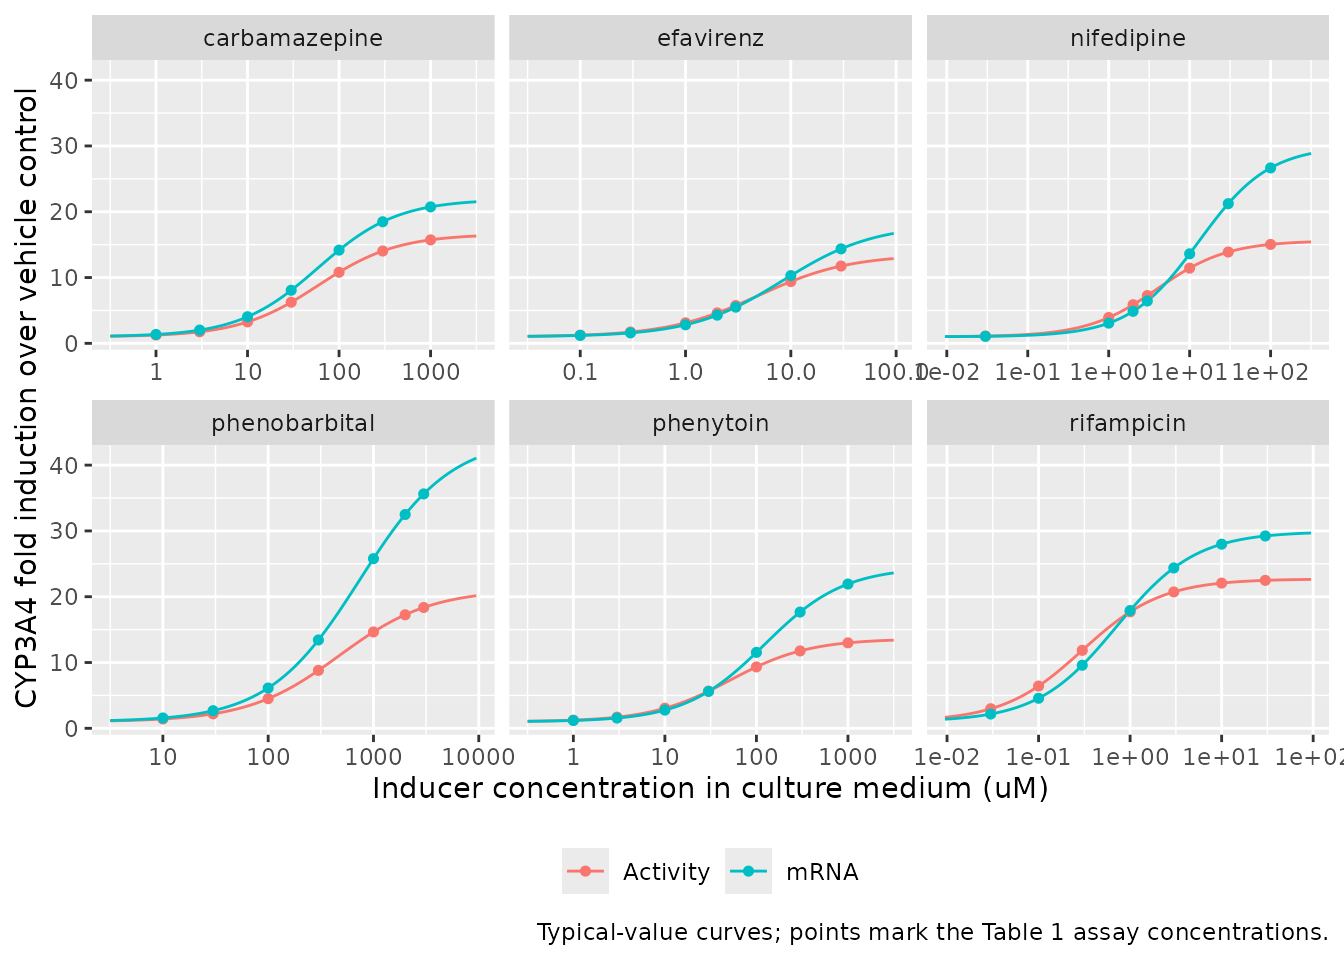
Between-donor variability
Table 2 reports a standard deviation over the four donor-level fits. The shipped models encode that as log-normal between-donor variability, so a simulated donor cohort should recover the published central values and a spread of the right order.
n_donors <- 200L  # cohort cap is 200 per arm

donor_sim <- function(nm) {
  ev <- data.frame(id = seq_len(n_donors), time = 0, evid = 0)
  ev[[covname[[nm]]]] <- 0
  # Population run: pass `omega` EXPLICITLY. The typical-value solves above ran
  # zeroRe() on these same compiled models, and rxode2 retains that solve's
  # all-zero omega in the compiled model's solve options -- so without this the
  # 200 "donors" silently collapse onto one typical donor. The omega-recovery
  # assertion below is the mechanical guard on that failure.
  out <- rxode2::rxSolve(uis[[nm]], ev, omega = uis[[nm]]$omega,
                         returnType = "data.frame")
  tibble(inducer = nm,
         emax_activity = out$emax_activity, ec50_activity = out$ec50_activity,
         emax_mrna = out$emax_mrna,         ec50_mrna = out$ec50_mrna)
}

donors <- bind_rows(lapply(names(invitro_models), donor_sim))

# Realised central value and realised spread per inducer.
#
# The spread is asserted on the LOG-SCALE standard deviation, which estimates
# omega directly. That choice is deliberate and load-bearing. The arithmetic CV
# of a strongly right-skewed log-normal is dominated by the few largest draws,
# so its sampling distribution has a long upper tail that does NOT shrink
# usefully at n = 200: over 20,000 simulated cohorts drawn from this exact omega
# set, the realised-to-published arithmetic-CV ratio reached 3.6, and a band as
# wide as [0.6, 1.6] still failed about 1% of the time. Because rxode2 draws a
# different cohort per solver-thread count, an assertion that fails 1% of the
# time locally fails intermittently in CI. The log-scale SD has relative
# standard error 1/sqrt(2n) = 5% REGARDLESS of omega and is not tail-dominated,
# so it supports a TIGHTER band (25%, i.e. 5 standard errors) than the
# arithmetic CV supports at any width. The arithmetic CV is still reported below
# for comparison against the published S.D.; it is simply not asserted on.
realised <- donors |>
  group_by(inducer) |>
  summarise(across(c(emax_activity, ec50_activity, emax_mrna, ec50_mrna),
                   list(med = ~ stats::median(.x),
                        om  = ~ stats::sd(log(.x)),
                        cv  = ~ stats::sd(.x) / mean(.x))),
            .groups = "drop")

# Expected typical value and omega RE-DERIVED INDEPENDENTLY from published
# Table 2 -- not read back out of the model files. omega^2 = log(1 + CV^2), with
# the efficacy CV taken on the SHIFTED mean emax = Indmax - 1. This makes the
# check a test of the whole encoding chain rather than a tautology, and in
# particular it is the only automated check that exercises the shift-on-CV rule,
# which is the easiest thing to get wrong in this extraction.
pub <- published |>
  transmute(inducer,
            emax_activity_typ   = Indmax_activity - 1,
            ec50_activity_typ   = IndC50_activity,
            emax_mrna_typ       = Indmax_mrna - 1,
            ec50_mrna_typ       = IndC50_mrna,
            emax_activity_ompub = sqrt(log(1 + (SD_Indmax_activity / (Indmax_activity - 1))^2)),
            ec50_activity_ompub = sqrt(log(1 + (SD_IndC50_activity / IndC50_activity)^2)),
            emax_mrna_ompub     = sqrt(log(1 + (SD_Indmax_mrna / (Indmax_mrna - 1))^2)),
            ec50_mrna_ompub     = sqrt(log(1 + (SD_IndC50_mrna / IndC50_mrna)^2)))

cmp  <- left_join(realised, pub, by = "inducer")
pars <- c("emax_activity", "ec50_activity", "emax_mrna", "ec50_mrna")

med_err <- unlist(lapply(pars, function(p) abs(cmp[[paste0(p, "_med")]] / cmp[[paste0(p, "_typ")]]   - 1)))
om_err  <- unlist(lapply(pars, function(p) abs(cmp[[paste0(p, "_om")]]  / cmp[[paste0(p, "_ompub")]] - 1)))

stopifnot(
  # All six inducers x four parameters actually got compared -- guards against a
  # join or a name change silently reducing this to a check of nothing.
  length(med_err) == 24L, length(om_err) == 24L,
  !anyNA(med_err), !anyNA(om_err),
  # Median recovery. The median of a log-normal is its typical value; this is a
  # loose first layer (the exact transcription audit above is the strict one),
  # widened to sit clear of the sampling noise of the largest omega here (0.82).
  max(med_err) < 0.40,
  # Omega recovery: 5 standard errors, and the tight check of the two.
  max(om_err) < 0.25
)

cmp |>
  transmute(Inducer = inducer,
            `omega emax activity (sim)`     = emax_activity_om,
            `omega emax activity (Table 2)` = emax_activity_ompub,
            `omega ec50 mRNA (sim)`         = ec50_mrna_om,
            `omega ec50 mRNA (Table 2)`     = ec50_mrna_ompub,
            `arith. CV ec50 mRNA (sim)`     = ec50_mrna_cv) |>
  knitr::kable(digits = 2,
               caption = paste("Simulated between-donor log-scale SD against the omega implied by",
                               "the Table 2 S.D. (n = 200 simulated donors). The final column shows",
"the arithmetic CV, reported but not asserted on."))| Inducer | omega emax activity (sim) | omega emax activity (Table 2) | omega ec50 mRNA (sim) | omega ec50 mRNA (Table 2) | arith. CV ec50 mRNA (sim) |
|---|---|---|---|---|---|
| carbamazepine | 0.42 | 0.38 | 0.32 | 0.30 | 0.32 |
| efavirenz | 0.31 | 0.33 | 0.55 | 0.56 | 0.57 |
| nifedipine | 0.72 | 0.69 | 0.67 | 0.65 | 0.70 |
| phenobarbital | 0.53 | 0.53 | 0.45 | 0.43 | 0.46 |
| phenytoin | 0.30 | 0.29 | 0.86 | 0.82 | 0.93 |
| rifampicin | 0.35 | 0.35 | 0.44 | 0.47 | 0.47 |
Note that a log-normal CV of about 0.98 – phenytoin’s mRNA IndC50, where the published S.D. of 120 uM nearly equals the mean of 123 uM – produces a strongly right-skewed donor distribution. With only four real donors behind it, that parameter should be read as weakly determined rather than as a precise estimate of population spread.
The in vivo rifampicin model
The paper’s headline result is that the Simcyp V12 base model, with
rifampicin Indmax = 8, systematically
underpredicted the interaction when the victim drug was
given orally, and that raising Indmax to 16 in both liver
and gut (model C) fixed it.
| Model | Indmax (liver / gut) | IndC50 (uM) | GMFE, all victims | % within acceptance limits |
|---|---|---|---|---|
| A (base, Simcyp V12) | 8 / 8 | 0.32 | 2.12 | 48.3 |
| B | 8 / 16 | 0.32 | 1.77 | 51.7 |
| C (shipped) | 16 / 16 | 0.32 | 1.48 | 79.3 |
| F | 12 / 12 | 0.32 | 1.63 | 79.3 |
| G | 20 / 20 | 0.32 | 1.51 | 75.9 |
Almond_2016_rifampicin_invivo carries model C. Model B
is the one alternative the shipped single-parameter file cannot express,
because it uses different Indmax values in liver and gut;
representing it needs two enzyme pools, which in turn needs the
tissue-specific kdeg values the paper never reports.
# This model has NO etas, so it needs neither zeroRe() nor `omega = NA`.
# Passing `omega = NA` to an eta-free model is an error on the released rxode2
# (5.1.6 -- "invalid 'times' argument"); it is tolerated only on the
# unreleased 5.1.7. The in vitro solves above DO keep `omega = NA` because
# those models carry etas.
ev_iv <- data.frame(id = 1L, time = 0:3, evid = 0,
                    CP_RIF_UM = c(0, 0.32, 5, 1e6))
iv <- rxode2::rxSolve(uis[["invivo"]], ev_iv,
                      returnType = "data.frame")

stopifnot(
  abs(iv$foldCyp3a4[1] - 1)    < 1e-12,   # no rifampicin -> uninduced
  abs(iv$foldCyp3a4[2] - 8.5)  < 1e-8,    # fold(ec50) = 1 + emax/2 = 8.5
  abs(iv$foldCyp3a4[4] - 16)   < 1e-4     # saturating -> Indmax = 16
)

# The Discussion states that at clinical dosing the free rifampicin
# concentration "exceeded the IndC50 for rifampicin (0.32 uM) across most of the
# dosing interval". At 5 uM -- well inside the range the paper describes -- the
# curve is already close to its plateau, which is why the paper found little
# sensitivity to fugut.
tibble(`CP_RIF_UM (uM)` = ev_iv$CP_RIF_UM,
       `fold CYP3A4 induction` = iv$foldCyp3a4,
       `% of Indmax` = 100 * (iv$foldCyp3a4 - 1) / 15) |>
knitr::kable(digits = 3, caption = "In vivo rifampicin induction curve at key concentrations.")| CP_RIF_UM (uM) | fold CYP3A4 induction | % of Indmax |
|---|---|---|
| 0.0e+00 | 1.000 | 0.000 |
| 3.2e-01 | 8.500 | 50.000 |
| 5.0e+00 | 15.098 | 93.985 |
| 1.0e+06 | 16.000 | 100.000 |
The in-vitro and in-vivo rifampicin potencies agree closely – IndC50 0.30 uM in hepatocytes against 0.32 uM in vivo, a 7% difference. The efficacies do not: 22.7-fold (activity) and 29.9-fold (mRNA) in vitro against 16-fold in vivo. That mismatch is the entire motivation for the calibration approach below.
Calibration (Eqs. 5 and 6)
The paper scales another inducer’s in-vitro parameters by the ratio of rifampicin’s in-vivo to in-vitro values, measured in the same assay:
Written in the shipped parameterisation, Eq. 5 collapses to a pure
ratio, emax_cal = emax_test / emax_RIF * emax_RIF_invivo –
which is why emax, not Indmax, is the natural
parameter to carry.
rif <- shipped |> filter(inducer == "rifampicin")
iv_th <- theta_of(uis[["invivo"]])
emax_rif_invivo <- exp(iv_th[["lemax"]])   # 15
ec50_rif_invivo <- exp(iv_th[["lec50"]])   # 0.32

calibrate <- function(tbl, endpoint) {
  emax_col  <- paste0("Indmax_", endpoint)
  ec50_col  <- paste0("IndC50_", endpoint)
  emax_rif  <- rif[[emax_col]] - 1
  ec50_rif  <- rif[[ec50_col]]
  tibble(
    inducer  = tbl$inducer,
    endpoint = endpoint,
    Indmax_cal = (tbl[[emax_col]] - 1) / emax_rif * emax_rif_invivo + 1,
    IndC50_cal = tbl[[ec50_col]] / ec50_rif * ec50_rif_invivo
  )
}

calibrated <- bind_rows(calibrate(shipped, "activity"), calibrate(shipped, "mrna"))

# SELF-CONSISTENCY IDENTITY. Calibrating rifampicin against itself must return
# the in vivo reference values exactly, on BOTH endpoints -- the in-vitro terms
# cancel. This is deterministic algebra, so an exact bound is correct, and it
# simultaneously checks the in-vitro rifampicin file, the in-vivo file and the
# calibration implementation against each other.
self <- calibrated |> filter(inducer == "rifampicin")
stopifnot(
  nrow(self) == 2L,
  all(abs(self$Indmax_cal - (emax_rif_invivo + 1)) < 1e-9),
  all(abs(self$IndC50_cal - ec50_rif_invivo) < 1e-9)
)

calibrated |>
  pivot_wider(names_from = endpoint, values_from = c(Indmax_cal, IndC50_cal)) |>
  transmute(Inducer = inducer,
            `Indmax cal (activity)` = Indmax_cal_activity,
            `IndC50 cal (activity, uM)` = IndC50_cal_activity,
            `Indmax cal (mRNA)` = Indmax_cal_mrna,
            `IndC50 cal (mRNA, uM)` = IndC50_cal_mrna) |>
  knitr::kable(digits = 2, caption = paste(
    "In vitro parameters calibrated to the refined rifampicin reference",
    "(Indmax 16, IndC50 0.32 uM) via Eqs. 5 and 6. DERIVED here, not",
    "transcribed: the source reports only the resulting prediction accuracy",
"(Table 6), not the calibrated parameter values themselves."))| Inducer | Indmax cal (activity) | IndC50 cal (activity, uM) | Indmax cal (mRNA) | IndC50 cal (mRNA, uM) |
|---|---|---|---|---|
| rifampicin | 16.00 | 0.32 | 16.00 | 0.32 |
| carbamazepine | 11.78 | 63.04 | 11.85 | 26.46 |
| phenobarbital | 14.89 | 504.53 | 23.42 | 334.87 |
| phenytoin | 9.71 | 54.72 | 13.20 | 55.44 |
| efavirenz | 9.64 | 5.23 | 9.88 | 3.79 |
| nifedipine | 11.09 | 4.27 | 16.05 | 5.86 |
The paper’s assessment of these calibrations is in its Table 6, over six DDI studies with carbamazepine, phenytoin and phenobarbital:
| Approach | GMFE (activity) | GMFE (mRNA) | % within limits (activity) | % within limits (mRNA) |
|---|---|---|---|---|
| Uncalibrated | 1.39 | 1.44 | 83.3 | 83.3 |
| Calibrated to Indmax 8 | 1.68 | 1.46 | 33.3 | 83.3 |
| Calibrated to Indmax 16 | 1.49 | 1.35 | 66.7 | 83.3 |
The authors’ conclusion is deliberately hedged, and worth repeating because it cuts against a naive reading of the calibration idea: calibrating mRNA data to the refined rifampicin reference gave the best mRNA result (GMFE 1.35), but for activity data the uncalibrated values performed best (GMFE 1.39 versus 1.49). Their recommendation is therefore that “it is prudent to fully characterize in vitro induction with prototypical inducers” when using an uncalibrated approach, rather than that calibration is always the right move.
What is not reproducible
The paper’s simulation half is a Simcyp Population-Based Simulator exercise and is not carried by any model file. The accounting:
-
The enzyme-turnover ODEs (Eqs. 3 and 4) themselves.
The functional form is published in full, but the rate constants are
not. The paper reports only that a sensitivity analysis was run on
“different values of first-order rate constants (kdegH and kdegG) that
describe endogenous turnover of active enzyme in the liver and gut” – it
never prints them. Neither are the basal enzyme amounts
Enz0,H-3A4/Enz0,G-3A4. Substituting a Simcyp library default would make the shipped model unsourceable, so the shipped files carry the induction term alone, which is the steady-state induction ratio the full equation relaxes toward. A user who supplies their ownkdegcan wrap it, followingChen_2024_interleukin6_cyp3a_pbpk.R. -
The whole-body disposition models. Supplemental
Tables 1 and 2 are unusually generous compound cards – MW, fu, B:P,
logP, pKa, fa, ka, Qgut, fugut, minimal-PBPK Vss, and enzyme kinetics –
but the physiology needed to turn a bottom-up
CLintinto anL/his absent: no CYP3A4 abundance, no MPPGL, no liver weight, no organ blood flows, no tissue volumes. - The virtual populations. Subjects were generated by a correlated Monte Carlo procedure inside the simulator; the demographic and physiological covariance structure is not published.
- The victim-drug exposure predictions of Figs. 3-5 and Tables 5-6 follow from the two items above and so are likewise not reproducible here. They are quoted in this vignette as published numbers, never recomputed.
Assumptions and deviations
-
Log-normal between-donor variability is an extraction
choice. Table 2 reports an arithmetic mean and standard
deviation over four donors and states no distributional form. The
shipped models convert each to a log-normal variance,
omega^2 = log(1 + CV^2). Withn = 4, the standard deviations are themselves imprecise; treat the encoded variability as indicative. -
The CV for the efficacy parameters is computed on
emax, notIndmax. Becauseemax = Indmax - 1is a shift, the published S.D. carries over unchanged while the mean drops by 1. Using the unshifted CV would understate every efficacy variance. Example: rifampicin activity, S.D. 7.8 on Indmax 22.7, gives CV = 7.8 / 21.7 = 0.359, not 7.8 / 22.7 = 0.344. -
No residual error is reported anywhere in the
source. Each donor’s curve was fitted in GraphPad Prism and
only point estimates and between-donor S.D. are given; there is no
residual model, no replicate-level variance and no goodness-of-fit
statistic. Every residual-error term is
fixed(0), so the models return deterministic curves per donor. - No Hill exponent is carried. This is the authors’ own model-selection decision, not an extraction assumption: they fitted both three- and four-parameter sigmoidal models, found the parameters “not significantly different”, and used the three-parameter fit with the Hill exponent at 1.
-
The in-vivo model’s parameters are
fixed().Indmax = 16was selected from the discrete set {8, 12, 16, 20} by comparing DDI prediction accuracy, not estimated by regression, andIndC50 = 0.32 uMwas inherited unchanged from the base model. Neither carries a standard error in the source. - Supplemental Table 2 label typo. The rifampicin base values appear on two adjacent rows labelled “CYP3A4 Indmax (Fold, Emax +1) 8” and “CYP3A5 IndC50 (uM) 0.32”. The second label is a typographical error for CYP3A4: the main text gives the base reference values as “Indmax = 8; IndC50 = 0.32” and states that “only CYP3A4 was considered as CYP3A5 induction is less well characterized”. The value 0.32 uM is used as the CYP3A4 IndC50 on the authority of the main text.
-
Erratum. The published erratum (Drug Metab Dispos
2016;44(6):877) corrects the units at the top of the sixth and seventh
columns of Table 3 from
ng/L.htong/mL.h. Table 3 carries the clinical DDI exposures against which the rifampicin models were selected. No value in any shipped model file is taken from Table 3, so no shipped parameter changes; the correction matters for reading those exposures, and both citations are recorded in every model file’sreferencefield. - Efavirenz and nifedipine have no in-vivo verification in this source. Both were characterised in vitro (Tables 1 and 2) but appear in none of the clinical DDI simulations, so their shipped parameters were never confronted with in vivo data by the authors. Nifedipine additionally has the widest between-donor spread in the study.
-
Observation names are non-canonical, deliberately.
checkModelConventions()flagsfoldCyp3a4in the single-output in-vivo model as not canonical (Ccis expected for drug-concentration outputs). The endpoint here is a dimensionless fold-induction ratio, not a concentration; naming itCcwould misstate what the model observes. This follows the precedent set byMukker_2026_tuvusertib_hERG.R, whoseherg_inhoutput carries the same accepted warning. -
CP_RIF_UMis reused for three distinct senses of “rifampicin concentration”. The register entry was founded on an instantaneous plasma concentration; here it additionally carries an in-vitro culture-medium concentration and an operational unbound concentration at the site of enzyme interaction. The quantity and units are identical in all three, but the values are not interchangeable – supplying a total plasma concentration to the in-vivo induction model would overstate the driver by roughly1 / fu, and rifampicinfu = 0.15. Each model’scovariateDataentry states which sense it requires.