Paracetamol pain relief (Zhao 2025)
Source:vignettes/articles/Zhao_2025b_paracetamol_painrelief.Rmd
Zhao_2025b_paracetamol_painrelief.RmdModel and source
- Citation: Zhao S, Zhang L (2025). Evaluation of the PK/PD Changes on MASLD-Related Population - An Example From Simultaneous Acetaminophen Parent-Metabolite PBPK/PD Modeling. CPT Pharmacometrics Syst Pharmacol 15(1):e70161. doi:10.1002/psp4.70161.
- Description: Direct sigmoid Emax (Hill) pharmacodynamic model relating the plasma concentration of paracetamol (acetaminophen) to the pain relief score (0-10 scale, higher = more relief) in adults with chronic pain (Zhao 2025, the PD layer of a GastroPlus parent-metabolite PBPK/PD model for MASLD-related populations). The PD relationship was benchmarked against the plasma concentration / pain relief data of Shinoda 2007 (Japanese chronic-pain patients given a 1 g oral tablet). Only this PD layer is reproduced here: the paracetamol and five-metabolite PBPK layers are GastroPlus platform models whose tissue partition coefficients (Lukacova method), organ volumes and blood flows, per-tissue enzyme amounts and MASLD-population physiologies are software-database outputs that the paper never prints, so they are not reproducible from the publication (see the vignette ‘Assumptions and deviations’). Paracetamol plasma concentration is therefore supplied by the user as the canonical effect-site covariate CEFFECT rather than generated by a PK model in this file. No inter-individual variability and no residual-error model are reported, so both are absent / fixed at zero.
- Article: https://doi.org/10.1002/psp4.70161 (open access, PMC12823458)
Zhao 2025 builds a GastroPlus whole-body PBPK model of paracetamol (acetaminophen, APAP) together with five metabolites (glucuronide, sulfate, NAPQI, cysteine and mercapturate conjugates) in healthy adults, extrapolates it to overweight, obese, NAFLD, NASH and cirrhotic (Child-Pugh A/B/C) virtual populations using the platform’s built-in disease physiologies, and finally links the predicted plasma paracetamol concentration to a 0-10 pain relief score with a direct sigmoid Emax model.
Only the last component, the pain relief PD layer, is
packaged in nlmixr2lib. The PBPK layers cannot be reproduced
from the publication (see Assumptions and deviations). The
PD layer is fully specified by four printed numbers and is
self-contained once a plasma paracetamol concentration is supplied
through the CEFFECT covariate column.
Note that Zhao_2025_paracetamol in this package is a
different paper (a population PK model in spinal muscular atrophy, Br J
Clin Pharmacol 2025); the 2025b in this model’s name only
separates the two.
mod <- readModelDb("Zhao_2025b_paracetamol_painrelief")
mod
#> function() {
#>   description <- paste(
#>     "Direct sigmoid Emax (Hill) pharmacodynamic model relating the plasma",
#>     "concentration of paracetamol (acetaminophen) to the pain relief score",
#>     "(0-10 scale, higher = more relief) in adults with chronic pain (Zhao 2025,",
#>     "the PD layer of a GastroPlus parent-metabolite PBPK/PD model for",
#>     "MASLD-related populations). The PD relationship was benchmarked against",
#>     "the plasma concentration / pain relief data of Shinoda 2007 (Japanese",
#>     "chronic-pain patients given a 1 g oral tablet). Only this PD layer is",
#>     "reproduced here: the paracetamol and five-metabolite PBPK layers are",
#>     "GastroPlus platform models whose tissue partition coefficients (Lukacova",
#>     "method), organ volumes and blood flows, per-tissue enzyme amounts and",
#>     "MASLD-population physiologies are software-database outputs that the",
#>     "paper never prints, so they are not reproducible from the publication (see",
#>     "the vignette 'Assumptions and deviations'). Paracetamol plasma",
#>     "concentration is therefore supplied by the user as the canonical",
#>     "effect-site covariate CEFFECT rather than generated by a PK model in this",
#>     "file. No inter-individual variability and no residual-error model are",
#>     "reported, so both are absent / fixed at zero.",
#>     sep = " "
#>   )
#>   reference <- paste(
#>     "Zhao S, Zhang L (2025).",
#>     "Evaluation of the PK/PD Changes on MASLD-Related Population - An Example",
#>     "From Simultaneous Acetaminophen Parent-Metabolite PBPK/PD Modeling.",
#>     "CPT Pharmacometrics Syst Pharmacol 15(1):e70161.",
#>     "doi:10.1002/psp4.70161.",
#>     sep = " "
#>   )
#>   vignette <- "Zhao_2025b_paracetamol_painrelief"
#>   units <- list(
#>     time = "h",
#>     dosing = "(not applicable; plasma concentration is supplied as the CEFFECT covariate, not as a dose record)",
#>     concentration = "ug/mL (paracetamol plasma concentration via CEFFECT; the PD output score is a 0-10 pain relief score)"
#>   )
#>
#>   covariateData <- list(
#>     CEFFECT = list(
#>       description = "Paracetamol (acetaminophen) plasma concentration (ug/mL), supplied as the driver of the direct sigmoid Emax pain relief response",
#>       units = "ug/mL",
#>       type = "continuous",
#>       reference_category = NULL,
#>       notes = paste(
#>         "Member of the canonical effect-site PD driver family CEFFECT; here the",
#>         "biophase is taken to be PLASMA: Zhao 2025 Results ('PK/PD Simulation on",
#>         "MASLD-Related Population') states 'Predicted APAP plasma concentrations",
#>         "were related to pain relief scores using a Sigmoid Emax model'. The",
#>         "supplement ('The exploration of the PK-PD model that links the",
#>         "appropriate effect-site species to analgesia') justifies plasma as a",
#>         "surrogate for unbound brain exposure: the PBPK-simulated plasma and",
#>         "unbound brain profiles peak at 0.89 h and 0.96 h (brain Kp 1.519),",
#>         "with Cmax about 10000 ng/mL in plasma and 7500 ng/mL unbound in brain",
#>         "(Figure S7). In the source study CEFFECT is the plasma profile predicted",
#>         "by the authors' GastroPlus PBPK model for each population (normal",
#>         "weight, overweight, obese, non-NAFLD, NAFLD, NASH, healthy, cirrhosis",
#>         "Child-Pugh A/B/C). That PBPK model is NOT reproduced in this file. Its",
#>         "printed benchmark aggregates, from noncompartmental analysis of the",
#>         "observed intravenous studies, are Vss 68.46 L and total CL 21.18 L/h",
#>         "(Zhao 2025 Results). For downstream simulation users supply CEFFECT",
#>         "from a paracetamol population PK model in mg/L (= ug/mL) or from",
#>         "observed plasma concentrations; units must be ug/mL because EC50 is."
#>       ),
#>       source_name = "(none; plasma concentration is a PBPK-predicted profile, not a named data column in the source)"
#>     )
#>   )
#>
#>   population <- list(
#>     species = "human",
#>     n_subjects = NA_integer_,
#>     n_studies = 1L,
#>     age_range = "adults (not reported in Zhao 2025)",
#>     weight_range = "not reported",
#>     sex_female_pct = NA_real_,
#>     race_ethnicity = "Japanese (Shinoda 2007 benchmark cohort)",
#>     disease_state = "chronic pain (PD benchmark cohort); PD simulated for normal-weight, overweight, obese, NAFLD, NASH and cirrhosis Child-Pugh A/B/C virtual populations",
#>     dose_range = "1 g oral paracetamol tablet, single dose (Shinoda 2007 benchmark, Zhao 2025 Table S3)",
#>     regions = "Japan (benchmark data)",
#>     notes = paste(
#>       "Zhao 2025 Methods ('The PK/PD Model on the MASLD-Related Population'):",
#>       "'The PD here refers to the pain relief score, which is in the range of",
#>       "0-10. The PK/PD data, which was done on chronic pain patients from",
#>       "Shinoda's report, was used as the benchmark.' Zhao 2025 does not restate",
#>       "the size or demographics of the Shinoda 2007 cohort (Shinoda S et al.,",
#>       "Biol Pharm Bull 2007;30(1):157-161), so n_subjects, sex and weight are",
#>       "left unreported here rather than taken from that paper, which is not",
#>       "part of the source set. The PD parameters were obtained with the",
#>       "GastroPlus PD module; the paper calls them 'the individual PD",
#>       "parameters' and reports no standard errors."
#>     )
#>   )
#>
#>   ini({
#>     # ------------------------------------------------------------------
#>     # Zhao 2025 Results, 'PK/PD Simulation on MASLD-Related Population':
#>     # 'Predicted APAP plasma concentrations were related to pain relief
#>     # scores using a Sigmoid Emax model, also known as Hill equations ...
#>     # Pain relief scores were treated as continuous variables on a scale of
#>     # 0-10. The individual PD parameters are: E0 = 0, EC50 = 1.612 ug/mL,
#>     # Emax = 3.898, Hill coefficient = 1.36, where E0 is the worst pain
#>     # relief possible, Emax represents the maximum pain relief score'.
#>     #
#>     #   score = E0 + Emax * C^hill / (EC50^hill + C^hill)
#>     #
#>     # No IIV, standard error or residual-error model is reported for the
#>     # PD layer, so no eta is declared and the residual SD is fixed at zero.
#>     # ------------------------------------------------------------------
#>
#>     e0 <- fixed(0)
#>     label("Baseline pain relief score with no drug (score units, 0-10 scale)")
#>     # Zhao 2025 Results: 'E0 = 0 ... where E0 is the worst pain relief
#>     # possible'. Fixed: the bottom of the 0-10 scale, not an estimate.
#>
#>     lemax <- log(3.898)
#>     label("Log of Emax, maximum drug-attributable pain relief score (score units)")
#>     # Zhao 2025 Results: 'Emax = 3.898'.
#>
#>     lec50 <- log(1.612)
#>     label("Log of EC50, plasma paracetamol concentration giving half of Emax (ug/mL)")
#>     # Zhao 2025 Results: 'EC50 = 1.612 ug/mL'.
#>
#>     lhill <- log(1.36)
#>     label("Log of the Hill coefficient of the sigmoid Emax function (unitless)")
#>     # Zhao 2025 Results: 'Hill coefficient = 1.36'.
#>
#>     addSd <- fixed(0)
#>     label("Additive residual SD on the pain relief score (score units; ZERO - no residual-error model is reported by the source)")
#>   })
#>
#>   model({
#>     # 1. Paracetamol plasma concentration for this record, in ug/mL,
#>     #    supplied through the canonical CEFFECT covariate column. Zhao 2025
#>     #    relates the score directly to plasma concentration, with no effect
#>     #    compartment.
#>     conc <- CEFFECT
#>
#>     # 2. Typical-value PD parameters (no IIV reported).
#>     emax <- exp(lemax)
#>     ec50 <- exp(lec50)
#>     hill <- exp(lhill)
#>
#>     # 3. Direct sigmoid Emax on plasma concentration.
#>     score <- e0 + emax * conc^hill / (ec50^hill + conc^hill)
#>
#>     # 4. Observation. The additive residual SD is fixed at zero because the
#>     #    source reports no residual-error model; users refitting this model
#>     #    to individual pain relief data should free addSd.
#>     score ~ add(addSd)
#>   })
#> }
#> <environment: 0x55fe055ecc80>
Population
The PD relationship was benchmarked on the plasma concentration and pain relief data of Shinoda 2007 (Biol Pharm Bull 30:157-161), a study of Japanese patients with chronic pain given a single 1 g oral paracetamol tablet (Zhao 2025 Methods, “The PK/PD Model on the MASLD-Related Population”, and supplementary Table S3). Zhao 2025 does not restate the size or demographics of that cohort, so they are left unreported in the model metadata. The PD model was then applied, unchanged, to the PBPK-predicted plasma profiles of the normal-weight, overweight, obese, non-NAFLD, NAFLD, NASH, healthy and cirrhosis Child-Pugh A/B/C virtual populations.
str(rxode2::rxode(readModelDb("Zhao_2025b_paracetamol_painrelief"))$population)
#> List of 11
#>  $ species       : chr "human"
#>  $ n_subjects    : int NA
#>  $ n_studies     : int 1
#>  $ age_range     : chr "adults (not reported in Zhao 2025)"
#>  $ weight_range  : chr "not reported"
#>  $ sex_female_pct: num NA
#>  $ race_ethnicity: chr "Japanese (Shinoda 2007 benchmark cohort)"
#>  $ disease_state : chr "chronic pain (PD benchmark cohort); PD simulated for normal-weight, overweight, obese, NAFLD, NASH and cirrhosi"| __truncated__
#>  $ dose_range    : chr "1 g oral paracetamol tablet, single dose (Shinoda 2007 benchmark, Zhao 2025 Table S3)"
#>  $ regions       : chr "Japan (benchmark data)"
#>  $ notes         : chr "Zhao 2025 Methods ('The PK/PD Model on the MASLD-Related Population'): 'The PD here refers to the pain relief s"| __truncated__
Source trace
| Element | Value | Source |
|---|---|---|
| Model form | score = E0 + Emax * C^hill / (EC50^hill + C^hill) |
Results, “PK/PD Simulation on MASLD-Related Population” (“Sigmoid Emax model, also known as Hill equations”) |
Driver C
|
plasma paracetamol concentration (CEFFECT, ug/mL) |
same paragraph (“Predicted APAP plasma concentrations were related to pain relief scores”); supplement, effect-site section |
| Output scale | pain relief score, continuous, 0-10 | Methods, “The PK/PD Model on the MASLD-Related Population”; Results |
e0 |
0 (fixed) | Results (“E0 = 0 … the worst pain relief possible”) |
lemax |
log(3.898) | Results (“Emax = 3.898”) |
lec50 |
log(1.612 ug/mL) | Results (“EC50 = 1.612 ug/mL”) |
lhill |
log(1.36) | Results (“Hill coefficient = 1.36”) |
addSd |
0 (fixed) | not reported; see Assumptions |
| Peak score 3.15 (normal weight) to 2.63 (obese) | used as a check below | Results, same paragraph |
| Plasma Cmax about 10000 ng/mL after 1 g (Shinoda benchmark) | used as a check below | Supplement, Figure S7 paragraph |
Concentration-response relationship
conc_grid <- data.frame(
  id = 1L,
  time = seq(0, 30, by = 0.01),
  evid = 0L
)
conc_grid$CEFFECT <- conc_grid$time
cr <- as.data.frame(rxSolve(mod, conc_grid)) |>
  mutate(CEFFECT = time)
ggplot(cr, aes(CEFFECT, score)) +
  geom_line(linewidth = 0.8) +
  geom_vline(xintercept = 1.612, linetype = "dashed") +
  geom_hline(yintercept = 3.898, linetype = "dotted") +
  labs(
    x = "Plasma paracetamol concentration (ug/mL)",
    y = "Pain relief score (0-10)"
  ) +
  theme_bw()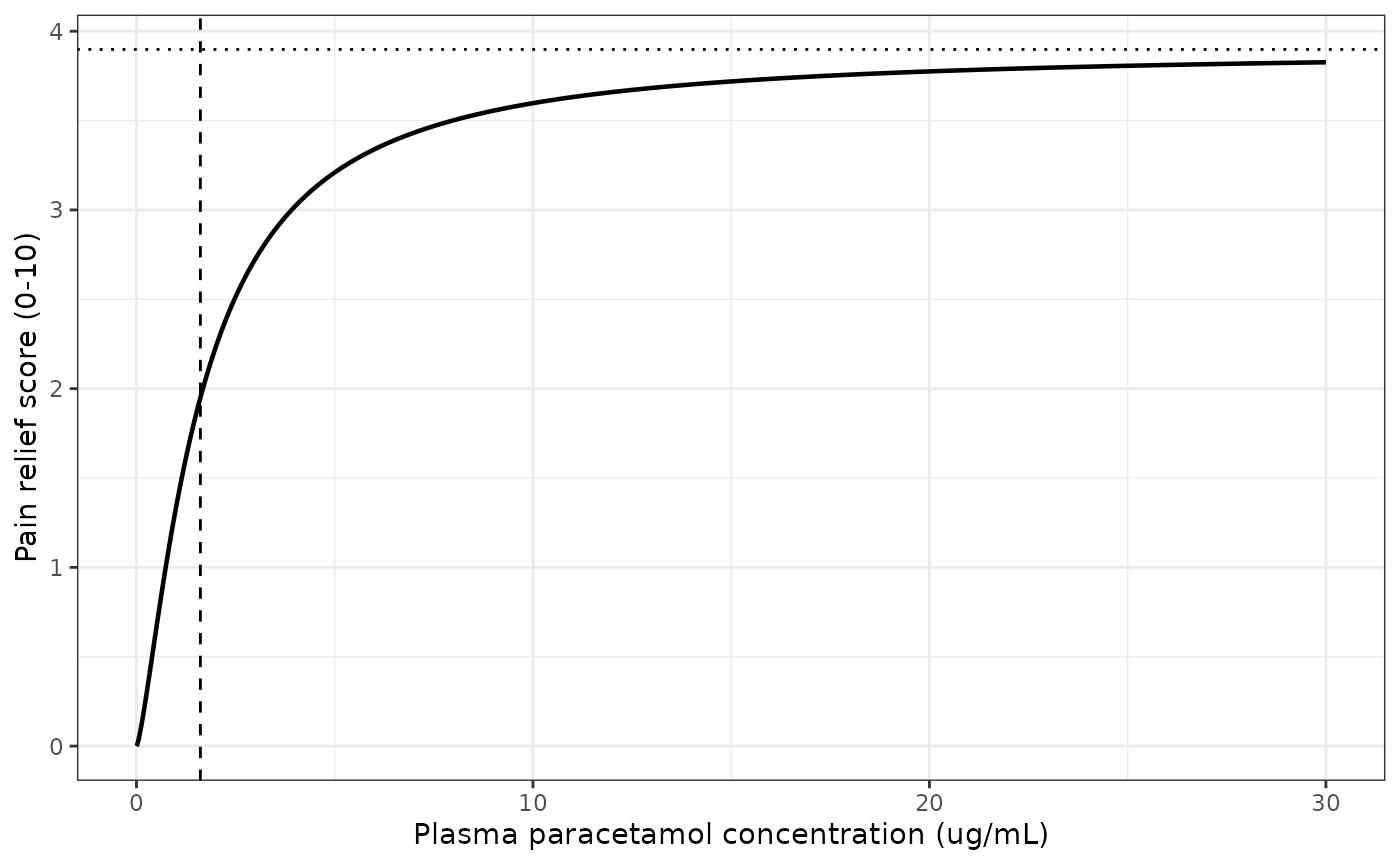
Pain relief score versus plasma paracetamol concentration. This is the concentration-response relationship underlying Figure 5 of Zhao 2025 (Figure 5 shows it in 3-D against time and concentration). The dashed line marks EC50 = 1.612 ug/mL.
Definitional checks
These checks use the model on its own printed parameters, so they are exact and a transcription error in any of the four values breaks them.
score_at <- function(conc) {
  d <- data.frame(id = 1L, time = seq_along(conc) - 1, evid = 0L, CEFFECT = conc)
  as.data.frame(rxSolve(mod, d))$score
}
emax <- 3.898
ec50 <- 1.612
hill <- 1.36
checks <- data.frame(
  check = c(
    "score at C = 0 equals E0",
    "score at C = EC50 equals Emax / 2",
    "score at C = 1000 ug/mL approaches Emax",
    "score at 2 x EC50, closed form"
  ),
  model = score_at(c(0, ec50, 1000, 2 * ec50)),
  expected = c(0, emax / 2, emax * 1000^hill / (ec50^hill + 1000^hill),
               emax * 2^hill / (1 + 2^hill))
)
knitr::kable(checks, digits = 5)| check | model | expected |
|---|---|---|
| score at C = 0 equals E0 | 0.00000 | 0.00000 |
| score at C = EC50 equals Emax / 2 | 1.94900 | 1.94900 |
| score at C = 1000 ug/mL approaches Emax | 3.89738 | 3.89738 |
| score at 2 x EC50, closed form | 2.80516 | 2.80516 |
Peak scores stated in the paper
Zhao 2025 reports that, from normal weight to obese, the predicted
peak pain relief score falls “from 3.15 to 2.63”. Because the model is a
direct Emax on plasma concentration, each peak score corresponds to
exactly one peak plasma concentration, obtained by inverting the Hill
equation: C = EC50 * (E / (Emax - E))^(1 / hill).
inv <- data.frame(
  population = c("normal weight", "obese"),
  peak_score = c(3.15, 2.63)
) |>
  mutate(implied_cmax_ug_mL = ec50 * (peak_score / (emax - peak_score))^(1 / hill))
inv$model_score_at_implied_cmax <- score_at(inv$implied_cmax_ug_mL)
inv |>
  dplyr::rename(
    "Population" = population,
    "Peak score (paper)" = peak_score,
    "Implied plasma Cmax (ug/mL)" = implied_cmax_ug_mL,
    "Model score at that Cmax" = model_score_at_implied_cmax
  ) |>
knitr::kable(digits = 3)| Population | Peak score (paper) | Implied plasma Cmax (ug/mL) | Model score at that Cmax |
|---|---|---|---|
| normal weight | 3.15 | 4.640 | 3.15 |
| obese | 2.63 | 2.756 | 2.63 |
The implied peak concentrations, 4.6 and 2.8 ug/mL, lie inside the 0-8000 ng/mL concentration axis of the normal-weight / overweight / obese panel of Figure 5, and the obese population’s lower value is consistent with the paper’s statement that obesity lowers APAP peak concentrations. The supplement reports a PBPK-simulated plasma Cmax of about 10000 ng/mL for the 1 g tablet benchmark (Figure S7); at 10 ug/mL the model gives a score of 3.6, close to the plateau of about 3.6-3.8 visible in the control-group curves of Figure 5.
Simulation: driving the PD model from a population PK model
In use, CEFFECT comes from a paracetamol PK model. Here
the plasma profile after a single 1 g fasted tablet in a 70 kg, 176 cm
man is taken from the library’s Morse_2022_acetaminophen
popPK model (healthy adults, the same 1 g tablet dose as the Shinoda
benchmark) and fed into the pain relief model. This illustrates the
workflow; it does not reproduce the GastroPlus profiles of Zhao 2025,
whose peak-effect times (0.49-0.97 h across the populations) depend on
the unreproducible PBPK layer.
pk <- readModelDb("Morse_2022_acetaminophen")
pk_cov <- function(ev) {
  ev$WT <- 70
  ev$HT <- 176
  ev$SEXF <- 0
  ev$FED <- 0
  ev$FORM_APAPIBU_SUSP <- 0
  ev$FORM_POWDER <- 0
  ev
}
ev_typ <- et(amt = 1000, cmt = "depot") |>
  et(seq(0, 8, by = 0.01), cmt = "central") |>
  as.data.frame() |>
  pk_cov()
# zeroRe() removes the residual error too, so rxode2 warns "No sigma
# parameters in the model"; that is the intended typical-value solve.
pk_typ <- suppressWarnings(
  as.data.frame(rxSolve(rxode2::zeroRe(pk), ev_typ, returnType = "data.frame"))
)
#> ℹ parameter labels from comments will be replaced by 'label()'
#> ℹ omega/sigma items treated as zero: 'etalcl', 'etalvc', 'etalq', 'etalvp', 'etalfdepot', 'etaltabs', 'etaltlag', 'etaRUV'

pd_in <- data.frame(id = 1L, time = pk_typ$time, evid = 0L, CEFFECT = pk_typ$Cc)
pd_typ <- as.data.frame(rxSolve(mod, pd_in)) |>
  mutate(Cc = pk_typ$Cc)
pd_long <- bind_rows(
  data.frame(time = pd_typ$time, value = pd_typ$Cc, panel = "Plasma paracetamol (ug/mL)"),
  data.frame(time = pd_typ$time, value = pd_typ$score, panel = "Pain relief score (0-10)")
)
ggplot(pd_long, aes(time, value)) +
  geom_line(linewidth = 0.8) +
  facet_wrap(~panel, ncol = 1, scales = "free_y") +
  labs(x = "Time after dose (h)", y = NULL) +
  theme_bw()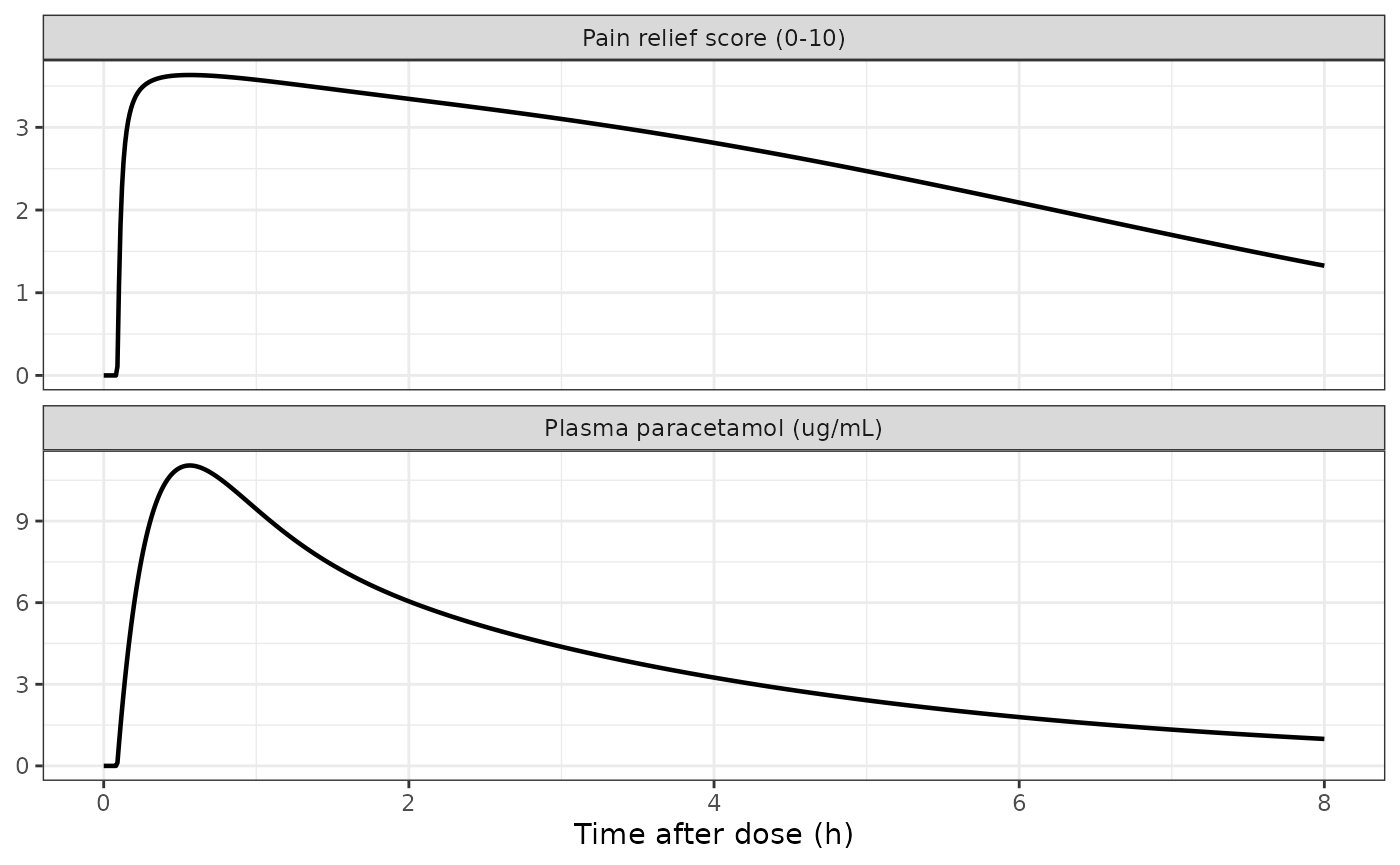
Typical plasma paracetamol concentration after a 1 g fasted tablet (Morse 2022 popPK) and the pain relief score it drives through the Zhao 2025 PD model. Compare with the time axis of Figure 5 of Zhao 2025.
NCA of the driving profile and the direct-effect identity
For a direct (no effect-compartment) Emax model, the peak score occurs at the plasma Tmax and equals the Emax function evaluated at the plasma Cmax. PKNCA supplies the driver’s Cmax and Tmax.
nca_conc <- pk_typ |>
  dplyr::filter(!is.na(Cc)) |>
  mutate(id = 1L, treatment = "1 g tablet") |>
  select(id, time, Cc, treatment)
nca_dose <- data.frame(id = 1L, time = 0, amt = 1000, treatment = "1 g tablet")
conc_obj <- PKNCAconc(nca_conc, Cc ~ time | treatment + id)
dose_obj <- PKNCAdose(nca_dose, amt ~ time | treatment + id)
intervals <- data.frame(start = 0, end = 8, cmax = TRUE, tmax = TRUE, auclast = TRUE)
nca_res <- pk.nca(PKNCAdata(conc_obj, dose_obj, intervals = intervals))
nca_tab <- as.data.frame(nca_res$result) |>
  select(PPTESTCD, PPORRES)
knitr::kable(nca_tab, digits = 3)| PPTESTCD | PPORRES |
|---|---|
| auclast | 32.447 |
| cmax | 11.043 |
| tmax | 0.560 |
cmax_pk <- nca_tab$PPORRES[nca_tab$PPTESTCD == "cmax"]
tmax_pk <- nca_tab$PPORRES[nca_tab$PPTESTCD == "tmax"]
peak_pd <- max(pd_typ$score)
tpeak_pd <- pd_typ$time[which.max(pd_typ$score)]
identity <- data.frame(
  quantity = c("time of peak score (h)", "peak score"),
  from_pd = c(tpeak_pd, peak_pd),
  from_pk = c(tmax_pk, score_at(cmax_pk))
)
knitr::kable(identity, digits = 4)| quantity | from_pd | from_pk |
|---|---|---|
| time of peak score (h) | 0.5600 | 0.5600 |
| peak score | 3.6327 | 3.6327 |
Variability in the driving PK
The PD layer has no reported between-subject variability, so all spread in the predicted score below comes from the Morse 2022 PK variability (200 simulated adults with the same covariates).
rxode2::rxSetSeed(20251125)
n_sub <- 200
ev_pop <- et(amt = 1000, cmt = "depot") |>
  et(seq(0, 8, by = 0.05), cmt = "central") |>
  et(id = seq_len(n_sub)) |>
  as.data.frame() |>
  pk_cov()
pk_pop <- as.data.frame(rxSolve(pk, ev_pop, returnType = "data.frame"))
#> ℹ parameter labels from comments will be replaced by 'label()'
# The PD model has no etas, so rxode2 warns about a multi-subject solve
# without omega; each subject differs only through its own CEFFECT column.
pd_pop <- suppressWarnings(as.data.frame(rxSolve(
  mod,
  data.frame(id = pk_pop$id, time = pk_pop$time, evid = 0L, CEFFECT = pk_pop$Cc)
)))
band <- pd_pop |>
  group_by(time) |>
  summarise(
    p05 = quantile(score, 0.05),
    p50 = median(score),
    p95 = quantile(score, 0.95),
    .groups = "drop"
  )
peak_by_id <- pd_pop |>
  group_by(id) |>
  summarise(peak = max(score), tpeak = time[which.max(score)], .groups = "drop")
summary(peak_by_id$peak)
#>    Min. 1st Qu.  Median    Mean 3rd Qu.    Max.
#>   2.737   3.476   3.584   3.539   3.663   3.810
summary(peak_by_id$tpeak)
#>    Min. 1st Qu.  Median    Mean 3rd Qu.    Max.
#>  0.2000  0.4500  0.6000  0.7788  1.0000  3.3500
ggplot(band, aes(time)) +
  geom_ribbon(aes(ymin = p05, ymax = p95), alpha = 0.25) +
  geom_line(aes(y = p50), linewidth = 0.8) +
  labs(x = "Time after dose (h)", y = "Pain relief score (0-10)") +
  theme_bw()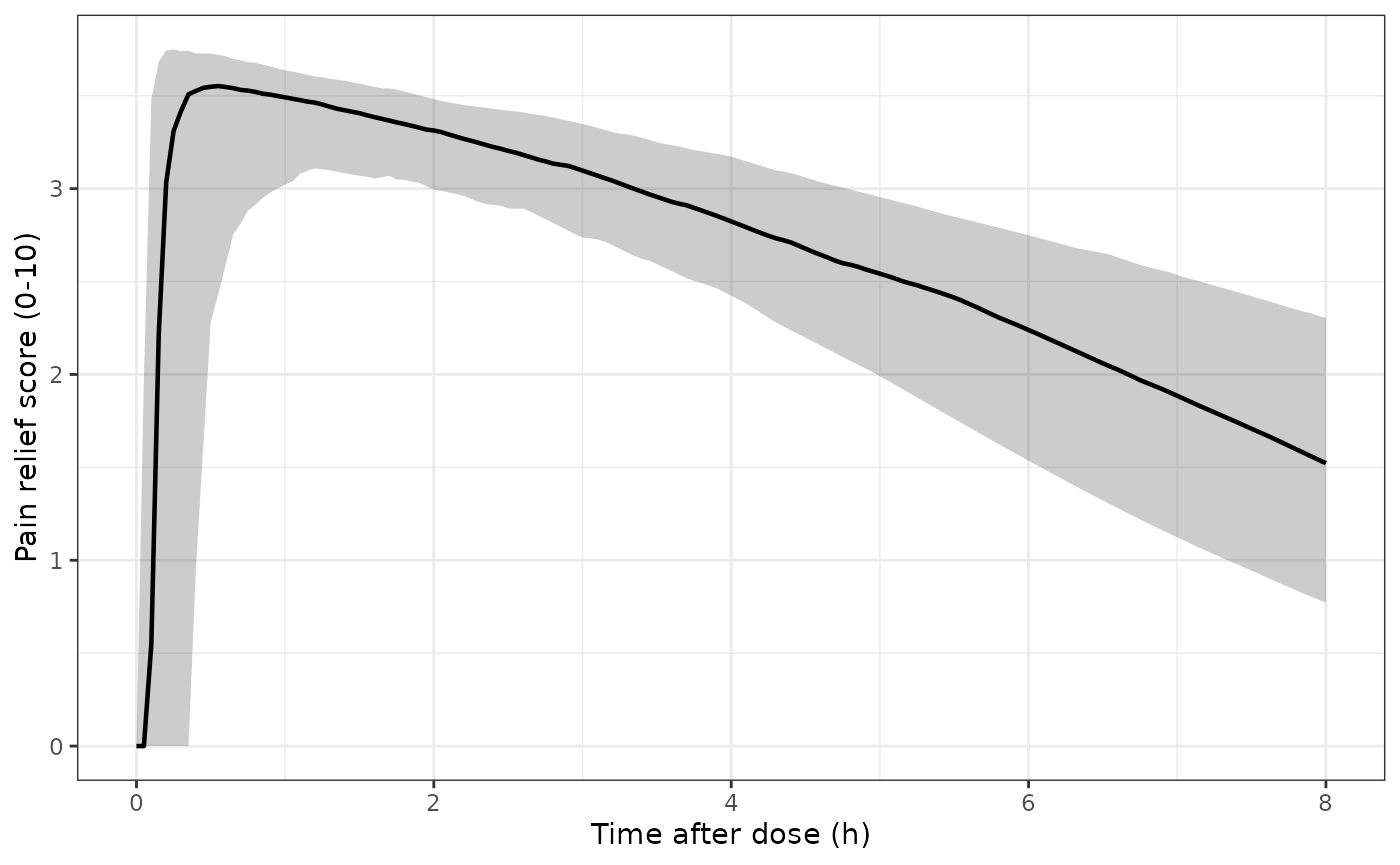
Median and 90% interval of the pain relief score after a 1 g fasted tablet, with spread from Morse 2022 PK variability only.
Assumptions and deviations
-
Only the PD layer is packaged. The paracetamol and
five-metabolite PBPK layers were built in GastroPlus. Their tissue
partition coefficients are given only as a method name (Lukacova),
enzyme Vmax values are expressed per mg of enzyme with the per-tissue
enzyme amounts left to the software, organ volumes and blood flows come
from the software’s PEAR physiology generator, and the overweight /
obese / NAFLD / NASH / cirrhosis physiologies are the platform’s preset
populations used without modification (Discussion). None of these are
printed, so the PBPK model cannot be reproduced from the publication.
The paper’s printed Vss (68.46 L) and total clearance (21.18 L/h) are
noncompartmental summaries of the observed intravenous studies used as
benchmarks, not parameters of the PBPK model, and a compartmental model
built from them would not carry the paper’s MASLD-population
predictions. They are recorded in the
CEFFECTcovariate notes for provenance. - Plasma is the effect site. The paper relates the score directly to plasma concentration with no effect compartment; its supplement argues that plasma is a reasonable surrogate for unbound brain concentration, because the simulated profiles peak 0.07 h apart.
- Origin of the PD parameters. The paper calls E0, EC50, Emax and the Hill coefficient “the individual PD parameters” obtained with the GastroPlus PD module against the Shinoda 2007 benchmark data, and gives no standard errors. They are carried exactly as printed; E0 = 0 is the bottom of the score scale and is fixed.
- No variability or residual error. No between-subject variability or residual-error model is reported for the PD layer; the residual SD is fixed at zero. Users fitting this model to individual data should free it.
- Benchmark cohort not described. Zhao 2025 does not restate the size, sex mix or body weight of the Shinoda 2007 cohort, so those population fields are left unreported.
- Figure 5 not digitised. Figure 5 is a 3-D rendering of score against time and concentration, which cannot be read reliably; the checks above use the peak scores and concentrations stated in the text instead.
-
Driving PK in this vignette. The simulations use
the library’s Morse 2022 popPK model as the source of
CEFFECT, which is a demonstration of the intended workflow and not part of Zhao 2025.