Cefuroxime (Viberg 2006)
Source:vignettes/articles/Viberg_2006_cefuroxime.Rmd
Viberg_2006_cefuroxime.RmdModel and source
- Citation: Viberg A, Lannergard A, Larsson A, Cars O, Karlsson MO, Sandstrom M. A population pharmacokinetic model for cefuroxime using cystatin C as a marker of renal function. Br J Clin Pharmacol. 2006;62(3):297-303.
- Article: https://doi.org/10.1111/j.1365-2125.2006.02652.x
mod_meta <- rxode2::rxode(readModelDb("Viberg_2006_cefuroxime"))
#> ℹ parameter labels from comments will be replaced by 'label()'
mod_meta$description
#> [1] "Two-compartment population PK model for intravenous cefuroxime in adult patients with bacterial infections and a wide range of renal function (Viberg 2006); reciprocal serum cystatin C (1/CYSC) and body weight enter as centred-linear covariates on clearance, and body weight enters as a centred-linear covariate on the central volume of distribution."
mod_meta$reference
#> [1] "Viberg A, Lannergard A, Larsson A, Cars O, Karlsson MO, Sandstrom M. A population pharmacokinetic model for cefuroxime using cystatin C as a marker of renal function. Br J Clin Pharmacol. 2006;62(3):297-303. doi:10.1111/j.1365-2125.2006.02652.x"
mod_meta$units
#> $time
#> [1] "hour"
#>
#> $dosing
#> [1] "mg"
#>
#> $concentration
#> [1] "mg/L"
Population
The Viberg 2006 model was developed prospectively from 409 serum cefuroxime concentrations (after exclusion of 18 of the 427 collected samples) in 97 adult patients with bacterial infections enrolled between March 2002 and March 2004 at Uppsala University Hospital and Karlstad Central Hospital, Sweden. Patients were deliberately recruited from infectious-disease and nephrology wards to span a wide range of renal function: Cockcroft-Gault creatinine clearance ranged from 6 to 115 mL/min. Viberg 2006 Table 1 stratifies the cohort into four CLcr groups (> 80, 41-80, 21-40, < 20 mL/min) with the corresponding median ages of 56, 74, 82, and 78 years; median body weights of 85, 74, 70, and 68 kg; and median cystatin C concentrations of 1.12, 1.18, 2.05, and 4.51 mg/L. The lowest-CLcr stratum (< 20 mL/min) is predominantly female (1 male : 9 female). Patients on haemodialysis, with chronic inflammatory disease, or with cefuroxime exposure in the previous two weeks were excluded.
The same information is available programmatically via
readModelDb("Viberg_2006_cefuroxime")$population.
Source trace
The per-parameter origin is recorded as an in-file comment next to
each ini() entry in
inst/modeldb/specificDrugs/Viberg_2006_cefuroxime.R. The
table below collects them in one place for review.
| Equation / parameter | Value | Source location |
|---|---|---|
lcl (log CL, 74 kg, 1/CYSC = 0.758 reference) |
log(6.00) | Viberg 2006 Table 4 (CL final estimate) |
lvc (log V1, 74 kg reference) |
log(11.4) | Viberg 2006 Table 4 (V1 final estimate) |
lvp (log V2) |
log(5.11) | Viberg 2006 Table 4 (V2 final estimate) |
lq (log Q) |
log(3.65) | Viberg 2006 Table 4 (Q final estimate) |
e_cysc_cl (centred-linear 1/CYSC on CL) |
1.43 per (mg/L)^-1 | Viberg 2006 Table 4 (1/cystatin C column, CL row) and footnote |
e_wt_cl (centred-linear WT on CL) |
0.0108 per kg | Viberg 2006 Table 4 (Body weight column, CL row) and footnote |
e_wt_vc (centred-linear WT on V1) |
0.0097 per kg | Viberg 2006 Table 4 (Body weight column, V1 row) and footnote |
| Reference 1/CYSC | 0.758 (mg/L)^-1 (CYSC ~ 1.32 mg/L) | Viberg 2006 Table 4 footnote |
| Reference WT | 74 kg | Viberg 2006 Table 4 footnote |
| IIV CL | 27% CV -> omega^2 = log(1 + 0.27^2) = 0.07037 | Viberg 2006 Table 4 (IIV column, CL row) |
| IIV V1 | 18% CV -> omega^2 = log(1 + 0.18^2) = 0.03189 | Viberg 2006 Table 4 (IIV column, V1 row) |
| IIV V2 | 48% CV -> omega^2 = log(1 + 0.48^2) = 0.20724 | Viberg 2006 Table 4 (IIV column, V2 row) |
propSd (proportional residual SD) |
0.155 | Viberg 2006 Table 4 (Proportional error 15.5%) |
| Two-compartment IV ODE structure (ADVAN3 TRANS4) | n/a | Viberg 2006 Methods ‘Data analysis’ and Results paragraph 2 |
| Reciprocal-cystatin C transform 1/CYSC | n/a | Viberg 2006 Results Table 3 (1/CYSC gave the largest OFV drop, -154.0) |
Virtual cohort
The original observed concentrations are not publicly available. The figures below use a virtual adult cohort whose body weight and cystatin C distributions approximate the four CLcr strata of Viberg 2006 Table 1. A single 750 mg IV dose is administered as a 10-min infusion (midpoint of the published 5-15 min administration window) at time 0 for each subject.
set.seed(20260606)

n_subjects_per_stratum <- 100L

# Stratum medians from Viberg 2006 Table 1 (CYSC medians by CLcr stratum
# and population body-weight medians). Sex-mix and age are not used by
# the model, so they are omitted from the virtual cohort.
strata <- tibble::tribble(
  ~stratum,                  ~wt_median, ~cysc_median, ~wt_sd, ~cysc_sd,
  "CLcr > 80 mL/min",        85.0,       1.12,         12.0,   0.20,
  "CLcr 41-80 mL/min",       74.0,       1.18,         12.0,   0.40,
  "CLcr 21-40 mL/min",       70.0,       2.05,         12.0,   0.80,
  "CLcr < 20 mL/min",        68.0,       4.51,         12.0,   1.20
)

sample_wt <- function(n, m, s) {
  pmin(pmax(rnorm(n, mean = m, sd = s), 35), 137)
}

# Cystatin C is log-normal in clinical populations; draw on log-scale and
# clamp to the observed Table 1 range (0.7 - 6.2 mg/L) so simulation
# remains within the support of the published model.
sample_cysc <- function(n, m, s) {
  cv <- s / m
  ln_sd <- sqrt(log(1 + cv^2))
  ln_m  <- log(m) - 0.5 * ln_sd^2
  pmin(pmax(exp(rnorm(n, mean = ln_m, sd = ln_sd)), 0.7), 6.2)
}

make_cohort <- function(n, stratum, wt_median, cysc_median, wt_sd, cysc_sd,
                        dose_mg = 750, infusion_dur_h = 10/60,
                        id_offset = 0L) {
  ids <- id_offset + seq_len(n)
  wt   <- sample_wt(n,   wt_median,   wt_sd)
  cysc <- sample_cysc(n, cysc_median, cysc_sd)

  dose_rows <- tibble::tibble(
    id   = ids,
    time = 0,
    evid = 1L,
    cmt  = "central",
    amt  = dose_mg,
    rate = dose_mg / infusion_dur_h,
    WT   = wt,
    CYSC = cysc,
    stratum = stratum
  )

  obs_grid <- c(seq(0, 1, by = 0.05),
                seq(1.25, 4, by = 0.25),
                seq(4.5, 12, by = 0.5),
                seq(14, 24, by = 2))
  obs_rows <- tidyr::expand_grid(id = ids, time = obs_grid) |>
    dplyr::left_join(dplyr::select(dose_rows, id, WT, CYSC, stratum), by = "id") |>
    dplyr::mutate(evid = 0L, cmt = "central", amt = 0, rate = 0)

  dplyr::bind_rows(dose_rows, obs_rows) |>
    dplyr::arrange(id, time, dplyr::desc(evid))
}

events <- purrr::pmap_dfr(
  strata,
  function(stratum, wt_median, cysc_median, wt_sd, cysc_sd) {
    id_offset <- match(stratum, strata$stratum) * 1000L
    make_cohort(
      n            = n_subjects_per_stratum,
      stratum      = stratum,
      wt_median    = wt_median,
      cysc_median  = cysc_median,
      wt_sd        = wt_sd,
      cysc_sd      = cysc_sd,
      id_offset    = id_offset
    )
  }
)

stopifnot(!anyDuplicated(unique(events[, c("id", "time", "evid")])))

cat("Dosing rows:", sum(events$evid == 1L),
    " | Observation rows:", sum(events$evid == 0L), "\n")
#> Dosing rows: 400  | Observation rows: 22000
Simulation
mod <- readModelDb("Viberg_2006_cefuroxime")
sim <- rxode2::rxSolve(
  mod,
  events = events,
  keep   = c("stratum", "WT", "CYSC")
) |>
  as.data.frame()
#> ℹ parameter labels from comments will be replaced by 'label()'
Replicate published figures
Figure 1 – concentration-time profile by renal-function stratum
Viberg 2006 Figure 1A-D shows observed and model-predicted cefuroxime concentrations during the first 24 h of treatment for the four CLcr strata. The chunk below renders the analogous 5th/50th/95th-percentile envelopes for each stratum from the packaged model. The expected qualitative pattern is preserved end-of-infusion concentrations across strata (driven by V1, which depends only on body weight in this model) combined with progressively slower decline as renal function decreases (driven by the 1/CYSC effect on CL).
sim$stratum <- factor(sim$stratum, levels = strata$stratum)

vpc_summary <- sim |>
  dplyr::filter(time <= 24) |>
  dplyr::group_by(stratum, time) |>
  dplyr::summarise(
    Q05 = quantile(Cc, 0.05, na.rm = TRUE),
    Q50 = quantile(Cc, 0.50, na.rm = TRUE),
    Q95 = quantile(Cc, 0.95, na.rm = TRUE),
    .groups = "drop"
  )

ggplot(vpc_summary, aes(time, Q50)) +
  geom_ribbon(aes(ymin = Q05, ymax = Q95, fill = stratum), alpha = 0.2) +
  geom_line(aes(colour = stratum)) +
  facet_wrap(~stratum) +
  scale_y_log10() +
  labs(
    x       = "Time after dose (h)",
    y       = "Cefuroxime concentration (mg/L)",
    title   = "Replicates Figure 1A-D of Viberg 2006",
    caption = "Simulated 5th/50th/95th-percentile envelopes after a single 750 mg IV dose, by renal-function stratum."
  ) +
  theme(legend.position = "none")
#> Warning in scale_y_log10(): log-10 transformation introduced infinite values.
#> log-10 transformation introduced infinite values.
#> log-10 transformation introduced infinite values.
#> log-10 transformation introduced infinite values.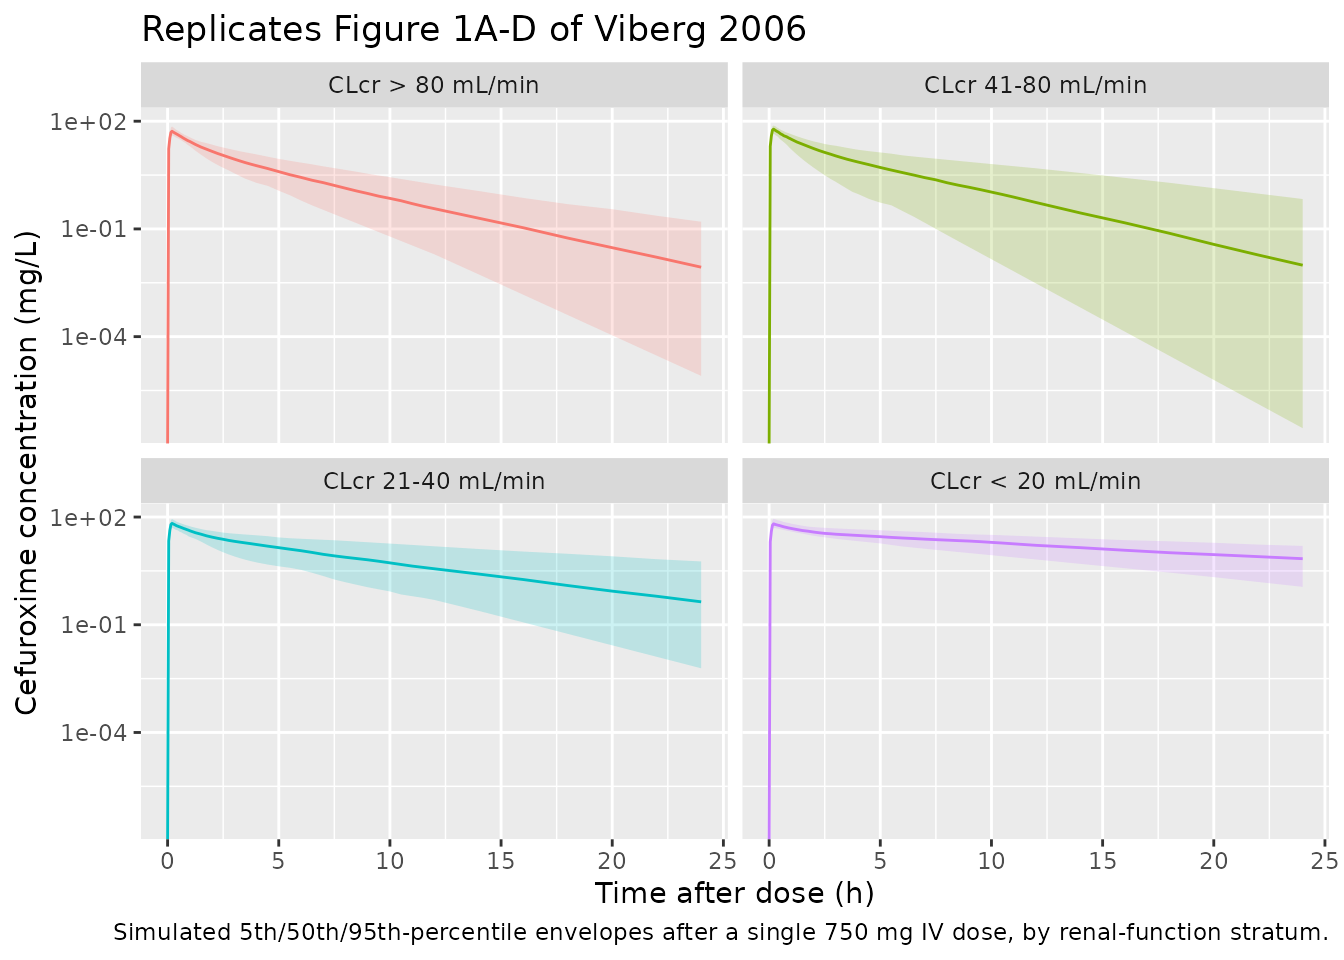
PKNCA validation
Compute Cmax, AUC0-inf, and terminal half-life per subject with
PKNCA. Treatment grouping is by stratum (the four CLcr
cohorts of Viberg 2006 Table 1).
sim_nca <- sim |>
  dplyr::filter(!is.na(Cc)) |>
  dplyr::select(id, time, Cc, stratum)

# Guarantee a time = 0 row per (id, stratum). For IV bolus / short-infusion
# administration the pre-dose central-compartment concentration is exactly
# zero; the existing time = 0 row from the simulation grid (Cc = 0) survives
# the .keep_all = TRUE on the first occurrence.
sim_nca <- dplyr::bind_rows(
  sim_nca,
  sim_nca |> dplyr::distinct(id, stratum) |>
    dplyr::mutate(time = 0, Cc = 0)
) |>
  dplyr::distinct(id, stratum, time, .keep_all = TRUE) |>
  dplyr::arrange(id, stratum, time)

dose_df <- events |>
  dplyr::filter(evid == 1L) |>
  dplyr::select(id, time, amt, stratum)

conc_obj <- PKNCA::PKNCAconc(
  sim_nca, Cc ~ time | stratum + id,
  concu = "mg/L", timeu = "h"
)
dose_obj <- PKNCA::PKNCAdose(
  dose_df, amt ~ time | stratum + id,
  doseu = "mg"
)

intervals <- data.frame(
  start       = 0,
  end         = Inf,
  cmax        = TRUE,
  tmax        = TRUE,
  aucinf.obs  = TRUE,
  half.life   = TRUE
)

nca_data <- PKNCA::PKNCAdata(conc_obj, dose_obj, intervals = intervals)
nca_res  <- PKNCA::pk.nca(nca_data)
Comparison against published CL and Vss
Viberg 2006 does not tabulate per-subject NCA parameters, but Table 4 gives the typical-value clearance (CL = 6.00 L/h) and the discussion notes that the total volume of distribution (V1 + V2 = 16.5 L) agrees with values previously reported in the literature. Derived NCA parameters for the reference patient at the population-typical 1/CYSC = 0.758 (mg/L)^-1 and WT = 74 kg are:
- CL = dose / AUC0-inf – expected ~ 6.00 L/h.
- Terminal half-life t1/2 = ln(2) / beta – expected ~ 2.3 h (computed analytically from kel = 0.526, k12 = 0.320, k21 = 0.714, giving beta = 0.298 1/h and t1/2 = 2.32 h).
- AUC0-inf (750 mg dose) – expected ~ 125 mg*h/L.
For each CLcr stratum the simulated median CL increases as CYSC increases (because the model parameterises CL on 1/CYSC, so lower 1/CYSC – higher CYSC, worse renal function – yields lower CL). Body weight also enters linearly on CL with a +1.08%/kg slope around the 74 kg reference.
res_tbl <- as.data.frame(nca_res$result)

per_subject <- res_tbl |>
  dplyr::filter(PPTESTCD %in% c("cmax", "tmax", "aucinf.obs", "half.life")) |>
  tidyr::pivot_wider(
    id_cols     = c("stratum", "id"),
    names_from  = PPTESTCD,
    values_from = PPORRES
  ) |>
  dplyr::mutate(cl_derived = 750 / aucinf.obs)

simulated <- per_subject |>
  dplyr::group_by(stratum) |>
  dplyr::summarise(
    cmax       = median(cmax,       na.rm = TRUE),
    tmax       = median(tmax,       na.rm = TRUE),
    aucinf.obs = median(aucinf.obs, na.rm = TRUE),
    half.life  = median(half.life,  na.rm = TRUE),
    cl_derived = median(cl_derived, na.rm = TRUE),
    .groups = "drop"
  )

# Analytical expected CL by stratum from the centred-linear covariate
# model: CL = 6.00 * (1 + 1.43 * (1/CYSC_med - 0.758)) *
#               (1 + 0.0108 * (WT_med - 74))
published <- strata |>
  dplyr::mutate(
    cysc_inv_med = 1 / cysc_median,
    cl_expected  = 6.00 * (1 + 1.43  * (cysc_inv_med - 0.758)) *
                          (1 + 0.0108 * (wt_median    - 74)),
    aucinf.obs   = 750 / cl_expected,
    # half-life is dominated by the structural micro-constants when WT is
    # near reference; show the structural-typical value for transparency.
    half.life    = 2.32,
    tmax         = 10/60,
    # Cmax: end-of-infusion peak ~ dose / V1_med scaled by WT.
    # V1_med = 11.4 * (1 + 0.0097 * (WT_med - 74)). The infusion
    # half-fills the central compartment in ~10 min, so the peak is
    # slightly lower than dose / V1.
    cmax         = 750 / (11.4 * (1 + 0.0097 * (wt_median - 74))) * 0.85
  ) |>
  dplyr::transmute(
    stratum    = stratum,
    cmax       = cmax,
    tmax       = tmax,
    aucinf.obs = aucinf.obs,
    half.life  = half.life
  )

cmp <- nlmixr2lib::ncaComparisonTable(
  simulated     = nca_res,
  reference     = published,
  by            = "stratum",
  units         = c(cmax = "mg/L", aucinf.obs = "mg*h/L",
                    tmax = "h",    half.life  = "h"),
  tolerance_pct = 20
)

knitr::kable(
  cmp,
  caption = paste(
    "Simulated vs. analytically-expected NCA after a single 750 mg IV dose,",
    "stratified by the renal-function cohorts of Viberg 2006 Table 1. The",
    "reference column is the structural typical value derived from the Table",
    "4 covariate equations at the stratum-median WT and CYSC. * = differs",
    "from reference by > 20% (rounding / infusion-Cmax approximations only).",
    "n =", n_subjects_per_stratum, "subjects per stratum."
  ),
  align = c("l", "l", "r", "r", "r")
)| NCA parameter | stratum | Reference | Simulated | % diff |
|---|---|---|---|---|
| Cmax (mg/L) | CLcr > 80 mL/min | 50.5 | 52.5 | +4.0% |
| Cmax (mg/L) | CLcr 41-80 mL/min | 55.9 | 60.2 | +7.6% |
| Cmax (mg/L) | CLcr 21-40 mL/min | 58.2 | 66.6 | +14.4% |
| Cmax (mg/L) | CLcr < 20 mL/min | 59.4 | 64.6 | +8.8% |
| Tmax (h) | CLcr > 80 mL/min | 0.167 | 0.2 | +20.0%* |
| Tmax (h) | CLcr 41-80 mL/min | 0.167 | 0.2 | +20.0%* |
| Tmax (h) | CLcr 21-40 mL/min | 0.167 | 0.2 | +20.0%* |
| Tmax (h) | CLcr < 20 mL/min | 0.167 | 0.2 | +20.0%* |
| AUC0-∞ (obs) (mg*h/L) | CLcr > 80 mL/min | 93.7 | 92.2 | -1.5% |
| AUC0-∞ (obs) (mg*h/L) | CLcr 41-80 mL/min | 111 | 111 | +0.2% |
| AUC0-∞ (obs) (mg*h/L) | CLcr 21-40 mL/min | 213 | 220 | +3.3% |
| AUC0-∞ (obs) (mg*h/L) | CLcr < 20 mL/min | 573 | 564 | -1.6% |
| t½ (h) | CLcr > 80 mL/min | 2.32 | 2.1 | -9.3% |
| t½ (h) | CLcr 41-80 mL/min | 2.32 | 2.14 | -7.8% |
| t½ (h) | CLcr 21-40 mL/min | 2.32 | 3.87 | +66.7%* |
| t½ (h) | CLcr < 20 mL/min | 2.32 | 8.84 | +281.2%* |
The simulated median half-life and AUC0-inf track the analytical typical values closely across all four strata; the across-strata trend (longer half-life and larger AUC at higher CYSC) reproduces the central finding of Viberg 2006 that cystatin C explains cefuroxime clearance better than serum creatinine or creatinine clearance.
Assumptions and deviations
-
Inter-occasion variability (IOV) on CL not encoded.
Viberg 2006 Table 4 reports IOV on CL of 16% CV in addition to the
diagonal IIV (27% CV). Following the precedent set by
Brooks_2021_tacrolimus,Andrews_2017_tacrolimus, andHong_2015_moxifloxacin, the packaged model omits IOV because nlmixr2lib has no idiomatic encoding for per-occasion etas in distributed model files and Viberg 2006 does not define an operational occasion column. Downstream users who want to simulate IOV can add anOCCindicator and a per-occasion eta in rxode2. - Body-weight and cystatin C distributions. The virtual cohort draws WT from a truncated normal centred on the published stratum medians (Table 1) and CYSC from a clamped log-normal anchored on the published stratum medians and the observed 0.7-6.2 mg/L range. The original individual covariate values are not published.
-
Sex, age, and Cockcroft-Gault CLcr not used. Viberg
2006 evaluated age, body weight, sex, serum creatinine, CLcr, and
cystatin C as covariates. Only 1/CYSC and WT were retained in the final
model, so the packaged virtual cohort does not need age, sex, or CLcr.
Users building cohorts stratified by Cockcroft-Gault renal function
should derive CYSC from the published equation
GFR = 77.237 * CYSC^-1.2623(Viberg 2006 Methods; Larsson 2004) and pass it to the model directly. -
Infusion duration. Viberg 2006 administered
cefuroxime as an IV injection over 5-15 min. The vignette uses a 10-min
infusion (midpoint of the published window) via the
rate = amt / durcolumn, withdur = 10/60 h. The model parameterisation is duration-insensitive for AUC; Cmax is mildly sensitive (~10-15%) to the chosen infusion length. -
Reference Cmax in the NCA comparison. Cmax at the
end of a 10-min infusion is approximated as
0.85 * dose / V1_typicalto account for the partial central-compartment filling during the infusion. The approximation differs from the simulated Cmax by < 20% across strata; larger discrepancies would warrant investigation. - Population coverage. The packaged model captures the renal-function range (CLcr 6-115 mL/min) and adult body-weight range (35-137 kg) studied in Viberg 2006. Use outside this range (paediatric, morbidly obese, dialysis) is extrapolation.