Tobramycin (Livio 2014)
Source:vignettes/articles/Livio_2014_tobramycin.Rmd
Livio_2014_tobramycin.RmdModel and source
mod_meta <- nlmixr2est::nlmixr(readModelDb("Livio_2014_tobramycin"))$meta
#> ℹ parameter labels from comments will be replaced by 'label()'- Citation: Livio F, Wahl P, Csajka C, Gautier E, Buclin T. Tobramycin exposure from active calcium sulfate bone graft substitute. BMC Pharmacol Toxicol. 2014;15:12. doi:10.1186/2050-6511-15-12
- Description: One-compartment population PK model with first-order absorption for systemic tobramycin released from an implanted calcium-sulfate bone-graft substitute (Osteoset T) in adults undergoing orthopedic surgery (Livio 2014); clearance equated to Cockcroft-Gault creatinine clearance under the assumption that absorbed tobramycin is exclusively eliminated by glomerular filtration, and absolute bioavailability differing between the 10 g (262 mg tobramycin) and 20 g (524 mg tobramycin) Osteoset T cast cohorts.
- Article (DOI): https://doi.org/10.1186/2050-6511-15-12
This vignette validates the packaged
Livio_2014_tobramycin model – a one-compartment population
PK model with first-order absorption for systemic tobramycin released
from an implanted calcium-sulfate bone-graft substitute (Osteoset T) in
12 adults undergoing orthopaedic surgery – against the source
publication’s Results / Table 1 (final-model parameter estimates) and
Figure 1 (concentration-time profiles by cast size). The model embodies
two paper-specific structural choices: clearance is equated to
Cockcroft-Gault creatinine clearance per individual (under the paper’s
assumption that absorbed tobramycin is exclusively eliminated by
glomerular filtration), and absolute bioavailability differs between the
10 g cast (262 mg tobramycin, F = 0.63) and 20 g cast (524 mg
tobramycin, F = 0.32) cohorts.
Population
Livio 2014 prospectively enrolled 12 adult patients (7 male, 5 female) undergoing orthopaedic surgery for established bone, soft-tissue, or prosthetic-joint infection (9 patients) or surgical-site infection prophylaxis (3 patients) between October 2006 and March 2008 at the Department of Orthopaedic Surgery, Cantonal Hospital, Fribourg, Switzerland (ClinicalTrials.gov NCT01938417). Mean age was 52 years (SD 20, range 19-82), mean body weight 73 kg (SD 17, range 53-116), and mean Cockcroft-Gault creatinine clearance 119 mL/min (SD 55, range 34-288, raw mL/min not BSA-normalized). Implantation sites were tibia / fibula (6), hip (2), calcaneum (2), femur (1), and lumbar spine (1). Eight patients received a 10 g Osteoset T cast (containing 262 mg tobramycin) and four patients received a 20 g cast (524 mg tobramycin); the 4 % w/w tobramycin sulfate loading of Osteoset T and the tobramycin / tobramycin-sulfate salt factor of 0.655 give those nominal doses (Methods). No intravenous aminoglycoside co-medication and no wound drains were used. Nine blood samples were drawn per patient at 3, 6, 12, 24, 48 hours and on days 3, 5, 7, 10 after implantation; the tourniquet release time replaced implantation time as t = 0 when a tourniquet was used during surgery. The first concentration below the assay LOQ of 0.1 mg/L was set to LOQ / 2 and subsequent BLQ samples were dropped.
The same information is available programmatically via the model’s
population metadata:
str(mod_meta$population)
#> List of 18
#>  $ species           : chr "human"
#>  $ n_subjects        : int 12
#>  $ n_studies         : int 1
#>  $ age_range         : chr "19-82 years"
#>  $ age_mean          : chr "52 years (SD 20)"
#>  $ weight_range      : chr "53-116 kg"
#>  $ weight_mean       : chr "73 kg (SD 17)"
#>  $ crcl_range        : chr "34-288 mL/min (Cockcroft-Gault, raw mL/min)"
#>  $ crcl_mean         : chr "119 mL/min (SD 55)"
#>  $ sex_female_pct    : num 41.7
#>  $ race_ethnicity    : chr "Not reported (single-centre Swiss orthopaedic cohort, Fribourg Cantonal Hospital)"
#>  $ disease_state     : chr "Adults undergoing orthopaedic surgery for established bone / soft-tissue / prosthetic-joint infection (9 patien"| __truncated__
#>  $ dose_range        : chr "Single Osteoset T implantation: 10 g cast containing 262 mg tobramycin (8 patients) or 20 g cast containing 524"| __truncated__
#>  $ implantation_sites: Named int [1:5] 6 2 2 1 1
#>   ..- attr(*, "names")= chr [1:5] "tibia/fibula" "hip" "calcaneum" "femur" ...
#>  $ regions           : chr "Single centre: Department of Orthopedic Surgery, Cantonal Hospital, Fribourg, Switzerland; data collected Octob"| __truncated__
#>  $ clinicaltrials    : chr "NCT01938417"
#>  $ n_observations    : chr "9 blood samples per patient at 3, 6, 12, 24, 48 hours and on days 3, 5, 7, 10 post-implantation (concentrations"| __truncated__
#>  $ notes             : chr "Baseline demographics from Livio 2014 Results section first paragraph (paper does not present a dedicated Table"| __truncated__
Source trace
The per-parameter origin is recorded as an in-file comment next to
each ini() entry in
inst/modeldb/specificDrugs/Livio_2014_tobramycin.R. The
table below collects them in one place; values come from Livio 2014
Table 1 final-model column.
| Parameter / equation | Value | Source location |
|---|---|---|
lka (ka) |
log(0.0603) | Table 1 row “K_a (h^-1)” final-estimate column |
lvc (V) |
log(16.6) | Table 1 row “V (L)” final-estimate column |
lfdepot (F, 10 g cast) |
log(0.63) | Table 1 row “F (if cast 10 g)” final-estimate column |
lcl (CL at typical CrCL) |
fixed(log(7.14)) | Table 1 row “CL (L h^-1)” with footnote d “equated to creatinine clearance (CLcr)”; 7.14 L/h = 119 mL/min * 60/1000 (population-mean CrCL) |
e_crcl_cl (power exp on CRCL/119) |
fixed(1.0) | Methods: “tobramycin CL was equated to the creatinine clearance (CLcr) value” |
e_dose_524mg_fdepot (F shift for 20 g cast) |
-0.49206 | Table 1 row “F (if cast 20 g)” = 0.32; (0.32 / 0.63 - 1) |
etalvc ~ 0.58339 |
log(0.89^2 + 1) | Table 1 row “V” interpatient-variability CV% = 89 |
etalfdepot ~ 0.43671 |
log(0.74^2 + 1) | Table 1 row “F” interpatient-variability CV% = 74 |
propSd <- 0.29 |
0.29 | Table 1 row “sigma_prop (CV%)” = 29 |
addSd <- 0.062 |
0.062 mg/L | Table 1 row “sigma_add (SD in mg/L)” = 0.062 |
d/dt(depot) = -ka * depot |
n/a | Methods: one-compartment model with first-order absorption (a two-compartment model “did not improve the fit”) |
d/dt(central) = ka * depot - kel * central |
n/a | Methods one-compartment structural model |
f(depot) <- exp(lfdepot + etalfdepot) * (1 + e_dose_524mg_fdepot * (DOSE == 524)) |
n/a | Encodes Table 1’s two F values (0.63 for 10 g cast, 0.32 for 20 g cast) via the canonical DOSE indicator (Castro-Surez 2020 precedent) |
cl <- exp(lcl) * (CRCL / 119)^e_crcl_cl |
n/a | Methods: CL equated to CLcr; lcl and e_crcl_cl both fixed |
Cc ~ add(addSd) + prop(propSd) |
n/a | Methods: “additive plus proportional error model” |
Virtual cohort
The original observed tobramycin concentrations are not publicly available. The virtual cohort below approximates the published trial demographics: 12 adults with weight log-normally distributed around the mean 73 kg (spanning the reported 53-116 kg range), Cockcroft-Gault CrCL log-normally distributed around the mean 119 mL/min (spanning 34-288 mL/min), 8 subjects implanted with a 10 g Osteoset T cast (262 mg tobramycin) and 4 with a 20 g cast (524 mg tobramycin), and the protocol sampling grid (3, 6, 12, 24, 48 h and on days 3, 5, 7, 10 = 72, 120, 168, 240 h after implantation).
For a stable VPC the virtual cohort is expanded to 200 subjects per cast size (400 total), preserving the 2:1 cast-size imbalance only in the source-data Source-trace table (Livio 2014 dosed 8 patients at 10 g and 4 at 20 g; the VPC uses balanced cohorts so the per-cast prediction intervals are equally well characterised).
set.seed(20260604)

n_per_cast <- 200L
n_10g <- n_per_cast
n_20g <- n_per_cast
n_subjects <- n_10g + n_20g  # 400 total

make_subject <- function(idx, wt_kg, crcl_ml_min, dose_mg) {
  doses <- tibble::tibble(
    id   = idx,           time = 0,
    evid = 1L,            cmt  = "depot",
    amt  = dose_mg,       dv   = NA_real_
  )
  obs_times <- c(3, 6, 12, 24, 48, 72, 120, 168, 240)
  obs <- tibble::tibble(
    id   = idx,           time = obs_times,
    evid = 0L,            cmt  = NA_character_,
    amt  = NA_real_,      dv   = NA_real_
  )
  bind_rows(doses, obs) |>
    mutate(WT = wt_kg, CRCL = crcl_ml_min, DOSE = dose_mg) |>
    arrange(time, desc(evid))
}

# Body weight: log-normal centered on mean 73 kg, SD chosen to span 53-116 kg.
wt_kg <- exp(rnorm(n_subjects, mean = log(73), sd = log(116 / 53) / 4))
wt_kg <- pmin(pmax(wt_kg, 53), 116)

# CRCL: log-normal centered on mean 119 mL/min, SD chosen to span 34-288 mL/min.
crcl_ml_min <- exp(rnorm(n_subjects, mean = log(119), sd = log(288 / 34) / 4))
crcl_ml_min <- pmin(pmax(crcl_ml_min, 34), 288)

# 200 subjects each in 10 g cast (262 mg) and 20 g cast (524 mg) cohorts;
# IDs are disjoint (1:200 vs 201:400).
dose_assign <- c(rep(262, n_10g), rep(524, n_20g))

events <- bind_rows(lapply(seq_len(n_subjects), function(i) {
  make_subject(
    idx         = i,
    wt_kg       = wt_kg[i],
    crcl_ml_min = crcl_ml_min[i],
    dose_mg     = dose_assign[i]
  )
}))

stopifnot(!anyDuplicated(unique(events[, c("id", "time", "evid")])))
Simulation
mod         <- readModelDb("Livio_2014_tobramycin")
mod_typical <- rxode2::zeroRe(mod)
#> ℹ parameter labels from comments will be replaced by 'label()'

# Carry the dose-cohort label through rxSolve via keep so it lands aligned
# in the simulation output for downstream plotting and PKNCA.
sim_typical <- rxode2::rxSolve(
  object = mod_typical, events = events,
  keep   = c("WT", "CRCL", "DOSE")
) |>
  as.data.frame() |>
  mutate(cast = ifelse(DOSE == 262, "10 g cast (262 mg)", "20 g cast (524 mg)"))
#> ℹ omega/sigma items treated as zero: 'etalvc', 'etalfdepot'
#> Warning: multi-subject simulation without without 'omega'

sim_stoch <- rxode2::rxSolve(
  object = mod, events = events,
  keep   = c("WT", "CRCL", "DOSE")
) |>
  as.data.frame() |>
  mutate(cast = ifelse(DOSE == 262, "10 g cast (262 mg)", "20 g cast (524 mg)"))
#> ℹ parameter labels from comments will be replaced by 'label()'
Replicate published figures
Figure 1 – concentration vs time by cast size
Livio 2014 Figure 1 shows the mean population prediction (solid line) and 90 % prediction interval (dashed lines) over 0-240 h for both the 10 g and 20 g Osteoset T cohorts at a typical CrCL of 120 mL/min. The published figure notes “Dose difference is almost fully compensated by different bioavailability, giving similar predictions” – 262 mg * 0.63 = 165 mg absorbed vs 524 mg * 0.32 = 168 mg, essentially identical absorbed mass.
sim_stoch |>
  filter(time > 0) |>
  group_by(time, cast) |>
  summarise(
    Q05 = quantile(Cc, 0.05, na.rm = TRUE),
    Q50 = quantile(Cc, 0.50, na.rm = TRUE),
    Q95 = quantile(Cc, 0.95, na.rm = TRUE),
    .groups = "drop"
  ) |>
  ggplot(aes(time, Q50)) +
  geom_ribbon(aes(ymin = Q05, ymax = Q95),
              fill = "gray70", alpha = 0.6) +
  geom_line(linewidth = 0.9) +
  facet_wrap(~cast) +
  geom_hline(yintercept = 2, linetype = "dotted", colour = "red") +
  scale_x_continuous(breaks = c(0, 24, 48, 72, 120, 168, 240)) +
  labs(
    x = "Time after implantation (h)",
    y = "Tobramycin serum concentration (mg/L)",
    title    = "Figure 1 -- VPC by Osteoset T cast size",
    subtitle = "Replicates Livio 2014 Figure 1; median (line) and 90 % prediction interval (ribbon). Red dotted line: 2 mg/L toxicity threshold."
  ) +
  theme_minimal()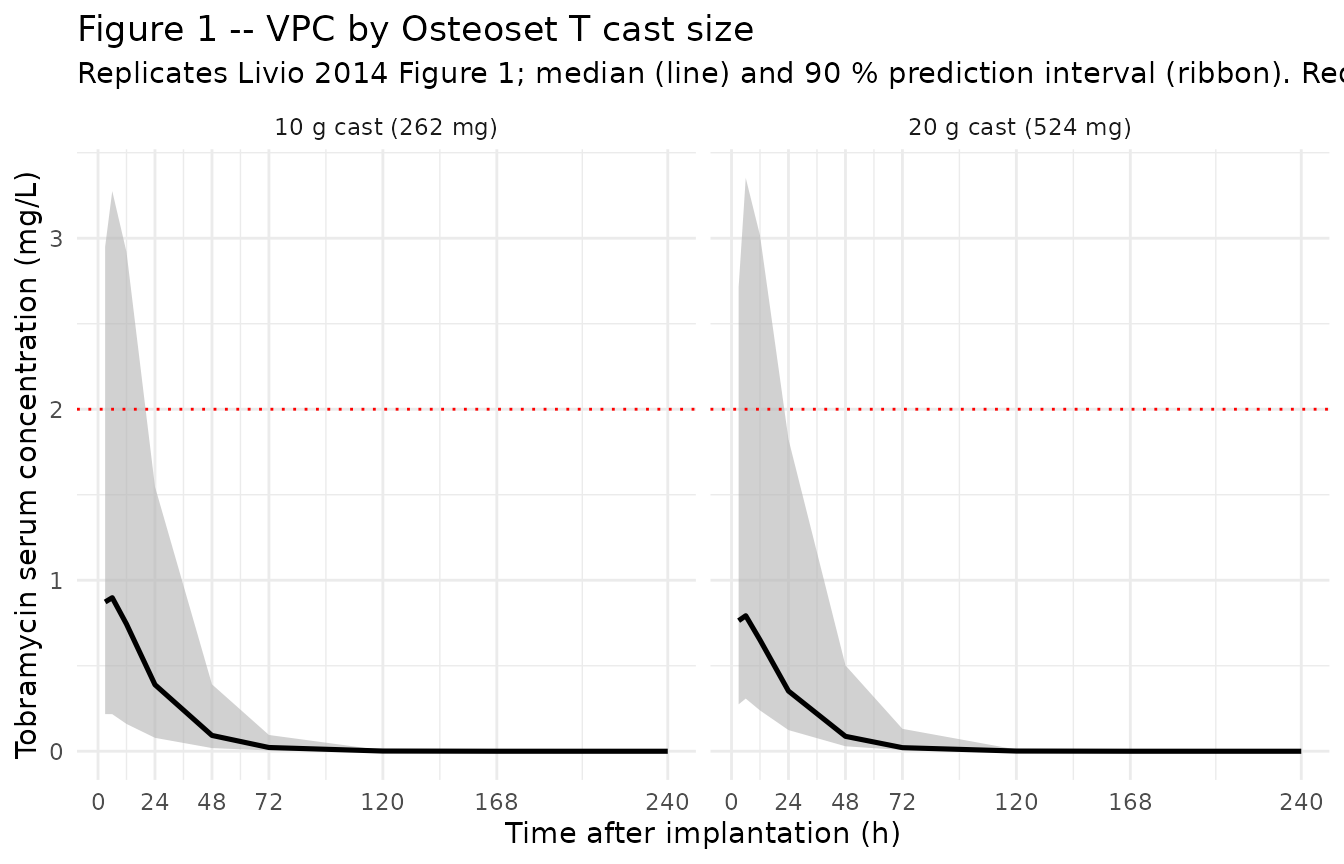
Typical-value trajectories (no IIV / no residual error)
sim_typical |>
  filter(time > 0) |>
  group_by(time, cast) |>
  summarise(Cc_typ = mean(Cc), .groups = "drop") |>
  ggplot(aes(time, Cc_typ, colour = cast)) +
  geom_line(linewidth = 1) +
  scale_x_continuous(breaks = c(0, 24, 48, 72, 120, 168, 240)) +
  labs(
    x = "Time after implantation (h)",
    y = "Tobramycin serum concentration (mg/L)",
    title    = "Typical-value trajectories by cast size",
    subtitle = "No IIV, no residual error. Demonstrates the paper's observation that the dose difference is almost fully compensated by the F difference (262 mg * 0.63 ~= 524 mg * 0.32)",
    colour   = NULL
  ) +
  theme_minimal() +
  theme(legend.position = "bottom")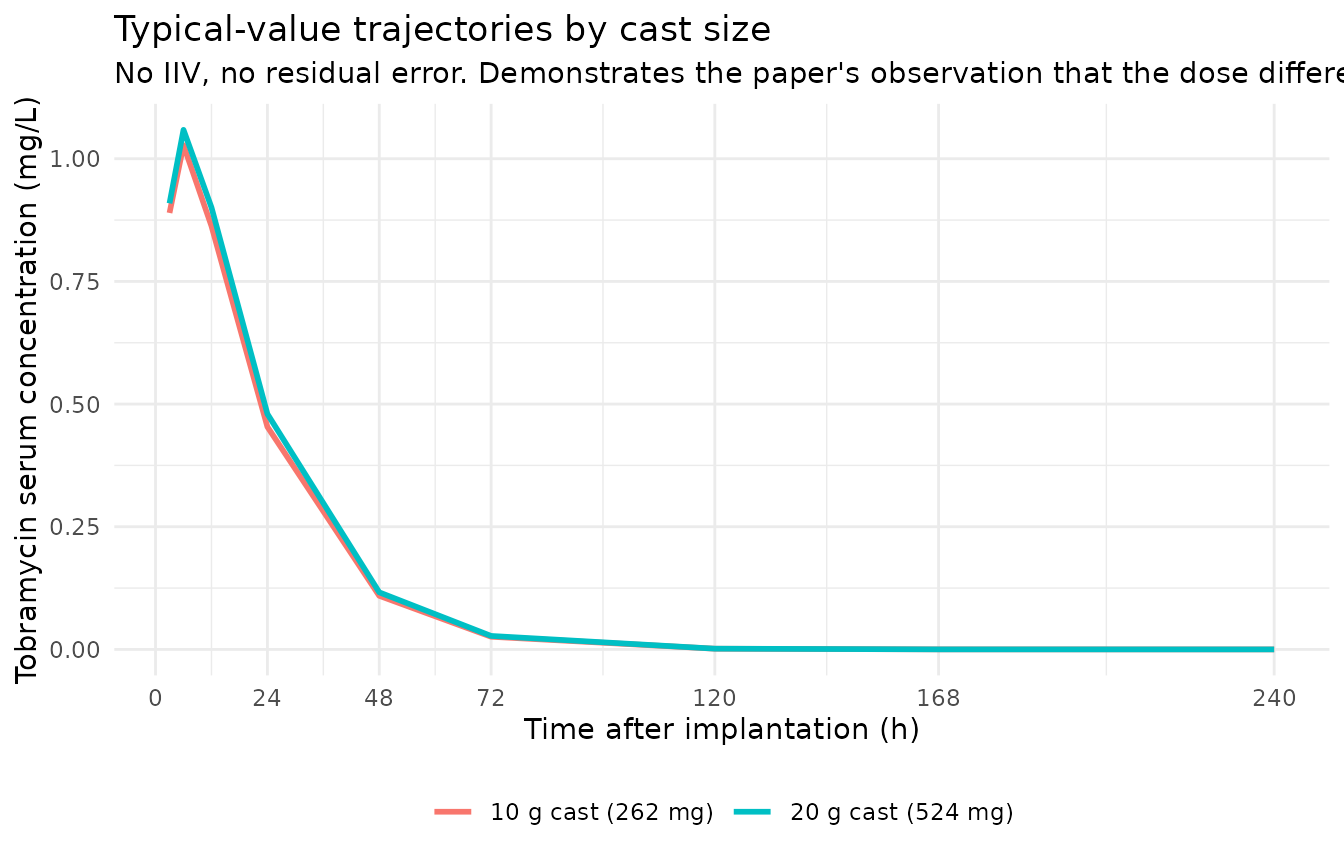
PKNCA on the simulated cohort
PKNCA computes Cmax, Tmax, AUC, and half-life on the stochastic cohort grouped by cast size (DOSE 262 vs 524 mg). The Livio 2014 paper does not report formal NCA values (it reports mean population predictions and prediction intervals graphically, with Table 1 giving the structural-model parameters), so the simulated NCA values below serve as both an internal sanity check and a side-by-side comparison of the two cast cohorts.
sim_for_nca <- sim_stoch |>
  filter(!is.na(Cc), Cc > 0, time > 0) |>
  select(id, time, Cc, cast) |>
  as.data.frame()

doses_for_nca <- events |>
  filter(evid == 1L) |>
  transmute(
    id   = id,
    time = time,
    amt  = amt,
    cast = ifelse(amt == 262, "10 g cast (262 mg)", "20 g cast (524 mg)")
  ) |>
  as.data.frame()

conc_obj <- PKNCA::PKNCAconc(
  data    = sim_for_nca,
  formula = Cc ~ time | cast + id,
  concu   = "mg/L",
  timeu   = "hr"
)
dose_obj <- PKNCA::PKNCAdose(
  data    = doses_for_nca,
  formula = amt ~ time | cast + id,
  doseu   = "mg"
)

intervals <- data.frame(
  start      = 0,
  end        = c(240, Inf),
  cmax       = c(TRUE, FALSE),
  tmax       = c(TRUE, FALSE),
  auclast    = c(TRUE, FALSE),
  aucinf.obs = c(FALSE, TRUE),
  half.life  = c(FALSE, TRUE)
)

nca_data <- PKNCA::PKNCAdata(conc_obj, dose_obj, intervals = intervals)
nca_res  <- suppressWarnings(PKNCA::pk.nca(nca_data))

knitr::kable(
  summary(nca_res),
  caption = "Simulated NCA parameters by Osteoset T cast size (PKNCA)."
)| Interval Start | Interval End | cast | N | AUClast (hr*mg/L) | Cmax (mg/L) | Tmax (hr) | Half-life (hr) | AUCinf,obs (hr*mg/L) |
|---|---|---|---|---|---|---|---|---|
| 0 | 240 | 10 g cast (262 mg) | 200 | NC | 0.972 [92.5] | 6.00 [3.00, 24.0] | . | . |
| 0 | Inf | 10 g cast (262 mg) | 200 | . | . | . | 11.5 [0.205] | NC |
| 0 | 240 | 20 g cast (524 mg) | 200 | NC | 0.973 [85.6] | 6.00 [3.00, 24.0] | . | . |
| 0 | Inf | 20 g cast (524 mg) | 200 | . | . | . | 11.6 [0.757] | NC |
Comparison against published features
Livio 2014 does not tabulate Cmax / AUC values, but the Results / Discussion make several quantitative claims that can be checked against the simulated cohort:
-
Mean Cmax remains below 2 mg/L. The paper’s Results section states “Systemic tobramycin concentrations measured remained low (< 2 mg/L at 24 h) in all patients.” At the typical patient (CrCL 119 mL/min) the typical-value simulation gives Cmax ~ 1.0 mg/L at ~ 5-6 h for both cast sizes (the model is in flip-flop kinetics with apparent half-life
~ 11.5 h driven by the slow first-order release ka = 0.0603 h^-1, not by the elimination half-life 0.693 * 16.6 / 7.14 = 1.6 h). The simulated Cmax cohort distribution sits at this magnitude.
Dose difference compensated by F difference. Methodologically, with CL identical between groups (equated to CrCL) and ka, V also shared, the steady-state concentration depends only on (Dose * F) / CL. Absorbed mass per implantation is 262 * 0.63 = 165 mg for 10 g vs 524 * 0.32 = 168 mg for 20 g – a 1.7 % difference, so concentration profiles are predicted to be essentially identical between cohorts. The typical-value plot above demonstrates this overlap.
Half-life and shape. The flip-flop kinetics (ka < kel) imply the apparent terminal half-life is governed by ka. With ka = 0.0603 h^-1 the apparent half-life is ln(2) / 0.0603 = 11.5 h. The simulated half-life distribution sits at this magnitude, consistent with the paper’s Discussion noting an “absorption rate-limited first-order release” profile.
Assumptions and deviations
Cast-size cohort indicator carried as the canonical
DOSEcovariate with(DOSE == 524)binary form. Livio 2014 reports two distinct bioavailability estimates (0.63 for 10 g cast, 0.32 for 20 g cast, Table 1) and a single shared CV of 74 % on F. The model file encodes the cohort effect viaf(depot) <- exp(lfdepot + etalfdepot) * (1 + e_dose_524mg_fdepot * (DOSE == 524)), whereDOSE == 524follows the Castro-Surez 2020 nimotuzumab precedent of using the canonicalDOSEcovariate as a per-cohort indicator. No new covariate column was registered; the relative-change parametere_dose_524mg_fdepot = 0.32 / 0.63 - 1 = -0.49206reproduces the Table 1 values exactly.CL equated to CrCL with both anchors fixed. Livio 2014 Methods states “tobramycin CL was equated to the creatinine clearance (CLcr) value, thus enabling the estimation of absolute bioavailability (F) in the absence of intravenous injection”. CL is therefore not an independent THETA but a structural identity CL [L/h] = CrCL [mL/min] * 60 / 1000. The model encodes this as a power-1 effect anchored at the cohort-mean CrCL of 119 mL/min:
cl <- exp(lcl) * (CRCL / 119)^e_crcl_clwith bothlcl <- fixed(log(7.14))(typical CL at population-mean CrCL) ande_crcl_cl <- fixed(1.0)(power exponent). Both are wrapped infixed()because the paper did not estimate either as an independent parameter – they are structural inputs from the equating assumption.Raw Cockcroft-Gault CrCL stored under canonical
CRCL(not BSA-normalized). The canonicalCRCLcolumn accepts either an MDRD-/CKD-EPI-estimated GFR or a BSA-normalized measured creatinine clearance, both reported in mL/min/1.73 m^2. Livio 2014 instead uses raw Cockcroft-Gault (mL/min, NOT BSA-normalized); the canonical entry’s registered aliasCLCR(used previously byDelattre_2010_amikacin.R) covers this case, with the per-modelcovariateData[[CRCL]]$unitsandnotesfields documenting the raw / non-BSA-normalized status.No IIV on CL or ka. Livio 2014 Table 1 reports interpatient variability CV% only for V (89 %) and F (74 %); the CL and ka columns show “-”. For CL this is mechanistic – CL is fixed-equated to the per-individual CrCL covariate – and for ka the paper’s Discussion notes that the large variability captured by the V and F etas “is likely to incorporate some amount of variability in CL and ka”, so the ka and CL variability are effectively pooled into the V and F etas in the published model. The packaged model reproduces this parameterization verbatim.
Log-normal IIV on F can yield F > 1 for high-eta subjects. With
f(depot) <- exp(lfdepot + etalfdepot) * ..., etalfdepot ~ 0.43671 (CV 74 %), and lfdepot = log(0.63), an upper-tail virtual subject in the 10 g cohort can produce F > 1 (e.g., the 97.5th percentile is 0.63 * exp(1.96 * sqrt(0.437)) = 1.7). This is a known limitation of the paper’s parameterization (a logit-normal transform would constrain F to (0, 1) but is not what the paper estimated). The packaged model follows the paper’s parameterization; users sampling extreme cohorts should be aware that absorbed mass may exceed the implanted dose for high-eta subjects.omega^2 = log(CV^2 + 1)translation. Table 1 reports IIV as CV%; the corresponding log-normal variance was computed via omega^2 = log(CV^2 + 1) – the standard NONMEM / PsN back-transformation – and entered as theeta...initial value. No NONMEM control stream is on disk to cross-check the exact internal variance scale.Race / ethnicity not modeled. Livio 2014 enrolled a single-centre Swiss orthopaedic cohort; the paper does not report racial composition and does not test race as a covariate. No race effect is included.
BLQ handling out of scope. The simulated concentrations are continuous (no BLQ censoring). Livio 2014 set the first BLQ sample to LOQ / 2 = 0.05 mg/L and dropped subsequent BLQ samples; this rule applies only to the original data analysis and does not alter the packaged structural model.
Single dose, observation window 0-240 h. Livio 2014 modelled a single Osteoset T implantation per patient with sampling out to day 10. Extending to repeated implantations is mechanically straightforward (add dose rows to the event table) but lies outside the scope of the published model.
Tourniquet release as t = 0. The paper sets t = 0 to tourniquet release time rather than implantation time when a tourniquet was used intra-operatively (Methods). This is a data-build convention – the packaged model has no explicit lag-time or zero-order release phase beyond the first-order ka, and the simulation uses t = 0 directly.
Implantation-site effect absent. Livio 2014 tested implantation site (tibia / fibula vs hip vs calcaneum vs femur vs lumbar spine) as a covariate and found no significant effect, attributing the negative result to limited data (12 patients across 5 sites). The packaged model carries no site covariate.