Ceftazidime and imipenem in AECOPD (Nguyen 2021)
Source:vignettes/articles/Nguyen_2021_ceftazidime_imipenem.Rmd
Nguyen_2021_ceftazidime_imipenem.RmdModel and source
- Citation: Nguyen TM, Ngo TH, Truong AQ, Vu DH, Le DC, Vu NB, Can TN, Nguyen HA, Phan TP, Van Bambeke F, Vidaillac C, Ngo QC. Population pharmacokinetics and dose optimization of ceftazidime and imipenem in patients with acute exacerbations of chronic obstructive pulmonary disease. Pharmaceutics. 2021;13(4):456. doi:10.3390/pharmaceutics13040456.
- Description (ceftazidime): One-compartment IV population PK model for ceftazidime in 50 Vietnamese adults hospitalised for acute exacerbations of chronic obstructive pulmonary disease (Nguyen 2021). Clearance scales as a power of Cockcroft-Gault creatinine clearance (reference 69.02 mL/min, the observation-weighted cohort mean), the only covariate retained; the volume of distribution carries no covariate. Inter-individual variability is exponential on clearance and volume, and residual error is proportional. Fitted in Monolix alongside a separate imipenem model from the same study (Nguyen_2021_imipenem).
- Description (imipenem): One-compartment IV population PK model for imipenem in 44 Vietnamese adults hospitalised for acute exacerbations of chronic obstructive pulmonary disease (Nguyen 2021). Clearance scales as a power of Cockcroft-Gault creatinine clearance (reference 75.54 mL/min, the observation-weighted cohort mean), the only covariate retained; the volume of distribution carries no covariate. Inter-individual variability is exponential on clearance and volume, and residual error is proportional. Fitted in Monolix alongside a separate ceftazidime model from the same study (Nguyen_2021_ceftazidime).
- Article: https://doi.org/10.3390/pharmaceutics13040456
- Supplement (Tables S1-S4, Figures S1-S4): https://www.mdpi.com/1999-4923/13/4/456/s1
Nguyen 2021 is a prospective, sparsely sampled population PK study of two anti-pseudomonal beta-lactams in patients hospitalised for acute exacerbations of chronic obstructive pulmonary disease (AECOPD) at Bach Mai Hospital, Hanoi. The two drugs were given to different patients (50 on ceftazidime, 44 on imipenem) and were modelled separately in Monolix 2019R1, so the paper contributes two independent model files that share this one article:
Nguyen_2021_ceftazidimeNguyen_2021_imipenem
Both final models are one-compartment with first-order elimination, exponential inter-individual variability on clearance and volume, proportional residual error, and a power effect of Cockcroft-Gault creatinine clearance on clearance. The paper then uses the models for a Monte Carlo probability-of-target-attainment (PTA) analysis, which is reproduced below.
The imipenem model was first added to this package from the Zhang 2025 imipenem systematic review (see the Zhang 2025 review article); it has since been re-verified against this primary publication, and every value now traces to Nguyen 2021 directly.
Population
| Characteristic | Ceftazidime | Imipenem |
|---|---|---|
| Patients (samples) | 50 (97) | 44 (84) |
| Age, years | 69 (63-77) | 65 (60-72) |
| Male, n (%) | 47 (94) | 41 (93) |
| Total body weight, kg | 51 (47-57) | 50 (47-55) |
| Fat-free mass, kg | 45 (41-47) | 43 (40-46) |
| Body mass index, kg/m^2 | 19.49 (17.55-21.44) | 19.51 (18.22-19.51) |
| CLcr (Cockcroft-Gault), mL/min | 62.9 (49.0-76.8) | 76.6 (57.5-96.6) |
| Respiratory distress, n (%) | 17 (34) | 29 (66) |
| Invasive ventilation, n (%) | 7 (14) | 13 (30) |
| Most common regimen | 1 g q8h (78%) | 1 g q8h (55%) |
All patients met the GOLD 2020 definition of an acute exacerbation
and received the study antibiotic for at least three consecutive days;
none required intensive care. The cohort is small-bodied (median weight
about 50 kg) and almost entirely male. Two plasma samples were drawn per
patient, one at least 30 min after the end of the third infusion and one
1-2 h before the fourth dose. Infusion durations varied between patients
(Supplementary Figure S1). The same information is available
programmatically from each model’s population metadata, for
example
readModelDb("Nguyen_2021_ceftazidime")()$population.
Source trace
The per-parameter origin is also recorded as an in-file comment next
to each ini() entry in
inst/modeldb/specificDrugs/Nguyen_2021_ceftazidime.R and
inst/modeldb/specificDrugs/Nguyen_2021_imipenem.R.
| Equation / parameter | Ceftazidime | Imipenem | Source location |
|---|---|---|---|
lcl (CL at reference CLcr, L/h) |
log(8.74) |
log(7.88) |
Table 2; Results 3.3 |
lvc (V, L) |
log(23.7) |
log(15.1) |
Table 2; Results 3.3 |
e_crcl_cl (power exponent on CLcr) |
0.485 |
0.532 |
Table 2 row ‘beta CLCRCG on CL’; Results 3.3 equations |
| CLcr reference (mL/min) | 69.02 |
75.54 |
Results 3.3 equations; centring rule in Methods 2.3, Eq. 2 |
etalcl (variance) |
0.208^2 |
0.294^2 |
Table 2 ‘omega CL (%)’; omega defined as the SD of eta in Methods 2.3 |
etalvc (variance) |
0.13^2 |
0.107^2 |
Table 2 ‘omega V (%)’; as above |
propSd |
0.121 |
0.233 |
Table 2 ‘b (%)’; proportional error selected in Table S1 |
cl <- exp(lcl + etalcl) * (CRCL/ref)^e_crcl_cl |
Methods 2.3 Eq. 1 and 2; Results 3.3 | ||
d/dt(central) <- -kel * central,
Cc <- central / vc
|
Methods 2.3 (one compartment, first-order elimination); Table S1 |
Typical-value checks
A deterministic typical-value solve is compared with the published
parameters: for a single 1 g dose infused over 0.5 h, dose / AUC(0-inf)
must return the clearance of the covariate equation, and the terminal
half-life must equal log(2) * V / CL. The check is run at
the reference creatinine clearance and across a grid, so it also
confirms the power-covariate algebra.
caz <- readModelDb("Nguyen_2021_ceftazidime")
imi <- readModelDb("Nguyen_2021_imipenem")
mods <- list(ceftazidime = caz, imipenem = imi)

pub <- tibble::tribble(
  ~drug,         ~cl_ref, ~v,   ~crcl_ref, ~beta,
  "ceftazidime", 8.74,    23.7, 69.02,     0.485,
  "imipenem",    7.88,    15.1, 75.54,     0.532
)

crcl_grid <- c(30, 60, 90, 120)
typ_grid <- tidyr::crossing(pub, CRCL = c(crcl_grid, 69.02, 75.54)) |>
  dplyr::filter(!(drug == "ceftazidime" & CRCL == 75.54),
                !(drug == "imipenem" & CRCL == 69.02)) |>
  dplyr::mutate(
    id = dplyr::row_number(),
    treatment = sprintf("%s, CLcr %.2f", drug, CRCL),
    cl_expected = cl_ref * (CRCL / crcl_ref)^beta
  )

# A zeroRe() model solved for several subjects makes rxode2 warn about a
# multi-subject simulation without omega. That is intended here, so only
# that warning is muffled and any other warning still surfaces.
muffle_no_omega <- function(w) {
  if (grepl("without 'omega'", conditionMessage(w), fixed = TRUE)) {
    invokeRestart("muffleWarning")
  }
}

obs_times <- sort(unique(c(seq(0, 2, by = 0.05), seq(2, 48, by = 0.25))))

typ_events <- function(row) {
  dplyr::bind_rows(
    data.frame(id = row$id, time = 0, amt = 1000, rate = 2000, evid = 1L),
    data.frame(id = row$id, time = obs_times, amt = NA_real_, rate = NA_real_,
               evid = 0L)
  ) |>
    dplyr::mutate(cmt = "central", CRCL = row$CRCL, treatment = row$treatment)
}

typ_sim <- lapply(split(typ_grid, typ_grid$drug), function(g) {
  ev <- dplyr::bind_rows(lapply(seq_len(nrow(g)), function(i) typ_events(g[i, ])))
  withCallingHandlers(
    rxode2::rxSolve(rxode2::zeroRe(mods[[g$drug[1]]]), events = ev,
                    keep = "treatment", rtol = 1e-10, atol = 1e-12,
                    returnType = "data.frame"),
    warning = muffle_no_omega
  )
}) |>
  dplyr::bind_rows()
#> ℹ parameter labels from comments will be replaced by 'label()'
#> ℹ omega/sigma items treated as zero: 'etalcl', 'etalvc'
#> ℹ parameter labels from comments will be replaced by 'label()'
#> ℹ omega/sigma items treated as zero: 'etalcl', 'etalvc'

conc_typ <- typ_sim |>
  dplyr::filter(!is.na(Cc)) |>
  dplyr::mutate(Cc = pmax(Cc, 0)) |>
  dplyr::group_by(id) |>
  dplyr::filter(time <= time[which.max(Cc)] | Cc >= 1e-6 * max(Cc)) |>
  dplyr::ungroup() |>
  dplyr::select(id, time, Cc, treatment)
dose_typ <- typ_grid |>
  dplyr::transmute(id, time = 0, amt = 1000, treatment)

nca_typ <- PKNCA::pk.nca(PKNCA::PKNCAdata(
  PKNCA::PKNCAconc(conc_typ, Cc ~ time | treatment + id),
  PKNCA::PKNCAdose(dose_typ, amt ~ time | treatment + id),
  intervals = data.frame(start = 0, end = Inf, aucinf.obs = TRUE,
                         half.life = TRUE)
))

typ_chk <- as.data.frame(nca_typ$result) |>
  dplyr::filter(PPTESTCD %in% c("aucinf.obs", "half.life")) |>
  dplyr::select(treatment, PPTESTCD, PPORRES) |>
  tidyr::pivot_wider(names_from = PPTESTCD, values_from = PPORRES) |>
  dplyr::left_join(typ_grid, by = "treatment") |>
  dplyr::mutate(
    cl_sim = 1000 / aucinf.obs,
    thalf_expected = log(2) * v / cl_expected,
    cl_rel_err = cl_sim / cl_expected - 1,
    thalf_rel_err = half.life / thalf_expected - 1
  )

typ_chk |>
  dplyr::select(treatment, cl_expected, cl_sim, thalf_expected, half.life) |>
  dplyr::rename(
    "Drug, CLcr (mL/min)" = treatment,
    "CL, published equation (L/h)" = cl_expected,
    "CL = dose / AUCinf (L/h)" = cl_sim,
    "t1/2 = log(2) V / CL (h)" = thalf_expected,
    "t1/2, PKNCA (h)" = half.life
  ) |>
knitr::kable(digits = 3, caption = "Typical-value clearance and half-life recovered from the solved profiles.")| Drug, CLcr (mL/min) | CL, published equation (L/h) | CL = dose / AUCinf (L/h) | t1/2 = log(2) V / CL (h) | t1/2, PKNCA (h) |
|---|---|---|---|---|
| ceftazidime, CLcr 120.00 | 11.429 | 11.430 | 1.437 | 1.437 |
| ceftazidime, CLcr 30.00 | 5.835 | 5.835 | 2.816 | 2.816 |
| ceftazidime, CLcr 60.00 | 8.166 | 8.166 | 2.012 | 2.012 |
| ceftazidime, CLcr 69.02 | 8.740 | 8.740 | 1.880 | 1.880 |
| ceftazidime, CLcr 90.00 | 9.941 | 9.941 | 1.653 | 1.653 |
| imipenem, CLcr 120.00 | 10.080 | 10.081 | 1.038 | 1.038 |
| imipenem, CLcr 30.00 | 4.821 | 4.821 | 2.171 | 2.171 |
| imipenem, CLcr 60.00 | 6.971 | 6.972 | 1.501 | 1.501 |
| imipenem, CLcr 75.54 | 7.880 | 7.880 | 1.328 | 1.328 |
| imipenem, CLcr 90.00 | 8.650 | 8.650 | 1.210 | 1.210 |
# Both sides use the same typical parameters, so the only difference is
# numerical (ODE tolerance, trapezoid rule and the log-linear tail
# extrapolation), and a tight bound is appropriate.
stopifnot(
  nrow(typ_chk) == 10,
  max(abs(typ_chk$cl_rel_err)) < 2e-3,
  max(abs(typ_chk$thalf_rel_err)) < 2e-3
)
Virtual cohorts
For each drug, 200 virtual patients are drawn with base R, so the
cohort is identical on every machine. Cockcroft-Gault creatinine
clearance is log-normal with the Table 1 median and a log-scale SD taken
from the interquartile range. The random effects are drawn from the
published omegas and passed to the typical-value model as data columns
(etalcl, etalvc), so the simulation below does
not depend on rxode2’s random number stream.
set.seed(20210327)
n_per_drug <- 200L
cohort_spec <- tibble::tribble(
  ~drug,         ~crcl_med, ~crcl_q1, ~crcl_q3, ~om_cl, ~om_v, ~prop_sd,
  "ceftazidime", 62.9,      49.0,     76.8,     0.208,  0.13,  0.121,
  "imipenem",    76.6,      57.5,     96.6,     0.294,  0.107, 0.233
)

draw_cohort <- function(spec, n, id_offset) {
  sdlog <- (log(spec$crcl_q3) - log(spec$crcl_q1)) / (2 * qnorm(0.75))
  tibble::tibble(
    id = id_offset + seq_len(n),
    drug = spec$drug,
    CRCL = exp(rnorm(n, log(spec$crcl_med), sdlog)),
    etalcl = rnorm(n, 0, spec$om_cl),
    etalvc = rnorm(n, 0, spec$om_v)
  )
}
cohort <- dplyr::bind_rows(
  draw_cohort(cohort_spec[1, ], n_per_drug, 0L),
  draw_cohort(cohort_spec[2, ], n_per_drug, n_per_drug)
)
stopifnot(!anyDuplicated(cohort$id))
cohort |>
  dplyr::group_by(drug) |>
  dplyr::summarise(
    `CLcr median` = median(CRCL),
    `CLcr Q1` = quantile(CRCL, 0.25),
    `CLcr Q3` = quantile(CRCL, 0.75),
    .groups = "drop"
  ) |>
knitr::kable(digits = 1, caption = "Virtual-cohort creatinine clearance (mL/min); compare Table 1.")| drug | CLcr median | CLcr Q1 | CLcr Q3 |
|---|---|---|---|
| ceftazidime | 59.6 | 47.6 | 72.7 |
| imipenem | 79.7 | 62.3 | 101.4 |
Simulation
Every patient receives the most common study regimen, 1 g every 8 h, here as a 0.5 h infusion, for nine doses. The window after the third dose (16-24 h) corresponds to the study’s sampling window; the last interval (64-72 h) is used for the steady-state NCA.
ss_times <- seq(0, 72, by = 0.1)
make_ss_events <- function(coh) {
  doses <- tidyr::crossing(coh, time = seq(0, 64, by = 8)) |>
    dplyr::mutate(amt = 1000, rate = 2000, evid = 1L)
  obs <- tidyr::crossing(coh, time = ss_times) |>
    dplyr::mutate(amt = NA_real_, rate = NA_real_, evid = 0L)
  dplyr::bind_rows(doses, obs) |>
    dplyr::mutate(cmt = "central") |>
    dplyr::arrange(id, time, dplyr::desc(evid))
}

# zeroRe() plus eta columns in the data: rxode2 uses the per-subject etas
# supplied as data (the omegas are treated as zero).
solve_with_etas <- function(mod, ev, ...) {
  withCallingHandlers(
    suppressMessages(rxode2::rxSolve(
      rxode2::zeroRe(mod), events = ev,
      rtol = 1e-8, atol = 1e-10, returnType = "data.frame", ...
    )),
    warning = muffle_no_omega
  )
}

sim_drug <- function(d) {
  ev <- make_ss_events(dplyr::filter(cohort, drug == d))
  solve_with_etas(mods[[d]], ev, keep = "drug")
}
sim <- dplyr::bind_rows(lapply(c("ceftazidime", "imipenem"), sim_drug))

# The supplied etas must actually reach the individual parameters. This is
# a same-parameter identity (numerical error only), so the bound is tight.
cl_check <- sim |>
  dplyr::distinct(id, drug, cl, vc) |>
  dplyr::left_join(cohort, by = c("id", "drug")) |>
  dplyr::left_join(pub, by = "drug") |>
  dplyr::mutate(
    cl_expected = cl_ref * exp(etalcl) * (CRCL / crcl_ref)^beta,
    v_expected = v * exp(etalvc)
  )
stopifnot(
  nrow(cl_check) == 2 * n_per_drug,
  max(abs(cl_check$cl / cl_check$cl_expected - 1)) < 1e-8,
  max(abs(cl_check$vc / cl_check$v_expected - 1)) < 1e-8,
  sd(log(cl_check$cl)) > 0.1
)
Individual clearance versus creatinine clearance (Figure 1)
Figure 1 of the paper regresses the log10 of each patient’s empirical Bayes clearance on the log10 of creatinine clearance and prints the fitted slopes, 0.4893 for ceftazidime and 0.5321 for imipenem. They are close to the model’s covariate exponents (0.485 and 0.532), as expected when the clearance random effect is independent of creatinine clearance. The same regression on the virtual cohort recovers the exponent to within its sampling error.
fig1_pub <- tibble::tibble(drug = c("ceftazidime", "imipenem"),
                           slope_pub = c(0.4893, 0.5321))
fig1_fit <- cl_check |>
  dplyr::group_by(drug) |>
  dplyr::summarise(
    slope_sim = unname(coef(lm(log10(cl) ~ log10(CRCL)))[2]),
    .groups = "drop"
  ) |>
  dplyr::left_join(fig1_pub, by = "drug")
fig1_fit |>
  dplyr::rename("Drug" = drug, "Slope, virtual cohort" = slope_sim,
                "Slope, Figure 1" = slope_pub) |>
knitr::kable(digits = 3)| Drug | Slope, virtual cohort | Slope, Figure 1 |
|---|---|---|
| ceftazidime | 0.489 | 0.489 |
| imipenem | 0.506 | 0.532 |
ggplot(cl_check, aes(log10(CRCL), log10(cl))) +
  geom_point(alpha = 0.4, colour = "#1f77b4") +
  geom_smooth(method = "lm", formula = y ~ x, colour = "black") +
  facet_wrap(~drug, scales = "free") +
  labs(x = "log10 creatinine clearance (mL/min)", y = "log10 clearance (L/h)",
       caption = "Replicates the layout of Figure 1 of Nguyen 2021 with the virtual cohort.")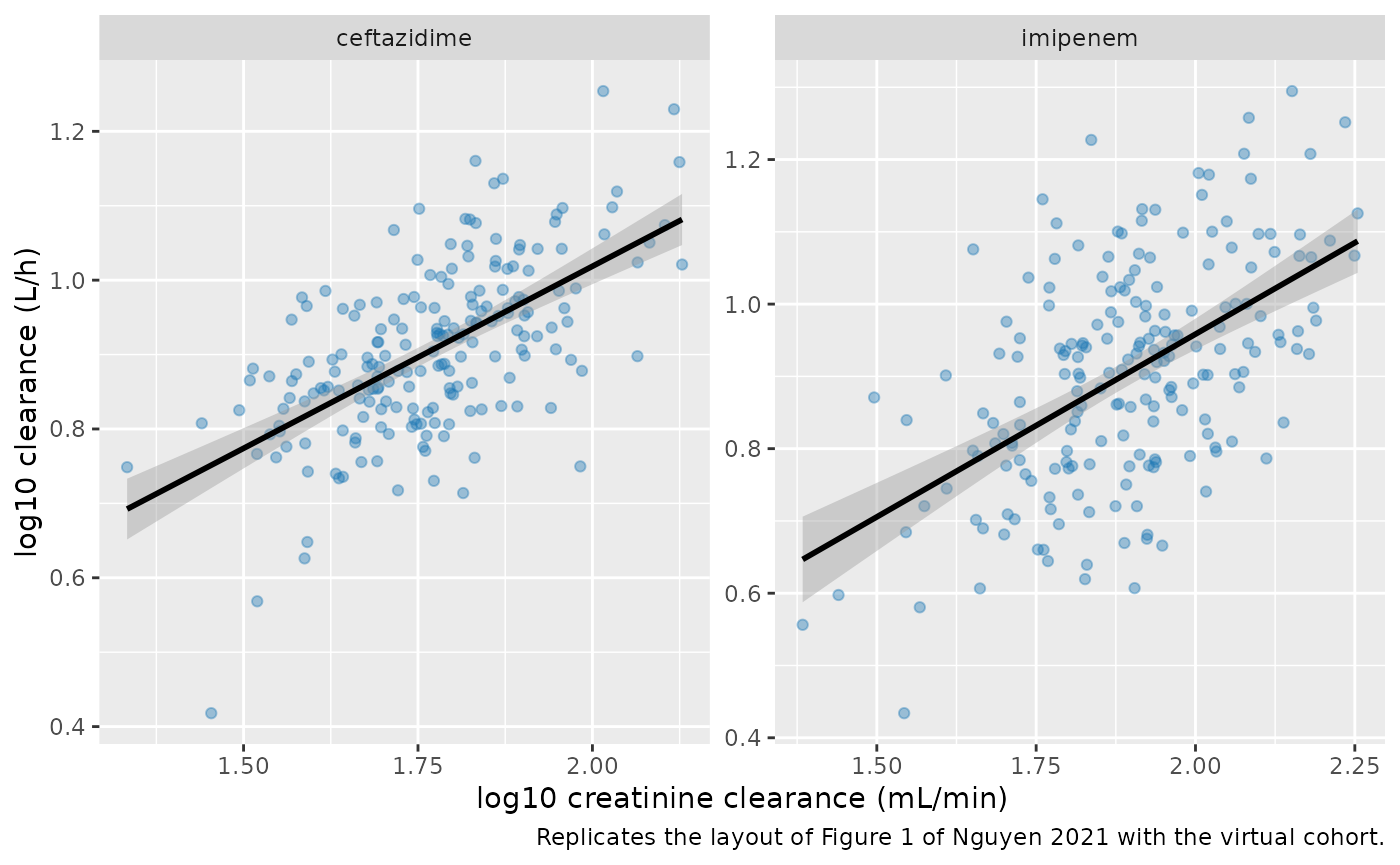
Concentration-time profile after the third dose (Figure 3)
Figure 3 of the paper is a visual predictive check over roughly 0.5-7 h after the dose, pooling patients with different doses and infusion durations. With no observed data available, the plot below shows the 10th, 50th and 90th percentiles of simulated observations (individual predictions with the proportional residual error applied in base R) after the third 1 g, 0.5 h dose.
fig3 <- sim |>
  dplyr::filter(time >= 16.5, time <= 23) |>
  dplyr::left_join(cohort_spec, by = "drug") |>
  dplyr::mutate(tad = time - 16,
                dv = Cc * (1 + prop_sd * rnorm(dplyr::n())))
fig3 |>
  dplyr::group_by(drug, tad) |>
  dplyr::summarise(
    p10 = quantile(dv, 0.1), p50 = median(dv), p90 = quantile(dv, 0.9),
    .groups = "drop"
  ) |>
  ggplot(aes(tad, p50)) +
  geom_ribbon(aes(ymin = p10, ymax = p90), alpha = 0.25) +
  geom_line() +
  facet_wrap(~drug) +
  labs(x = "Time after the start of the third dose (h)",
       y = "Concentration (mg/L)",
       caption = "Compare with Figure 3 of Nguyen 2021 (1 g q8h, 0.5 h infusion; 10th-50th-90th percentiles).")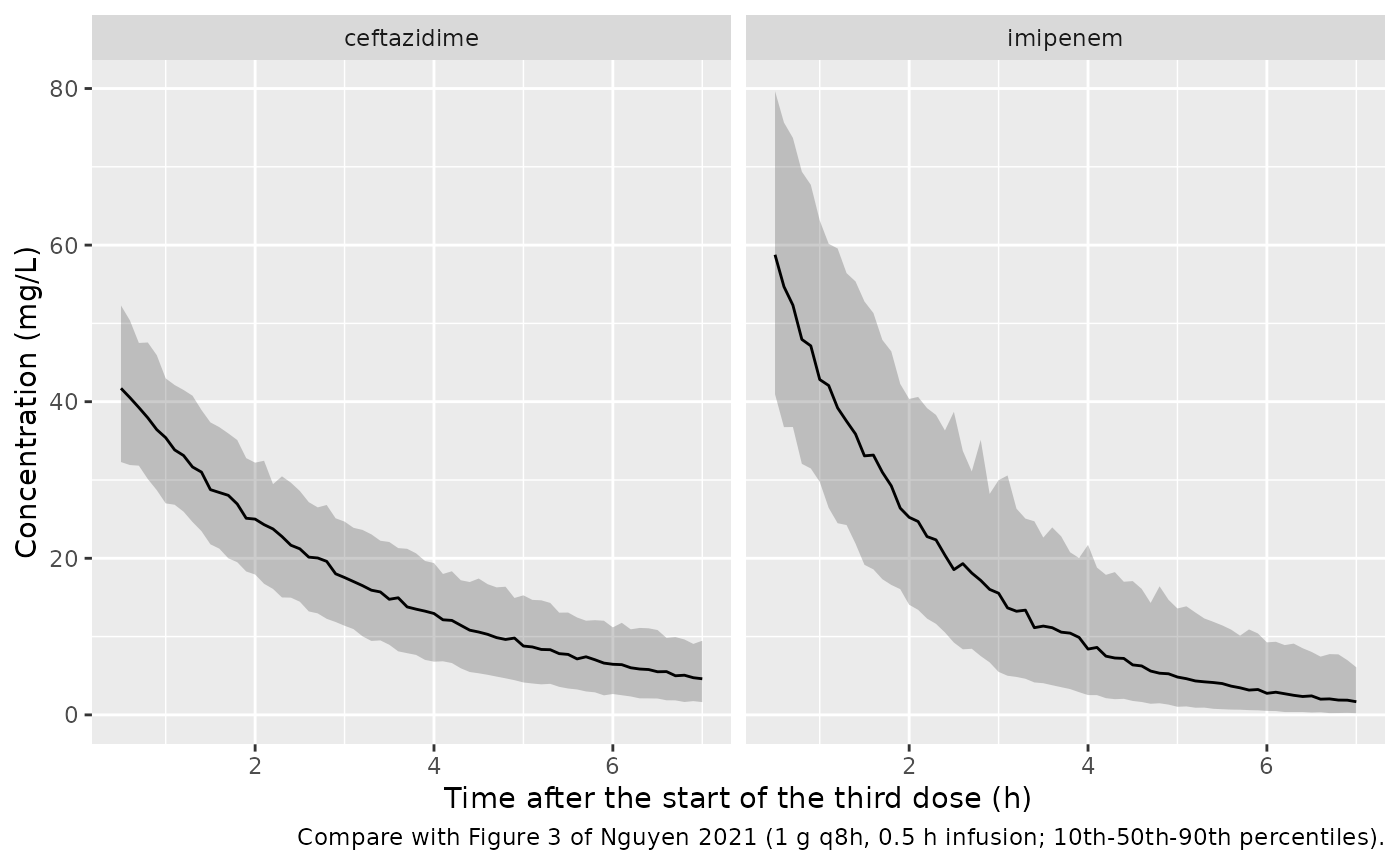
fig3_5h <- fig3 |>
  dplyr::filter(abs(tad - 5) < 1e-8) |>
  dplyr::group_by(drug) |>
  dplyr::summarise(median_5h = median(Cc), .groups = "drop")
knitr::kable(fig3_5h, digits = 1,
caption = "Median simulated concentration 5 h after the start of the third dose (mg/L).")| drug | median_5h |
|---|---|
| ceftazidime | 9 |
| imipenem | 5 |
The simulated medians 5 h after the dose sit close to the observed medians in Figure 3 (about 9 mg/L for ceftazidime and about 5 mg/L for imipenem, read from the plot). The paper’s early (1-3 h) medians are higher than the 0.5 h-infusion profile above because many study patients received longer infusions (Supplementary Figure S1).
PKNCA validation
The paper reports no NCA table, so the steady-state NCA below checks
the model against itself: over the final 8-h interval,
AUCtau must equal dose divided by each patient’s own
clearance.
nca_conc <- sim |>
  dplyr::filter(!is.na(Cc), time >= 64) |>
  dplyr::mutate(Cc = pmax(Cc, 0), treatment = paste(drug, "1 g q8h")) |>
  dplyr::select(id, time, Cc, treatment)
nca_dose <- sim |>
  dplyr::distinct(id, drug) |>
  dplyr::transmute(id, time = 64, amt = 1000,
                   treatment = paste(drug, "1 g q8h"))

nca_ss <- PKNCA::pk.nca(PKNCA::PKNCAdata(
  PKNCA::PKNCAconc(nca_conc, Cc ~ time | treatment + id),
  PKNCA::PKNCAdose(nca_dose, amt ~ time | treatment + id),
  intervals = data.frame(start = 64, end = 72, cmax = TRUE, cmin = TRUE,
                         auclast = TRUE)
))

summary(nca_ss) |> knitr::kable(caption = "Steady-state NCA, 1 g q8h as a 0.5 h infusion (64-72 h).")| start | end | treatment | N | auclast | cmax | cmin |
|---|---|---|---|---|---|---|
| 64 | 72 | ceftazidime 1 g q8h | 200 | 124 [26.8] | 42.2 [12.9] | 2.89 [107] |
| 64 | 72 | imipenem 1 g q8h | 200 | 125 [36.2] | 60.1 [11.7] | 0.799 [367] |
ss_chk <- as.data.frame(nca_ss$result) |>
  dplyr::filter(PPTESTCD == "auclast") |>
  dplyr::select(id, auclast = PPORRES) |>
  dplyr::left_join(dplyr::distinct(cl_check, id, cl), by = "id") |>
  dplyr::mutate(ratio = auclast * cl / 1000)
# Numerical-only identity: the residual comes from the linear-up/log-down
# trapezoid on a 0.1-h grid and from the approach to steady state of the
# slowest-clearing subjects (exp(-k * 64) with k >= 0.09 1/h).
stopifnot(
  nrow(ss_chk) == 2 * n_per_drug,
  max(abs(ss_chk$ratio - 1)) < 0.01
)
Probability of target attainment (Figure 4, Tables S3 and S4)
The paper simulates 1000 patients per regimen in mlxR and reports, for each creatinine-clearance stratum (30-60, 60-90 and above 90 mL/min), the percentage reaching 100% fT>MIC and 60% (ceftazidime) or 40% (imipenem) fT>MIC, with free fractions of 0.86 (ceftazidime) and 0.80 (imipenem), at 72 h. The short infusion (SI) is 0.5 h and the extended infusion (EI) 3 h; the continuous infusion (CI) is a loading dose (2 g ceftazidime, 1 g imipenem) followed by 6 g or 4 g per 24 h.
Here each stratum has 200 base-R virtual patients with creatinine clearance uniform over the stratum (90-150 mL/min for the open top stratum), and fT>MIC is evaluated on the individual predictions over the last dosing interval before 72 h (48-72 h for CI). The published tables are transcribed from Supplementary Tables S3 and S4.
mics <- c(0.125, 0.25, 0.5, 1, 2, 4, 8, 16, 32)
pta_cols <- c("stratum", "regimen",
              paste0("full_", mics), paste0("partial_", mics))
caz_pub <- tibble::tribble(
  ~s, ~r, ~a1, ~a2, ~a3, ~a4, ~a5, ~a6, ~a7, ~a8, ~a9, ~b1, ~b2, ~b3, ~b4, ~b5, ~b6, ~b7, ~b8, ~b9,
  "30-60", "1g q12h (SI)", 94.6, 87.2, 64.9, 40.3, 14.2, 1.4, 0.1, 0, 0, 100, 99.9, 99.5, 97.6, 85.7, 44.3, 5.3, 0.1, 0,
  "30-60", "2g q12h (SI)", 98.1, 95.2, 87.7, 71.2, 42.8, 13.9, 1.2, 0, 0, 100, 100, 100, 99.6, 97.6, 85.8, 47, 4.3, 0,
  "30-60", "1g q8h (SI)", 100, 99.7, 98.9, 92.7, 72.1, 34.8, 5.6, 0, 0, 100, 100, 100, 100, 99.7, 95.4, 58.8, 3.8, 0,
  "30-60", "2g q8h (SI)", 100, 99.9, 99.6, 98.3, 94, 75.3, 34.2, 4, 0, 100, 100, 100, 100, 100, 99.7, 96.2, 58.7, 3.1,
  "30-60", "1g q12h (EI)", 98.7, 95.3, 85.7, 62.7, 27.7, 4, 0, 0, 0, 100, 100, 100, 99.9, 98.2, 76.4, 13.5, 0, 0,
  "30-60", "2g q12h (EI)", 99.8, 99, 95.6, 83.9, 60.3, 27.4, 3.1, 0.1, 0, 100, 100, 100, 100, 100, 97.9, 74.1, 13.6, 0,
  "30-60", "1g q8h (EI)", 100, 100, 100, 99, 92.2, 65.4, 15.4, 0.1, 0, 100, 100, 100, 100, 100, 99.9, 86.5, 8.9, 0,
  "30-60", "2g q8h (EI)", 99.9, 99.9, 99.9, 99.8, 99.3, 94.5, 67.4, 16.1, 0.3, 100, 100, 100, 100, 100, 99.9, 99.8, 87.8, 10.1,
  "30-60", "6g q24h (CI)", 100, 100, 100, 100, 100, 100, 100, 99.3, 26.4, 100, 100, 100, 100, 100, 100, 100, 99.3, 26.4,
  "60-90", "1g q12h (SI)", 81.6, 64.7, 38.3, 14.2, 1.6, 0, 0, 0, 0, 99.8, 99.3, 96.7, 87.4, 61.9, 17.2, 0.3, 0, 0,
  "60-90", "2g q12h (SI)", 91.7, 81.1, 64, 39, 15.7, 2.5, 0, 0, 0, 100, 100, 99.8, 97.7, 87.1, 61.4, 17.6, 0.3, 0,
  "60-90", "1g q8h (SI)", 99.8, 97.8, 91.1, 77.8, 47.1, 12.3, 0.4, 0, 0, 100, 100, 100, 100, 98, 82.8, 28.5, 0.2, 0,
  "60-90", "2g q8h (SI)", 99.9, 99.6, 97.4, 91.9, 76.4, 44, 10.8, 0.5, 0, 100, 100, 100, 100, 99.9, 97.4, 81.9, 27.7, 0.5,
  "60-90", "1g q12h (EI)", 92.8, 80.2, 59.4, 32, 7.5, 0.6, 0, 0, 0, 100, 100, 99.7, 98.7, 87.7, 44.6, 2.1, 0, 0,
  "60-90", "2g q12h (EI)", 96.9, 92, 81.1, 60.1, 31.8, 8.2, 0.3, 0, 0, 100, 100, 100, 99.9, 98.5, 87.6, 45.6, 2.6, 0,
  "60-90", "1g q8h (EI)", 100, 99.9, 99.3, 95.8, 77.5, 34.1, 2.7, 0, 0, 100, 100, 100, 100, 100, 99.1, 64.1, 0.9, 0,
  "60-90", "2g q8h (EI)", 100, 100, 99.9, 99.2, 94.6, 75.9, 34.6, 2.5, 0.1, 100, 100, 100, 100, 100, 100, 98.8, 61.1, 1.4,
  "60-90", "6g q24h (CI)", 100, 100, 100, 100, 100, 100, 100, 96.3, 6.7, 100, 100, 100, 100, 100, 100, 100, 96.3, 6.7,
  ">90", "1g q12h (SI)", 49, 30.4, 13.2, 3, 0.2, 0, 0, 0, 0, 97.5, 92.8, 82.4, 58, 26.7, 3.6, 0, 0, 0,
  ">90", "2g q12h (SI)", 67.4, 50.1, 30.4, 15.4, 3.6, 0.3, 0, 0, 0, 99.4, 98.3, 95.4, 84.7, 60.9, 27.1, 4.1, 0.2, 0,
  ">90", "1g q8h (SI)", 94.1, 86.2, 71.2, 46.2, 18, 1.9, 0, 0, 0, 100, 99.6, 99.1, 97, 85.7, 51.7, 7, 0, 0,
  ">90", "2g q8h (SI)", 97.8, 94.9, 86.8, 70.1, 44.7, 14.6, 1.5, 0, 0, 100, 100, 99.9, 99.4, 97.3, 86.2, 50, 6.3, 0,
  ">90", "1g q12h (EI)", 69, 49.4, 27.6, 8.6, 1.7, 0, 0, 0, 0, 99.9, 99.6, 97.2, 88.5, 59.1, 15.1, 0.2, 0, 0,
  ">90", "2g q12h (EI)", 83.2, 68.9, 50.5, 27, 8.6, 1.6, 0, 0, 0, 100, 99.9, 99.5, 96.5, 87.2, 58, 15.5, 0.3, 0,
  ">90", "1g q8h (EI)", 99.8, 97.9, 91.4, 74.6, 44.9, 10.5, 0.4, 0, 0, 100, 100, 100, 100, 99.9, 89.1, 30.1, 0.1, 0,
  ">90", "2g q8h (EI)", 100, 99.7, 98.3, 91.6, 76.1, 44.1, 10.6, 0.4, 0, 100, 100, 100, 100, 100, 99.8, 90, 26.9, 0.2,
  ">90", "6g q24h (CI)", 100, 100, 100, 100, 100, 100, 100, 77.4, 1, 100, 100, 100, 100, 100, 100, 100, 77.4, 1
)
imi_pub <- tibble::tribble(
  ~s, ~r, ~a1, ~a2, ~a3, ~a4, ~a5, ~a6, ~a7, ~a8, ~a9, ~b1, ~b2, ~b3, ~b4, ~b5, ~b6, ~b7, ~b8, ~b9,
  "30-60", "0.75g q8h (SI)", 96.9, 93.3, 84.5, 69.2, 44.3, 15.8, 2.3, 0.2, 0, 100, 100, 100, 100, 99.4, 98, 80.6, 17.6, 0.2,
  "30-60", "0.5g q6h (SI)", 99.4, 98.6, 96.1, 85.9, 62.5, 30.1, 5.6, 0, 0, 100, 100, 100, 100, 100, 99.1, 80.5, 14, 0,
  "30-60", "1g q8h (SI)", 97.9, 95, 89.1, 77.5, 54.3, 25.8, 8.5, 0.8, 0.1, 100, 100, 100, 100, 100, 99.5, 92.5, 45.7, 2.3,
  "30-60", "0.75g q6h (SI)", 99.8, 99.6, 97.8, 92.1, 77.6, 52.4, 17.9, 1, 0, 100, 100, 100, 100, 100, 100, 97.3, 55, 1.6,
  "30-60", "1g q6h (SI)", 99.9, 99.7, 98.7, 96.2, 86.9, 62.8, 31.5, 4.5, 0.3, 100, 100, 100, 100, 100, 99.9, 99.3, 82.1, 10.6,
  "30-60", "0.75g q8h (EI)", 99.7, 98.7, 95, 87.2, 68.1, 35.4, 9, 0.4, 0, 100, 100, 100, 100, 100, 100, 96.7, 29.7, 0,
  "30-60", "0.5g q6h (EI)", 100, 99.7, 99.5, 97.6, 89.3, 60.9, 15.9, 0.4, 0, 100, 100, 100, 100, 100, 100, 93.1, 12.3, 0,
  "30-60", "1g q8h (EI)", 99.4, 99, 97.6, 91.7, 77.7, 50, 18.1, 2.2, 0, 100, 100, 100, 100, 100, 100, 99.7, 67, 2.4,
  "30-60", "0.75g q6h (EI)", 100, 99.9, 99.8, 99.1, 96.5, 81.1, 44.1, 7.3, 0, 100, 100, 100, 100, 100, 100, 100, 67, 2.6,
  "30-60", "1g q6h (EI)", 100, 100, 99.9, 99.7, 98.2, 92.5, 64.8, 19.7, 0.6, 100, 100, 100, 100, 100, 100, 100, 95.6, 17,
  "30-60", "4g q24h (CI)", 100, 100, 100, 100, 100, 100, 100, 81.6, 8.2, 100, 100, 100, 100, 100, 100, 100, 81.6, 8.2,
  "60-90", "0.75g q8h (SI)", 86.9, 75.8, 58.8, 38.7, 16.4, 4, 0.3, 0, 0, 100, 100, 100, 99.9, 97.8, 89, 51.5, 4.3, 0,
  "60-90", "0.5g q6h (SI)", 96.4, 90.5, 79.1, 60.8, 32.6, 9.3, 0.4, 0, 0, 100, 100, 100, 100, 99.7, 93.7, 52.6, 2.1, 0,
  "60-90", "1g q8h (SI)", 87.9, 78.3, 65, 47.8, 25.9, 8.9, 1.3, 0.1, 0, 100, 100, 100, 99.9, 98.9, 92.6, 70, 17.8, 0.3,
  "60-90", "0.75g q6h (SI)", 98.8, 95.8, 88.4, 76.2, 51.2, 24.5, 4.6, 0.2, 0, 100, 100, 100, 100, 99.9, 99.4, 84.8, 27.1, 0.3,
  "60-90", "1g q6h (SI)", 98.6, 97.2, 92.7, 82.1, 60.6, 34.1, 10.4, 0.8, 0.1, 100, 100, 100, 100, 99.9, 99.5, 95.3, 53.4, 3.8,
  "60-90", "0.75g q8h (EI)", 96.8, 91.9, 82.6, 65.9, 39.4, 14.1, 1.3, 0.1, 0, 100, 100, 100, 100, 100, 99.9, 86.3, 9.1, 0.1,
  "60-90", "0.5g q6h (EI)", 99.9, 99.4, 97.5, 89.3, 67.5, 30.7, 4.4, 0, 0, 100, 100, 100, 100, 100, 100, 76.7, 3.5, 0,
  "60-90", "1g q8h (EI)", 98.8, 95.1, 86.6, 71, 46.2, 20, 3.2, 0.1, 0, 100, 100, 100, 100, 100, 100, 98.7, 33.8, 0.1,
  "60-90", "0.75g q6h (EI)", 99.8, 99.8, 99, 95.8, 84.8, 53.8, 16.3, 0.5, 0, 100, 100, 100, 100, 100, 100, 99.2, 35.6, 0.1,
  "60-90", "1g q6h (EI)", 100, 99.9, 99.5, 97.8, 89.6, 66.5, 29.4, 4.4, 0, 100, 100, 100, 100, 100, 100, 100, 75.9, 2.3,
  "60-90", "4g q24h (CI)", 100, 100, 100, 100, 100, 100, 100, 54.9, 1.3, 100, 100, 100, 100, 100, 100, 100, 54.9, 1.3,
  ">90", "0.75g q8h (SI)", 82.6, 73.3, 58.7, 40.1, 21.4, 7.3, 0.7, 0, 0, 100, 100, 99.9, 99.4, 96.6, 85.1, 52.1, 8, 0,
  ">90", "0.5g q6h (SI)", 94.5, 89.5, 79.4, 60.9, 37, 13.2, 1.8, 0, 0, 100, 100, 100, 99.9, 99.2, 92.3, 55, 4.3, 0,
  ">90", "1g q8h (SI)", 87.5, 79.5, 66.9, 51.1, 29.9, 13.6, 2.9, 0.3, 0, 100, 100, 100, 99.7, 97.9, 93, 71.9, 25, 0.9,
  ">90", "0.75g q6h (SI)", 97.2, 93.1, 85.5, 71.7, 52.3, 26.6, 6.5, 0.8, 0, 100, 100, 100, 99.9, 99.7, 98, 82.6, 29.3, 0.8,
  ">90", "1g q6h (SI)", 98, 95.9, 90.7, 79.4, 62.4, 36.4, 12.2, 1.5, 0, 100, 100, 100, 100, 100, 99.4, 93.1, 56.1, 4.1,
  ">90", "0.75g q8h (EI)", 94.8, 89.3, 80.3, 63.5, 40.7, 15.1, 2.2, 0.1, 0, 100, 100, 100, 100, 100, 99.7, 82.5, 10.8, 0.1,
  ">90", "0.5g q6h (EI)", 99.7, 98.7, 95.1, 86, 64.6, 33.5, 6.1, 0.3, 0, 100, 100, 100, 100, 100, 100, 72.4, 4.9, 0,
  ">90", "1g q8h (EI)", 96.8, 92.9, 83.2, 69.8, 50.2, 24.6, 7.1, 0.6, 0, 100, 100, 100, 100, 100, 100, 97.2, 39.4, 0.7,
  ">90", "0.75g q6h (EI)", 99.9, 98.9, 97.4, 93.1, 80.2, 55.8, 21.4, 2.7, 0, 100, 100, 100, 100, 100, 100, 98.4, 39.2, 0.8,
  ">90", "1g q6h (EI)", 99.9, 99.7, 98.9, 96.2, 86.6, 65.2, 31.3, 7.2, 0.4, 100, 100, 100, 100, 100, 100, 99.9, 74.6, 5.4,
  ">90", "4g q24h (CI)", 100, 100, 100, 100, 100, 100, 96.2, 32.5, 0.5, 100, 100, 100, 100, 100, 100, 96.2, 32.5, 0.5
)
names(caz_pub) <- pta_cols
names(imi_pub) <- pta_cols
published_pta <- dplyr::bind_rows(
  dplyr::mutate(caz_pub, drug = "ceftazidime"),
  dplyr::mutate(imi_pub, drug = "imipenem")
) |>
  tidyr::pivot_longer(-c(drug, stratum, regimen),
                      names_to = c("target", "mic"), names_sep = "_",
                      values_to = "pta_pub") |>
  dplyr::mutate(mic = as.numeric(mic))
stopifnot(nrow(published_pta) == (27 + 33) * 18)
pta_regimens <- published_pta |>
  dplyr::distinct(drug, regimen) |>
  tidyr::extract(regimen, c("dose_g", "tau", "route"),
                 "^([0-9.]+)g q([0-9]+)h \\((SI|EI|CI)\\)$",
                 remove = FALSE, convert = TRUE) |>
  dplyr::mutate(dur = unname(c(SI = 0.5, EI = 3, CI = 24)[route]))
stopifnot(!anyNA(pta_regimens$dose_g), !anyNA(pta_regimens$dur))

strata <- tibble::tribble(
  ~stratum, ~lo, ~hi,
  "30-60",  30,  60,
  "60-90",  60,  90,
  ">90",    90,  150
)

set.seed(20210456)
n_per_stratum <- 200L
pta_subjects <- tidyr::crossing(drug = c("ceftazidime", "imipenem"),
                                strata) |>
  dplyr::left_join(cohort_spec, by = "drug") |>
  dplyr::rowwise() |>
  dplyr::reframe(
    drug = drug, stratum = stratum,
    id = seq_len(n_per_stratum),
    CRCL = runif(n_per_stratum, lo, hi),
    etalcl = rnorm(n_per_stratum, 0, om_cl),
    etalvc = rnorm(n_per_stratum, 0, om_v)
  )

pta_events <- function(subj, reg) {
  loading <- c(ceftazidime = 2000, imipenem = 1000)[[reg$drug]]
  if (reg$route == "CI") {
    window <- c(48, 72)
    doses <- dplyr::bind_rows(
      data.frame(time = 0, amt = loading, rate = 0),
      data.frame(time = c(0, 24, 48), amt = reg$dose_g * 1000,
                 rate = reg$dose_g * 1000 / 24)
    )
  } else {
    window <- c(72 - reg$tau, 72)
    doses <- data.frame(time = seq(0, 72 - reg$tau, by = reg$tau),
                        amt = reg$dose_g * 1000,
                        rate = reg$dose_g * 1000 / reg$dur)
  }
  doses$evid <- 1L
  obs <- data.frame(time = seq(window[1], window[2], by = 0.05),
                    amt = NA_real_, rate = NA_real_, evid = 0L)
  tidyr::crossing(subj, dplyr::bind_rows(doses, obs)) |>
    dplyr::mutate(cmt = "central") |>
    dplyr::arrange(id, time, dplyr::desc(evid))
}

pta_one <- function(reg, st) {
  subj <- dplyr::filter(pta_subjects, drug == reg$drug, stratum == st) |>
    dplyr::select(id, CRCL, etalcl, etalvc)
  ev <- pta_events(subj, reg)
  out <- solve_with_etas(mods[[reg$drug]], ev)
  win_start <- if (reg$route == "CI") 48 else 72 - reg$tau
  out <- out[out$time >= win_start, ]
  fu <- c(ceftazidime = 0.86, imipenem = 0.80)[[reg$drug]]
  partial <- c(ceftazidime = 0.6, imipenem = 0.4)[[reg$drug]]
  dplyr::bind_rows(lapply(mics, function(m) {
    ft <- tapply(fu * out$Cc > m, out$id, mean)
    data.frame(
      drug = reg$drug, stratum = st, regimen = reg$regimen, mic = m,
      target = c("full", "partial"),
      pta_sim = 100 * c(mean(ft == 1), mean(ft >= partial))
    )
  }))
}

pta_sim <- dplyr::bind_rows(lapply(seq_len(nrow(pta_regimens)), function(i) {
  dplyr::bind_rows(lapply(strata$stratum, function(st) pta_one(pta_regimens[i, ], st)))
}))

pta_cmp <- dplyr::inner_join(published_pta, pta_sim,
                             by = c("drug", "stratum", "regimen", "mic", "target")) |>
  dplyr::mutate(diff = pta_sim - pta_pub)
stopifnot(nrow(pta_cmp) == nrow(published_pta))
pta_cmp |>
  dplyr::filter(target == "partial", !grepl("CI", regimen)) |>
  dplyr::mutate(stratum = factor(stratum, c("30-60", "60-90", ">90"))) |>
  ggplot(aes(mic, colour = regimen)) +
  geom_line(aes(y = pta_sim)) +
  geom_point(aes(y = pta_pub)) +
  geom_hline(yintercept = 90, linetype = 2) +
  scale_x_log10(breaks = mics) +
  facet_grid(drug ~ stratum) +
  labs(x = "MIC (mg/L)", y = "PTA (%)",
       title = "60% fT>MIC (ceftazidime) and 40% fT>MIC (imipenem)",
       caption = paste("Lines: simulated here. Points: Supplementary Tables S3 and S4.",
                       "Replicates Figure 4 of Nguyen 2021 (intermittent regimens)."))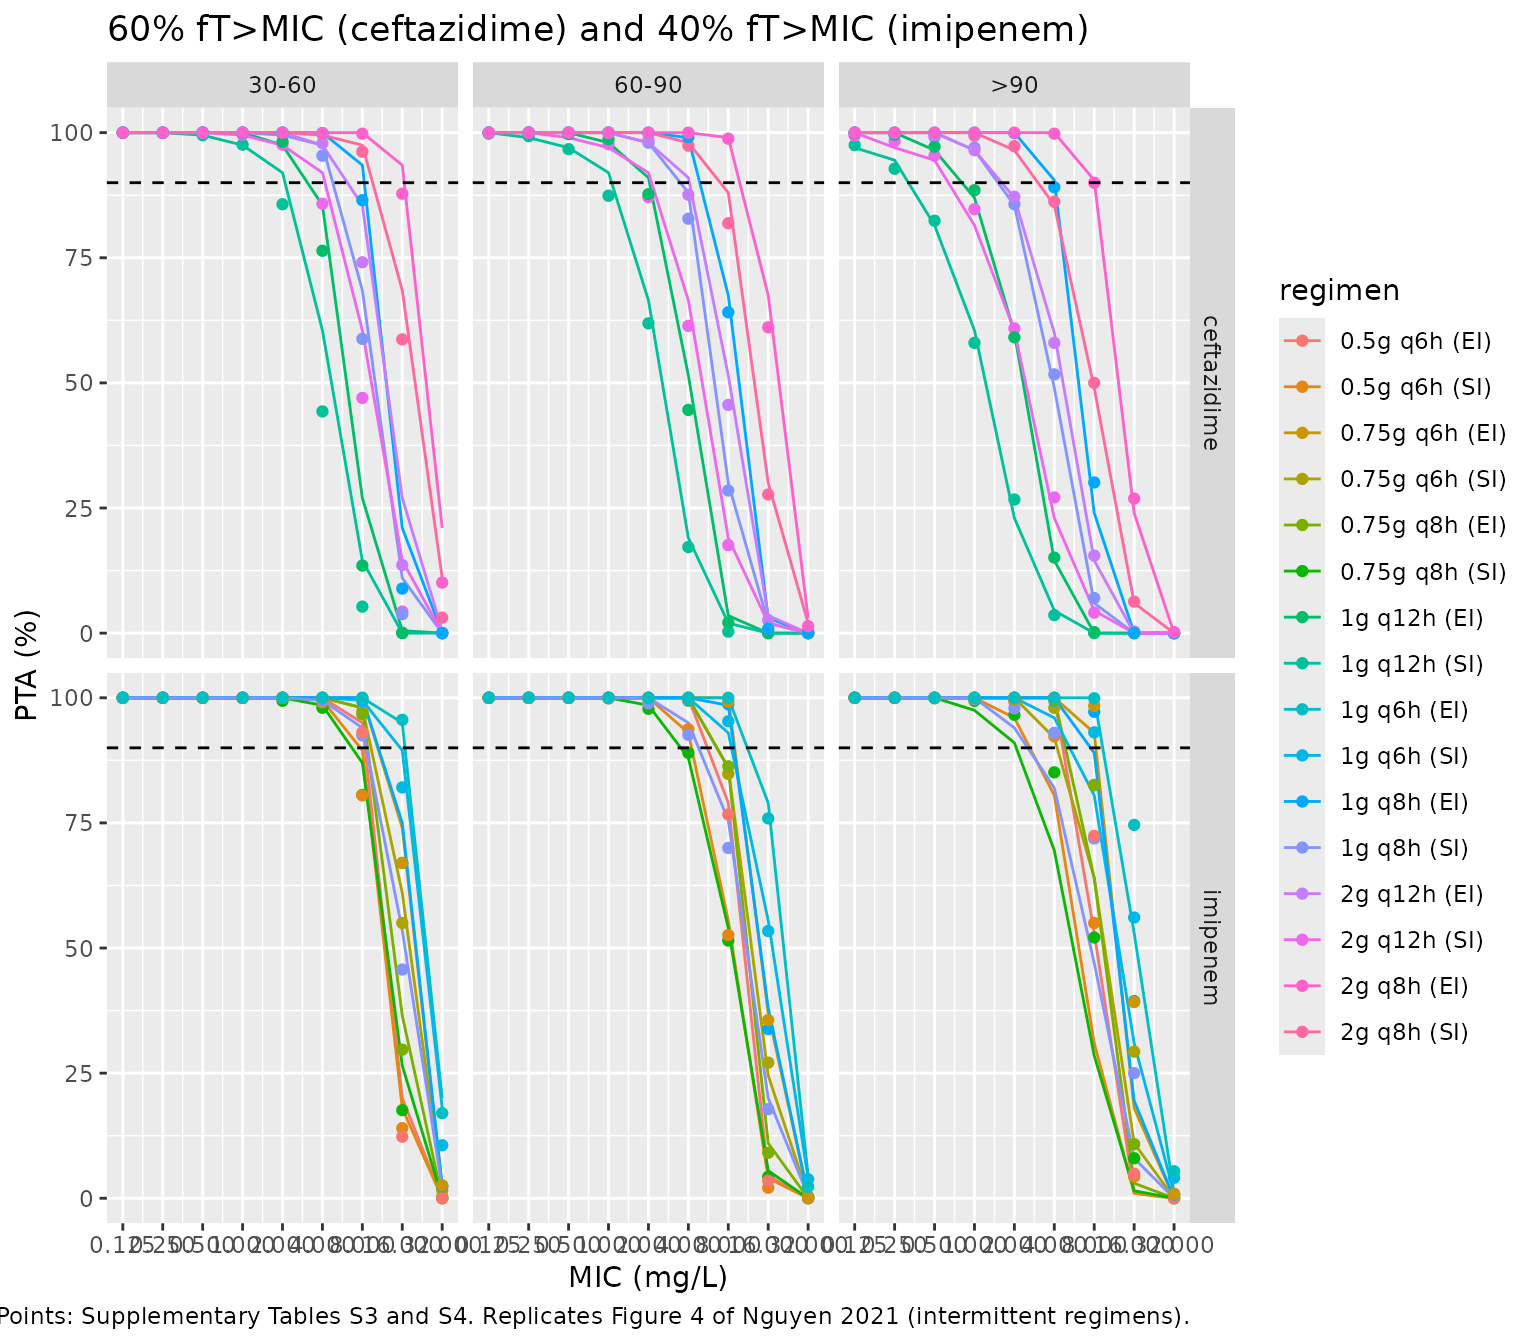
pta_summary <- pta_cmp |>
  dplyr::group_by(drug, target) |>
  dplyr::summarise(
    cells = dplyr::n(),
    median_abs_diff = median(abs(diff)),
    p90_abs_diff = quantile(abs(diff), 0.9),
    mean_diff = mean(diff),
    .groups = "drop"
  )
pta_summary |>
  dplyr::rename("Drug" = drug, "Target" = target, "Cells" = cells,
                "Median |sim - published| (points)" = median_abs_diff,
                "90th percentile |sim - published|" = p90_abs_diff,
                "Mean sim - published" = mean_diff) |>
knitr::kable(digits = 1, caption = "Agreement with Supplementary Tables S3 and S4, all regimens, strata and MICs. 'full' = 100% fT>MIC; 'partial' = 60% (ceftazidime) or 40% (imipenem) fT>MIC.")| Drug | Target | Cells | Median |sim - published| (points) | 90th percentile |sim - published| | Mean sim - published |
|---|---|---|---|---|---|
| ceftazidime | full | 243 | 0.7 | 7.6 | 1.8 |
| ceftazidime | partial | 243 | 0.1 | 5.2 | 1.1 |
| imipenem | full | 297 | 1.2 | 14.9 | -1.8 |
| imipenem | partial | 297 | 0.0 | 6.3 | -0.7 |
pta_cmp |>
  dplyr::filter(target == "partial", mic %in% c(8, 16)) |>
  dplyr::select(drug, stratum, regimen, mic, pta_pub, pta_sim) |>
  dplyr::rename("Drug" = drug, "CLcr stratum" = stratum, "Regimen" = regimen,
                "MIC (mg/L)" = mic, "PTA, published (%)" = pta_pub,
                "PTA, simulated (%)" = pta_sim) |>
knitr::kable(digits = 1, caption = "Partial-target PTA at the MICs where the regimens separate.")| Drug | CLcr stratum | Regimen | MIC (mg/L) | PTA, published (%) | PTA, simulated (%) |
|---|---|---|---|---|---|
| ceftazidime | 30-60 | 1g q12h (SI) | 8 | 5.3 | 14.5 |
| ceftazidime | 30-60 | 1g q12h (SI) | 16 | 0.1 | 0.0 |
| ceftazidime | 30-60 | 2g q12h (SI) | 8 | 47.0 | 60.5 |
| ceftazidime | 30-60 | 2g q12h (SI) | 16 | 4.3 | 14.5 |
| ceftazidime | 30-60 | 1g q8h (SI) | 8 | 58.8 | 68.5 |
| ceftazidime | 30-60 | 1g q8h (SI) | 16 | 3.8 | 11.0 |
| ceftazidime | 30-60 | 2g q8h (SI) | 8 | 96.2 | 97.5 |
| ceftazidime | 30-60 | 2g q8h (SI) | 16 | 58.7 | 68.5 |
| ceftazidime | 30-60 | 1g q12h (EI) | 8 | 13.5 | 27.0 |
| ceftazidime | 30-60 | 1g q12h (EI) | 16 | 0.0 | 0.5 |
| ceftazidime | 30-60 | 2g q12h (EI) | 8 | 74.1 | 85.5 |
| ceftazidime | 30-60 | 2g q12h (EI) | 16 | 13.6 | 27.0 |
| ceftazidime | 30-60 | 1g q8h (EI) | 8 | 86.5 | 93.5 |
| ceftazidime | 30-60 | 1g q8h (EI) | 16 | 8.9 | 21.0 |
| ceftazidime | 30-60 | 2g q8h (EI) | 8 | 99.8 | 100.0 |
| ceftazidime | 30-60 | 2g q8h (EI) | 16 | 87.8 | 93.5 |
| ceftazidime | 30-60 | 6g q24h (CI) | 8 | 100.0 | 100.0 |
| ceftazidime | 30-60 | 6g q24h (CI) | 16 | 99.3 | 99.0 |
| ceftazidime | 60-90 | 1g q12h (SI) | 8 | 0.3 | 2.0 |
| ceftazidime | 60-90 | 1g q12h (SI) | 16 | 0.0 | 0.0 |
| ceftazidime | 60-90 | 2g q12h (SI) | 8 | 17.6 | 19.0 |
| ceftazidime | 60-90 | 2g q12h (SI) | 16 | 0.3 | 2.0 |
| ceftazidime | 60-90 | 1g q8h (SI) | 8 | 28.5 | 30.0 |
| ceftazidime | 60-90 | 1g q8h (SI) | 16 | 0.2 | 2.0 |
| ceftazidime | 60-90 | 2g q8h (SI) | 8 | 81.9 | 88.0 |
| ceftazidime | 60-90 | 2g q8h (SI) | 16 | 27.7 | 30.0 |
| ceftazidime | 60-90 | 1g q12h (EI) | 8 | 2.1 | 3.5 |
| ceftazidime | 60-90 | 1g q12h (EI) | 16 | 0.0 | 0.0 |
| ceftazidime | 60-90 | 2g q12h (EI) | 8 | 45.6 | 51.5 |
| ceftazidime | 60-90 | 2g q12h (EI) | 16 | 2.6 | 3.5 |
| ceftazidime | 60-90 | 1g q8h (EI) | 8 | 64.1 | 67.5 |
| ceftazidime | 60-90 | 1g q8h (EI) | 16 | 0.9 | 3.0 |
| ceftazidime | 60-90 | 2g q8h (EI) | 8 | 98.8 | 99.0 |
| ceftazidime | 60-90 | 2g q8h (EI) | 16 | 61.1 | 67.5 |
| ceftazidime | 60-90 | 6g q24h (CI) | 8 | 100.0 | 100.0 |
| ceftazidime | 60-90 | 6g q24h (CI) | 16 | 96.3 | 97.5 |
| ceftazidime | >90 | 1g q12h (SI) | 8 | 0.0 | 0.0 |
| ceftazidime | >90 | 1g q12h (SI) | 16 | 0.0 | 0.0 |
| ceftazidime | >90 | 2g q12h (SI) | 8 | 4.1 | 4.5 |
| ceftazidime | >90 | 2g q12h (SI) | 16 | 0.2 | 0.0 |
| ceftazidime | >90 | 1g q8h (SI) | 8 | 7.0 | 6.0 |
| ceftazidime | >90 | 1g q8h (SI) | 16 | 0.0 | 0.0 |
| ceftazidime | >90 | 2g q8h (SI) | 8 | 50.0 | 49.0 |
| ceftazidime | >90 | 2g q8h (SI) | 16 | 6.3 | 6.0 |
| ceftazidime | >90 | 1g q12h (EI) | 8 | 0.2 | 0.0 |
| ceftazidime | >90 | 1g q12h (EI) | 16 | 0.0 | 0.0 |
| ceftazidime | >90 | 2g q12h (EI) | 8 | 15.5 | 14.5 |
| ceftazidime | >90 | 2g q12h (EI) | 16 | 0.3 | 0.0 |
| ceftazidime | >90 | 1g q8h (EI) | 8 | 30.1 | 24.0 |
| ceftazidime | >90 | 1g q8h (EI) | 16 | 0.1 | 0.0 |
| ceftazidime | >90 | 2g q8h (EI) | 8 | 90.0 | 90.5 |
| ceftazidime | >90 | 2g q8h (EI) | 16 | 26.9 | 24.0 |
| ceftazidime | >90 | 6g q24h (CI) | 8 | 100.0 | 100.0 |
| ceftazidime | >90 | 6g q24h (CI) | 16 | 77.4 | 77.5 |
| imipenem | 30-60 | 0.75g q8h (SI) | 8 | 80.6 | 87.0 |
| imipenem | 30-60 | 0.75g q8h (SI) | 16 | 17.6 | 26.5 |
| imipenem | 30-60 | 0.5g q6h (SI) | 8 | 80.5 | 89.5 |
| imipenem | 30-60 | 0.5g q6h (SI) | 16 | 14.0 | 18.0 |
| imipenem | 30-60 | 1g q8h (SI) | 8 | 92.5 | 94.0 |
| imipenem | 30-60 | 1g q8h (SI) | 16 | 45.7 | 53.5 |
| imipenem | 30-60 | 0.75g q6h (SI) | 8 | 97.3 | 98.0 |
| imipenem | 30-60 | 0.75g q6h (SI) | 16 | 55.0 | 61.0 |
| imipenem | 30-60 | 1g q6h (SI) | 8 | 99.3 | 99.5 |
| imipenem | 30-60 | 1g q6h (SI) | 16 | 82.1 | 89.5 |
| imipenem | 30-60 | 0.75g q8h (EI) | 8 | 96.7 | 98.0 |
| imipenem | 30-60 | 0.75g q8h (EI) | 16 | 29.7 | 36.5 |
| imipenem | 30-60 | 0.5g q6h (EI) | 8 | 93.1 | 95.0 |
| imipenem | 30-60 | 0.5g q6h (EI) | 16 | 12.3 | 20.0 |
| imipenem | 30-60 | 1g q8h (EI) | 8 | 99.7 | 100.0 |
| imipenem | 30-60 | 1g q8h (EI) | 16 | 67.0 | 75.0 |
| imipenem | 30-60 | 0.75g q6h (EI) | 8 | 100.0 | 100.0 |
| imipenem | 30-60 | 0.75g q6h (EI) | 16 | 67.0 | 74.0 |
| imipenem | 30-60 | 1g q6h (EI) | 8 | 100.0 | 100.0 |
| imipenem | 30-60 | 1g q6h (EI) | 16 | 95.6 | 95.0 |
| imipenem | 30-60 | 4g q24h (CI) | 8 | 100.0 | 100.0 |
| imipenem | 30-60 | 4g q24h (CI) | 16 | 81.6 | 90.5 |
| imipenem | 60-90 | 0.75g q8h (SI) | 8 | 51.5 | 54.0 |
| imipenem | 60-90 | 0.75g q8h (SI) | 16 | 4.3 | 5.5 |
| imipenem | 60-90 | 0.5g q6h (SI) | 8 | 52.6 | 55.5 |
| imipenem | 60-90 | 0.5g q6h (SI) | 16 | 2.1 | 4.0 |
| imipenem | 60-90 | 1g q8h (SI) | 8 | 70.0 | 75.5 |
| imipenem | 60-90 | 1g q8h (SI) | 16 | 17.8 | 20.0 |
| imipenem | 60-90 | 0.75g q6h (SI) | 8 | 84.8 | 86.0 |
| imipenem | 60-90 | 0.75g q6h (SI) | 16 | 27.1 | 24.5 |
| imipenem | 60-90 | 1g q6h (SI) | 8 | 95.3 | 93.0 |
| imipenem | 60-90 | 1g q6h (SI) | 16 | 53.4 | 55.5 |
| imipenem | 60-90 | 0.75g q8h (EI) | 8 | 86.3 | 86.0 |
| imipenem | 60-90 | 0.75g q8h (EI) | 16 | 9.1 | 11.0 |
| imipenem | 60-90 | 0.5g q6h (EI) | 8 | 76.7 | 79.0 |
| imipenem | 60-90 | 0.5g q6h (EI) | 16 | 3.5 | 4.5 |
| imipenem | 60-90 | 1g q8h (EI) | 8 | 98.7 | 98.5 |
| imipenem | 60-90 | 1g q8h (EI) | 16 | 33.8 | 38.0 |
| imipenem | 60-90 | 0.75g q6h (EI) | 8 | 99.2 | 100.0 |
| imipenem | 60-90 | 0.75g q6h (EI) | 16 | 35.6 | 37.0 |
| imipenem | 60-90 | 1g q6h (EI) | 8 | 100.0 | 100.0 |
| imipenem | 60-90 | 1g q6h (EI) | 16 | 75.9 | 79.0 |
| imipenem | 60-90 | 4g q24h (CI) | 8 | 100.0 | 100.0 |
| imipenem | 60-90 | 4g q24h (CI) | 16 | 54.9 | 59.5 |
| imipenem | >90 | 0.75g q8h (SI) | 8 | 52.1 | 28.5 |
| imipenem | >90 | 0.75g q8h (SI) | 16 | 8.0 | 1.5 |
| imipenem | >90 | 0.5g q6h (SI) | 8 | 55.0 | 31.0 |
| imipenem | >90 | 0.5g q6h (SI) | 16 | 4.3 | 1.0 |
| imipenem | >90 | 1g q8h (SI) | 8 | 71.9 | 47.0 |
| imipenem | >90 | 1g q8h (SI) | 16 | 25.0 | 8.0 |
| imipenem | >90 | 0.75g q6h (SI) | 8 | 82.6 | 64.0 |
| imipenem | >90 | 0.75g q6h (SI) | 16 | 29.3 | 11.0 |
| imipenem | >90 | 1g q6h (SI) | 8 | 93.1 | 80.5 |
| imipenem | >90 | 1g q6h (SI) | 16 | 56.1 | 31.0 |
| imipenem | >90 | 0.75g q8h (EI) | 8 | 82.5 | 64.0 |
| imipenem | >90 | 0.75g q8h (EI) | 16 | 10.8 | 3.0 |
| imipenem | >90 | 0.5g q6h (EI) | 8 | 72.4 | 53.0 |
| imipenem | >90 | 0.5g q6h (EI) | 16 | 4.9 | 1.0 |
| imipenem | >90 | 1g q8h (EI) | 8 | 97.2 | 89.0 |
| imipenem | >90 | 1g q8h (EI) | 16 | 39.4 | 19.5 |
| imipenem | >90 | 0.75g q6h (EI) | 8 | 98.4 | 93.0 |
| imipenem | >90 | 0.75g q6h (EI) | 16 | 39.2 | 18.0 |
| imipenem | >90 | 1g q6h (EI) | 8 | 99.9 | 100.0 |
| imipenem | >90 | 1g q6h (EI) | 16 | 74.6 | 53.0 |
| imipenem | >90 | 4g q24h (CI) | 8 | 96.2 | 94.5 |
| imipenem | >90 | 4g q24h (CI) | 16 | 32.5 | 33.0 |
Most cells sit at 0% or 100% for any plausible model, so the gate below uses only the informative cells, those the paper reports strictly between 5% and 95%.
pta_informative <- pta_cmp |>
  dplyr::filter(pta_pub > 5, pta_pub < 95) |>
  dplyr::group_by(drug, stratum) |>
  dplyr::summarise(cells = dplyr::n(), median_abs_diff = median(abs(diff)),
                   median_diff = median(diff), .groups = "drop")
pta_informative |>
  dplyr::rename("Drug" = drug, "CLcr stratum" = stratum, "Cells" = cells,
                "Median |sim - published| (points)" = median_abs_diff,
                "Median sim - published (points)" = median_diff) |>
knitr::kable(digits = 1, caption = "Agreement on the informative cells (published PTA between 5% and 95%).")| Drug | CLcr stratum | Cells | Median |sim - published| (points) | Median sim - published (points) |
|---|---|---|---|---|
| ceftazidime | 30-60 | 45 | 10.8 | 10.8 |
| ceftazidime | 60-90 | 50 | 4.2 | 4.2 |
| ceftazidime | >90 | 59 | 1.6 | -0.9 |
| imipenem | 30-60 | 57 | 5.9 | 5.9 |
| imipenem | 60-90 | 61 | 2.4 | 2.3 |
| imipenem | >90 | 74 | 16.6 | -16.6 |
gate_60_90 <- dplyr::filter(pta_informative, stratum == "60-90")
gate_all <- pta_cmp |>
  dplyr::filter(pta_pub > 5, pta_pub < 95) |>
  dplyr::group_by(drug) |>
  dplyr::summarise(median_abs_diff = median(abs(diff)), .groups = "drop")
# The cohort is drawn with base R, so these numbers are identical on every
# machine. Measured: 60-90 mL/min stratum (which contains both reference
# creatinine clearances) 4.2 points for ceftazidime and 2.4 for imipenem;
# all informative cells 3.9 and 6.4. As a mutation control, multiplying
# either drug's typical clearance by 1.5 or 0.75 moved its 60-90 median to
# 28-45 points and its all-cell median to 12.6-43.9 points, so both bounds
# fail on a clearance error of that size.
stopifnot(
  nrow(gate_60_90) == 2,
  all(gate_60_90$median_abs_diff < 8),
  all(gate_all$median_abs_diff < 10)
)
The agreement is closest in the 60-90 mL/min stratum. In the 30-60 mL/min stratum the simulation runs 6-11 points above the published values, which suggests the published cohort sat higher within that stratum than the uniform distribution assumed here. The largest discrepancy is the imipenem stratum above 90 mL/min, where the simulation runs about 17 points below the paper. There the published values are almost the same as, and for some regimens higher than, the 60-90 mL/min values (for example 0.75 g q8h SI at MIC 8 mg/L: 51.5% at 60-90 and 52.1% above 90 mL/min). With a positive clearance exponent, every patient above 90 mL/min clears the drug faster than the same patient would at 60-90 mL/min, so the top stratum must show a clearly lower PTA whatever its creatinine-clearance distribution. This stratum of Table S4 therefore cannot be reproduced from the published model; it is reported here and left out of the stratum-level gate.
Assumptions and deviations
-
IIV scale. Methods 2.3 defines
omegaas the standard deviation of the log-normal random effect (the Monolix convention), so the Table 2 percentages are taken as SDs and squared:etalcl ~ 0.208^2andetalvc ~ 0.13^2for ceftazidime,0.294^2and0.107^2for imipenem. The imipenem file previously read the same percentages, via the Zhang 2025 review, as apparent CVs (log(1 + CV^2)); the primary settles it, and the imipenem variances are now 4% (CL) and 0.6% (V) larger. - Imipenem IIV: text versus table. Results 3.3 gives the imipenem IIV as 12.9% (V) and 30% (CL), while Table 2 gives 10.7% and 29.4%. The ceftazidime values agree between text and table (13% and 20.8%). The Table 2 values are used; they also agree with the Zhang 2025 review.
-
Table 2 typographic slip. The imipenem bootstrap
97.5% bound for Vd is printed as
17284; it is evidently 17.284 L. It is not used by the model. - Covariate centring values. The reference creatinine clearances (69.02 and 75.54 mL/min) are the observation-weighted means described in Methods 2.3, printed in the Results 3.3 equations, and are not the Table 1 medians (62.9 and 76.6 mL/min).
-
Creatinine clearance scale. Cockcroft-Gault in raw
mL/min (not normalised to 1.73 m^2), supplied in the canonical
CRCLcolumn. - Race. The paper does not tabulate race or ethnicity; the single-site Hanoi cohort is recorded as Asian.
- Infusion duration. The study’s infusion durations varied between patients and are not tabulated, so the model takes the infusion duration from the event table. Figure 3 is compared qualitatively with a 0.5 h infusion profile.
- PTA simulation. The published PTA simulation does not state how creatinine clearance was distributed inside each stratum, nor an upper limit for the top stratum; uniform distributions (30-60, 60-90 and 90-150 mL/min) were assumed. fT>MIC is computed on individual predictions (no residual error) over the last dosing interval before 72 h, and the continuous-infusion loading dose is given as a bolus (the Table S3 footnote says so for ceftazidime; the imipenem loading dose is treated the same way). The published tables list a 0.75 g q8h imipenem regimen that is not named in Methods 2.4; it is simulated as tabulated.
-
Screened covariates. Age, sex, weight, fat-free
mass, body mass index, serum creatinine, diuretic use and invasive
ventilation are recorded as
covariatesDataExcludedin both files (Supplementary Table S2). The Anthonisen score, respiratory distress and the MDRD-4 estimate were also screened and are described inpopulation$notes. - No correction notice is linked to this article in Europe PMC as of 2026-09-28.