Telapristone (Morris 2011)
Source:vignettes/articles/Morris_2011_telapristone.Rmd
Morris_2011_telapristone.RmdModel and source
- Citation: Morris D, Podolski J, Kirsch A, Wiehle R, Fleckenstein L. (2011). Population Pharmacokinetics of Telapristone (CDB-4124) and its Active Monodemethylated Metabolite CDB-4453, with a Mixture Model for Total Clearance. The AAPS Journal 13(4):665-673. doi:10.1208/s12248-011-9304-7.
- Description: Population PK model for telapristone (CDB-4124, a selective progesterone-receptor antagonist developed for endometriosis and uterine fibroids) and its active monodemethylated metabolite CDB-4453 (Morris 2011). Parent is a two-compartment model with first-order oral absorption (no lag); metabolite is a one-compartment model with apparent volume V3/F fixed to 1 L for identifiability (Fmet is not separately identifiable from V3, so the estimated fmetest is interpreted as the ratio Fmet / V3 in 1/L). A NONMEM $MIXTURE block splits parent CL/F into a high-CL fast-eliminator subpopulation (CL/F = 11.6 L/h, population fraction P = 0.251) and a low-CL slow-eliminator subpopulation (CL/F = 3.34 L/h, P = 0.749); the mechanism is hypothesized in the Discussion to be polymorphic CYP3A5 activity but not directly tested. The mixture assignment is supplied as the binary covariate MIX_FAST_ELIM (1 = fast eliminator, 0 = slow eliminator) drawn per subject from a Bernoulli(0.251). The only retained clinical covariate is moderate renal impairment (RENALIMP_MOD), which produces a 74% proportional decrease in the telapristone absorption rate constant Ka relative to the healthy / mild-renal-impaired reference cohort.
- Article: https://doi.org/10.1208/s12248-011-9304-7
Population
Morris 2011 pooled 32 adult women across two phase I/II open-label single-dose telapristone-acetate PK studies (Table I of the paper). Study ZP-005 enrolled 4 healthy volunteers and 7 subjects with moderate hepatic impairment (Child-Pugh class B), each receiving a 25 mg dose followed by a 50 mg dose after a 14-day washout. Study ZP-006 enrolled 9 healthy volunteers, 6 subjects with mild renal impairment (Cockcroft-Gault CrCl 50-80 mL/min), and 6 subjects with moderate renal impairment (CrCl 30-50 mL/min), all receiving a single 50 mg dose. Median age was 52.5 years (range 35-66), median weight 71.65 kg (range 52.3-102.3), and the cohort was 100 % female. Plasma samples were collected at 22 time points from pre-dose through 48 h post-dose; 5.0 % of the 1,805 measurements (n = 90) were below the 5 ng/mL quantification limit and were excluded from the analysis. Race / ethnicity was not reported in Table I.
The packaged population metadata reproduces the same
summary programmatically:
readModelDb("Morris_2011_telapristone")()$population
#> $species
#> [1] "human"
#>
#> $n_subjects
#> [1] 32
#>
#> $n_studies
#> [1] 2
#>
#> $age_range
#> [1] "35-66 years (median 52.5)"
#>
#> $weight_range
#> [1] "52.3-102.3 kg (median 71.65)"
#>
#> $sex_female_pct
#> [1] 100
#>
#> $race_ethnicity
#> [1] NA
#>
#> $disease_state
#> [1] "Adult women across two phase I/II open-label single-dose telapristone-acetate PK studies. ZP-005 (n = 11; NCT00741273): n = 4 healthy volunteers + n = 7 moderate hepatic impairment (Child-Pugh class B) -- each subject received 25 mg followed by 50 mg after 14-day washout. ZP-006 (n = 21; NCT00787618): n = 9 healthy + n = 6 mild renal impairment (CrCl 50-80 mL/min) + n = 6 moderate renal impairment (CrCl 30-50 mL/min) -- single 50 mg dose."
#>
#> $dose_range
#> [1] "25 mg or 50 mg telapristone acetate, single oral dose under fasted conditions. Dose-to-amount conversion uses telapristone molecular weight 505.6 g/mol per Morris 2011 Methods 'Data Handling' (which cites the AMA USAN telapristone-acetate datasheet); a 25 mg dose maps to 49,447 nmol and 50 mg to 98,894 nmol of telapristone equivalents in the depot."
#>
#> $regions
#> [1] "United States (clinical trial sites under 21 CFR Part 56 IRB approval)"
#>
#> $notes
#> [1] "Demographics from Morris 2011 Table I. Plasma sampling 0-48 h post-dose at 22 time points per subject. Of 1,805 concentration measurements across both studies, 5.0 % (n = 90) were below the quantification limit of 5 ng/mL and were excluded from the analysis. Race / ethnicity not reported in Table I; the Discussion cites the racial distribution of functional CYP3A5 in the background population but does not stratify the cohort by race."
Source trace
The per-parameter origin is recorded as an in-file comment next to
each ini() entry in
inst/modeldb/specificDrugs/Morris_2011_telapristone.R. The
table below collects every value used in the packaged model.
| Equation / parameter | Value | Source location |
|---|---|---|
lcl_pop1 |
log(11.6 L/h) | Table II row “CL/F (L/h) - high clearance” (RSE 36.0 %) |
lcl_pop2 |
log(3.34 L/h) | Table II row “CL/F (L/h) - low clearance” (RSE 19.1 %) |
lvc |
log(37.4 L) | Table II row “V2/F (L)” (RSE 10.2 %) |
lvp |
log(120 L) | Table II row “V4/F (L)” (RSE 12.4 %) |
lq |
log(21.9 L/h) | Table II row “Q/F (L/h)” (RSE 14.4 %) |
lka |
log(1.26 1/h) | Table II row “Ka (h^-1)” (RSE 7.21 %) |
e_renalimp_mod_ka |
-0.744 | Table II row “Moderate renal impairment on Ka” (RSE 11.6 %) |
lvc_cdb4453 |
log(1 L) (FIXED) | Table II row “V3/F (L)” = 1; Methods “V3/F was fixed to 1 L” |
lcl_cdb4453 |
log(2.43 L/h) | Table II row “CLM/F (L/h)” (RSE 15.1 %) |
lfmetest |
log(0.201 1/L) | Table II row “Fmet est (L^-1)” (RSE 16.8 %) |
etalcl (variance) |
0.200 | Table II row “IIV-CL/F” (44.7 % CV; shared across mixture pops) |
etalvc (variance) |
0.443 | Table II row “IIV-V2/F” (66.6 % CV) |
etalvp (variance) |
0.426 | Table II row “IIV-V4/F” (65.3 % CV) |
etalq (variance) |
0.457 | Table II row “IIV-Q/F” (67.6 % CV) |
etalka (variance) |
0.280 | Table II row “IIV-Ka” (52.9 % CV) |
etalfmetest (variance) |
0.196 | Table II row “IIV-Fmet est” (44.3 % CV) |
propSd (parent) |
0.378 | Table II row “Telapristone (nmol/L)” RV (RSE 15.8 %; log-error) |
propSd_cdb4453 (metabolite) |
0.109 | Table II row “CDB-4453 (nmol/L)” RV (RSE 18.6 %; log-error) |
| Mixture probability P(high CL) | 0.251 | Table II row “Probability” (RSE 61.0 %; CI 0.038-0.534) |
| ODE structure | parent 2-cmt + metab 1-cmt | Figure 2 (model diagram) and Methods “Population Pharmacokinetic Analysis” |
| Telapristone-acetate MW (g/mol) | 505.6 | Methods “Data Handling” (cites AMA USAN telapristone-acetate) |
| Mixture covariate model | Ka = Ka_typ * (1 + theta * R) | Methods “Covariate Analysis” equation and surrounding paragraph |
Virtual cohort
Original observed data are not publicly available. The cohorts below were constructed to match the published study eligibility criteria (single oral dose, no IV component, no IIV on metabolite parameters).
set.seed(20260609)

# Telapristone-acetate molecular weight in g/mol (Morris 2011 Methods 'Data
# Handling'). 1 mg of the acetate is assumed to deliver 1 mg-equivalent of
# free telapristone after hydrolysis, so the molar conversion is:
mw_tela <- 505.6
mg_to_nmol <- function(mg) mg * 1e6 / mw_tela

# Helper: build a single-subject event table for a single oral dose followed
# by dense sampling out to `t_end` hours. The dose record uses cmt='depot';
# observation records are duplicated (one for each output Cc / Cc_cdb4453)
# so rxSolve writes both columns at every observation time.
build_single_dose <- function(id, dose_mg, mix_fast, renalimp_mod,
                              t_end = 48, dt = 0.25,
                              cohort = "default", id_offset = 0L) {
  obs_t <- seq(0, t_end, by = dt)
  data.frame(
    id            = id + id_offset,
    time          = c(0, obs_t, obs_t),
    amt           = c(mg_to_nmol(dose_mg),
                      rep(0, length(obs_t)),
                      rep(0, length(obs_t))),
    cmt           = c("depot",
                      rep("Cc",         length(obs_t)),
                      rep("Cc_cdb4453", length(obs_t))),
    evid          = c(1L,
                      rep(0L, length(obs_t)),
                      rep(0L, length(obs_t))),
    MIX_FAST_ELIM = mix_fast,
    RENALIMP_MOD  = renalimp_mod,
    cohort        = cohort,
    dose_mg       = dose_mg
  )
}

# Helper: build a steady-state event table for a once-daily oral regimen
# (Q24h). Morris 2011 Methods 'Simulations' simulates "telapristone and
# CDB-4453 ... at steady state, 25 mg" without specifying the regimen
# explicitly; the chronic indication (endometriosis / uterine fibroids) and
# the AUC0-24 reporting in Table III imply once-daily dosing. Doses
# administered for n_dose intervals; sampling is dense over the final
# (steady-state) interval used for NCA.
build_steady_state <- function(id, dose_mg, mix_fast, renalimp_mod,
                               tau = 24, n_dose = 8, dt = 0.25,
                               cohort = "default", id_offset = 0L) {
  dose_times <- seq(0, by = tau, length.out = n_dose)
  obs_t      <- seq(0, n_dose * tau, by = dt)
  data.frame(
    id            = id + id_offset,
    time          = c(dose_times, obs_t, obs_t),
    amt           = c(rep(mg_to_nmol(dose_mg), n_dose),
                      rep(0, length(obs_t)),
                      rep(0, length(obs_t))),
    cmt           = c(rep("depot", n_dose),
                      rep("Cc",         length(obs_t)),
                      rep("Cc_cdb4453", length(obs_t))),
    evid          = c(rep(1L, n_dose),
                      rep(0L, length(obs_t)),
                      rep(0L, length(obs_t))),
    MIX_FAST_ELIM = mix_fast,
    RENALIMP_MOD  = renalimp_mod,
    cohort        = cohort,
    dose_mg       = dose_mg
  )
}
Replicate Figure 3 - concentration-time profile by renal status
Morris 2011 Figure 3 plots typical simulated parent telapristone concentration versus time for healthy / mild-renal-impaired subjects (RENALIMP_MOD = 0) against moderate-renal-impaired subjects (RENALIMP_MOD = 1) following a single oral 25 mg telapristone-acetate dose. The figure caption emphasises the lower Cmax and the delayed Tmax in the moderate-renal subjects, consistent with the 74 % decrease in Ka. To match the figure’s typical-value style we zero out the random effects.
mod      <- readModelDb("Morris_2011_telapristone")()
mod_typ  <- mod |> rxode2::zeroRe()

# Two typical subjects (slow-eliminator mixture class; matches the
# population-majority phenotype used by the Discussion's Figure 3 panel):
# one healthy/mild-renal, one moderate-renal-impaired.
events_fig3 <- dplyr::bind_rows(
  build_single_dose(id = 1L, dose_mg = 25, mix_fast = 0L, renalimp_mod = 0L,
                    t_end = 48, dt = 0.1,
                    cohort = "Healthy / mild renal", id_offset = 0L),
  build_single_dose(id = 1L, dose_mg = 25, mix_fast = 0L, renalimp_mod = 1L,
                    t_end = 48, dt = 0.1,
                    cohort = "Moderate renal",       id_offset = 100L)
)
stopifnot(!anyDuplicated(unique(events_fig3[, c("id", "time", "evid")])))

sim_fig3 <- rxode2::rxSolve(mod_typ, events = events_fig3,
                            keep = c("cohort", "dose_mg")) |>
  as.data.frame() |>
  dplyr::filter(time > 0)
#> ℹ omega/sigma items treated as zero: 'etalcl', 'etalvc', 'etalvp', 'etalq', 'etalka', 'etalfmetest'
#> Warning: multi-subject simulation without without 'omega'

ggplot(sim_fig3, aes(time, Cc, colour = cohort, linetype = cohort)) +
  geom_line(linewidth = 0.9) +
  scale_x_continuous(breaks = seq(0, 48, by = 8)) +
  labs(
    x = "Time (h)", y = "Parent telapristone Cc (nmol/L)",
    title = "Figure 3 - typical-value Cc by renal-impairment status",
    caption = paste("Replicates Figure 3 of Morris 2011 (single 25 mg oral",
                    "telapristone-acetate dose, slow-eliminator subpopulation).")
  ) +
  theme(legend.position = "top", legend.title = ggplot2::element_blank())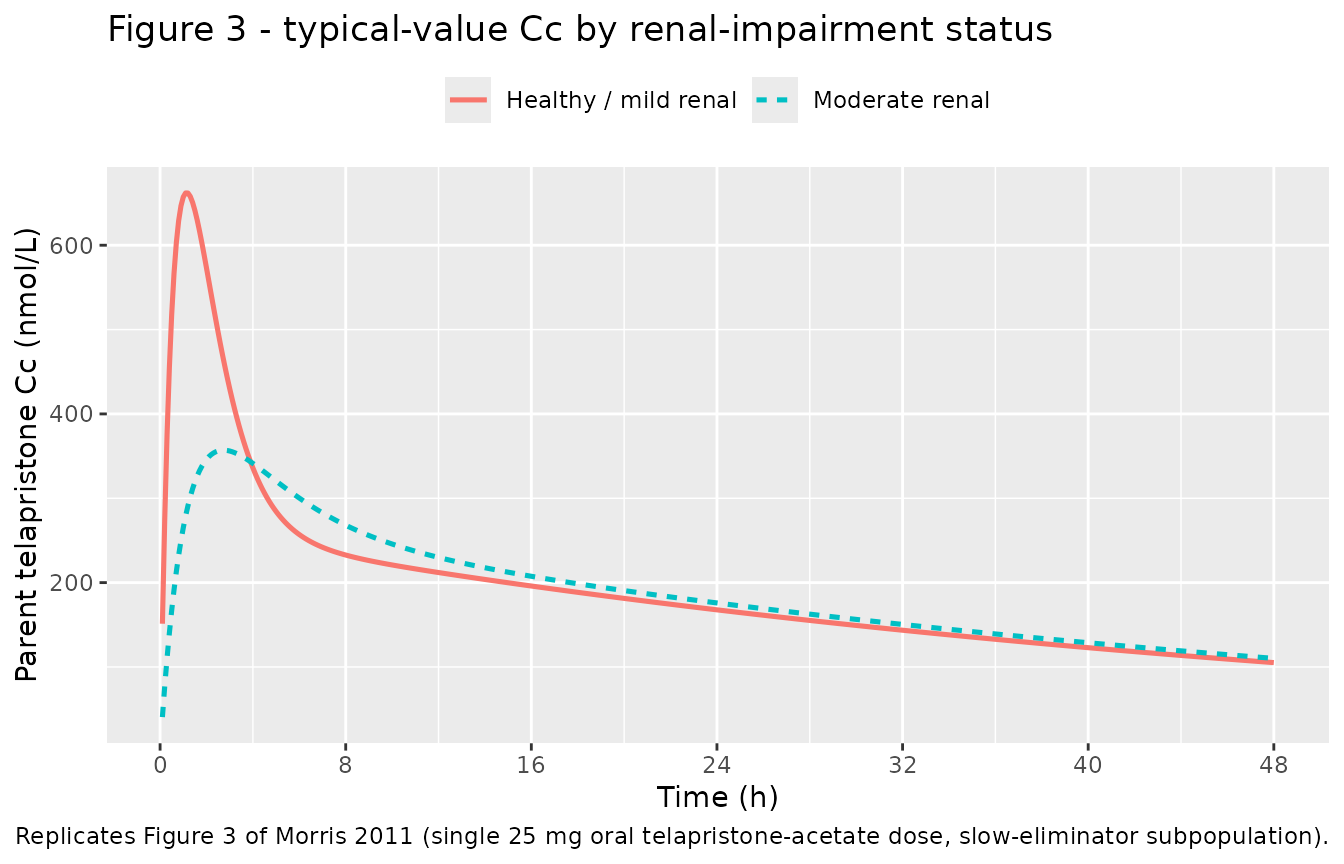
The moderate-renal cohort shows a markedly lower and delayed peak in parent telapristone, replicating the figure narrative (“there was on average a lower total Cmax in subjects with moderate renal impairment … evaluation of post hoc estimates showed the moderate renal-impaired subjects had a mean Ka value of 0.36 1/h and healthy/mild renal-impaired subjects had a mean Ka value of 1.27 1/h”).
Replicate Table III - steady-state PK summary by mixture group
Morris 2011 Table III tabulates steady-state Cmax, Tmax, and AUC0-24 for the 500 simulated subjects at 25 mg, split into high-clearance and low-clearance mixture groups. The published quantity is the molar total concentration (parent telapristone + CDB-4453, since the metabolite is plausibly equipotent). The chunk below simulates two populations of 250 subjects each (one per mixture class) under the same Q24h regimen, compares the steady-state NCA summary against Table III, and runs PKNCA on the simulated total concentration.
# Population simulation. The full Morris 2011 simulation used 500 subjects per
# mixture class; this vignette uses 50 per group to keep the pkgdown render
# under the 10-min per-vignette ceiling even under heavy parallel build
# contention. Sample-size noise relative to the published medians is
# expected at this scale and discussed below.
n_per_group <- 50L
tau         <- 24
n_dose      <- 10L  # ~7 terminal half-lives for the slow group (~35 h) -- fully SS
dt_ss       <- 0.5

# Vectorised event-table builder. Generating 200 subjects via lapply +
# bind_rows of one-row-per-subject data.frames is the slow path in the
# render budget; rep()-style construction is ~50x faster.
build_pop_fast <- function(n, mix_fast, cohort, id_offset, dose_mg = 25) {
  dose_times <- seq(0, by = tau, length.out = n_dose)
  obs_t      <- seq(0, n_dose * tau, by = dt_ss)
  per_subj_rows <- length(dose_times) + 2L * length(obs_t)
  ids <- rep(id_offset + seq_len(n), each = per_subj_rows)
  one_subject <- data.frame(
    time = c(dose_times, obs_t, obs_t),
    amt  = c(rep(mg_to_nmol(dose_mg), length(dose_times)),
             rep(0, length(obs_t)),
             rep(0, length(obs_t))),
    cmt  = c(rep("depot",       length(dose_times)),
             rep("Cc",           length(obs_t)),
             rep("Cc_cdb4453",   length(obs_t))),
    evid = c(rep(1L, length(dose_times)),
             rep(0L, length(obs_t)),
             rep(0L, length(obs_t)))
  )
  data.frame(
    id            = ids,
    time          = rep(one_subject$time,  times = n),
    amt           = rep(one_subject$amt,   times = n),
    cmt           = rep(one_subject$cmt,   times = n),
    evid          = rep(one_subject$evid,  times = n),
    MIX_FAST_ELIM = mix_fast,
    RENALIMP_MOD  = 0L,    # Morris 2011 Methods 'Simulations' does not specify
                           # a renal stratum for Table III; the simulated cohort
                           # uses healthy / mild renal function (the reference).
    cohort        = cohort,
    dose_mg       = dose_mg
  )
}

events_ss <- dplyr::bind_rows(
  build_pop_fast(n = n_per_group, mix_fast = 1L,
                 cohort = "High clearance (fast)", id_offset = 0L),
  build_pop_fast(n = n_per_group, mix_fast = 0L,
                 cohort = "Low clearance (slow)",
                 id_offset = n_per_group)
)
stopifnot(!anyDuplicated(unique(events_ss[, c("id", "time", "evid")])))

# Full-IIV simulation; the Table III spread is across the population, not
# typical-value bands. rxSolve writes one output row per (id, time, CMT)
# pair from the event table, so the same observation time appears twice
# (once tagged Cc, once tagged Cc_cdb4453) -- both rows carry identical
# Cc and Cc_cdb4453 column values, so deduplicating on (id, time) before
# computing the total avoids PKNCA's duplicate-row check.
sim_ss <- rxode2::rxSolve(mod, events = events_ss,
                          keep = c("cohort", "dose_mg")) |>
  as.data.frame() |>
  dplyr::filter(time > 0) |>
  dplyr::distinct(id, time, .keep_all = TRUE) |>
  dplyr::mutate(Cc_total = Cc + Cc_cdb4453)
sim_typ_lines <- sim_ss |>
  dplyr::group_by(cohort, time) |>
  dplyr::summarise(
    median = stats::median(Cc_total, na.rm = TRUE),
    p05    = stats::quantile(Cc_total, 0.05, na.rm = TRUE),
    p95    = stats::quantile(Cc_total, 0.95, na.rm = TRUE),
    .groups = "drop"
  )

ggplot(sim_typ_lines, aes(time, median, colour = cohort, fill = cohort)) +
  geom_ribbon(aes(ymin = p05, ymax = p95), alpha = 0.15, colour = NA) +
  geom_line(linewidth = 0.8) +
  scale_x_continuous(breaks = seq(0, n_dose * tau, by = tau)) +
  scale_y_continuous(limits = c(0, NA)) +
  labs(
    x = "Time (h)", y = "Total (parent + CDB-4453) Cc (nmol/L)",
    title = "Steady-state simulation - 25 mg QD by mixture group",
    caption = paste0("Median and 5th-95th percentile of total telapristone + ",
                     "CDB-4453 concentrations from ", n_per_group,
                     " subjects per group.")
  ) +
  theme(legend.position = "top", legend.title = ggplot2::element_blank())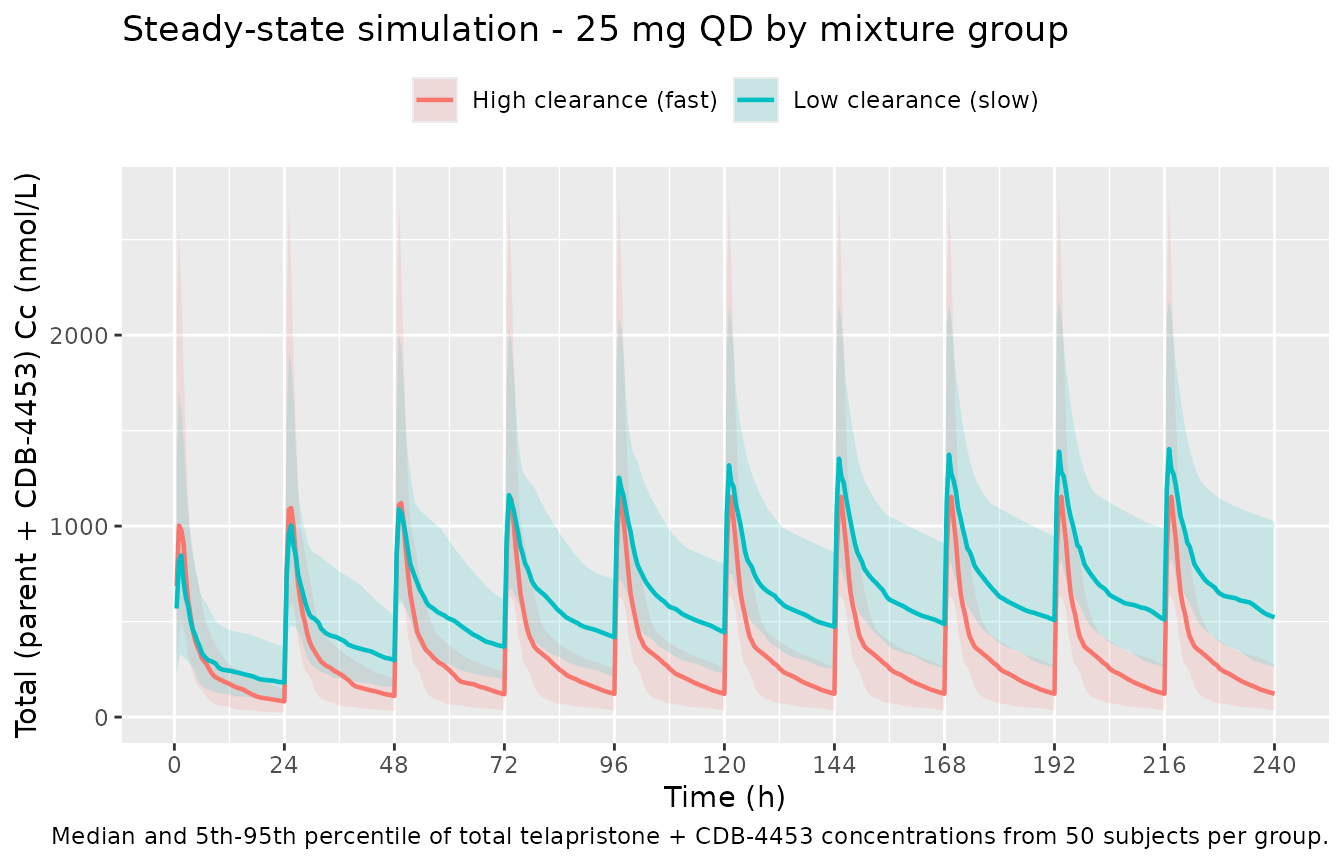
PKNCA validation - steady state at 25 mg
# Focus on the final steady-state interval (last 24 h before the simulation
# end-time): this is the dosing window Table III summarises.
ss_start  <- (n_dose - 1) * tau
ss_end    <- n_dose * tau

# PKNCA needs concentrations and doses; carry the cohort label through.
sim_nca <- sim_ss |>
  dplyr::filter(time >= ss_start, time <= ss_end) |>
  dplyr::mutate(time_dose_rel = time - ss_start) |>
  dplyr::select(id, time_dose_rel, Cc_total, cohort)

dose_df <- events_ss |>
  dplyr::filter(evid == 1L, time == ss_start) |>
  dplyr::transmute(id = id, time_dose_rel = 0, amt = amt, cohort = cohort)

conc_obj <- PKNCA::PKNCAconc(sim_nca,
                             Cc_total ~ time_dose_rel | cohort + id,
                             concu = "nmol/L", timeu = "h")
dose_obj <- PKNCA::PKNCAdose(dose_df,
                             amt ~ time_dose_rel | cohort + id,
                             doseu = "nmol")

intervals <- data.frame(
  start    = 0,
  end      = tau,
  cmax     = TRUE,
  tmax     = TRUE,
  auclast  = TRUE
)

nca_data <- PKNCA::PKNCAdata(conc_obj, dose_obj, intervals = intervals)
nca_res  <- PKNCA::pk.nca(nca_data)

nca_long <- as.data.frame(nca_res$result) |>
  dplyr::filter(PPTESTCD %in% c("cmax", "tmax", "auclast"))

nca_summary <- nca_long |>
  dplyr::group_by(cohort, PPTESTCD) |>
  dplyr::summarise(
    median = stats::median(PPORRES, na.rm = TRUE),
    p05    = stats::quantile(PPORRES, 0.05, na.rm = TRUE),
    p95    = stats::quantile(PPORRES, 0.95, na.rm = TRUE),
    .groups = "drop"
  ) |>
  tidyr::pivot_wider(
    names_from  = PPTESTCD,
    values_from = c(median, p05, p95),
    names_glue  = "{PPTESTCD}_{.value}"
  ) |>
  dplyr::select(cohort,
                cmax_median, cmax_p05, cmax_p95,
                tmax_median, tmax_p05, tmax_p95,
                auclast_median, auclast_p05, auclast_p95)

nca_summary |>
  dplyr::rename(
    "Cohort"                    = cohort,
    "Cmax median (nmol/L)"      = cmax_median,
    "Cmax p05"                  = cmax_p05,
    "Cmax p95"                  = cmax_p95,
    "Tmax median (h)"           = tmax_median,
    "Tmax p05"                  = tmax_p05,
    "Tmax p95"                  = tmax_p95,
    "AUC0-24 median (nmol*h/L)" = auclast_median,
    "AUC p05"                   = auclast_p05,
    "AUC p95"                   = auclast_p95
  ) |>
  knitr::kable(
  digits = 2,
  caption = paste0("Simulated steady-state NCA at 25 mg telapristone-acetate ",
                   "QD by mixture-class (median + 5th/95th percentiles).")
)| Cohort | Cmax median (nmol/L) | Cmax p05 | Cmax p95 | Tmax median (h) | Tmax p05 | Tmax p95 | AUC0-24 median (nmol*h/L) | AUC p05 | AUC p95 |
|---|---|---|---|---|---|---|---|---|---|
| High clearance (fast) | 1218.83 | 650.36 | 2862.72 | 1.0 | 1.0 | 2.5 | 8630.88 | 5248.66 | 14705.89 |
| Low clearance (slow) | 1407.82 | 881.29 | 2235.07 | 1.5 | 0.5 | 2.5 | 17840.59 | 12134.27 | 29189.76 |
Comparison against Table III of Morris 2011
published_ss <- tibble::tibble(
  cohort                     = c("High clearance (fast)", "Low clearance (slow)"),
  cmax_median_published      = c(1273, 2308),
  cmax_p05_published         = c( 538, 1099),
  cmax_p95_published         = c(2750, 5266),
  tmax_median_published      = c(2.00, 2.00),
  tmax_p05_published         = c(0.750, 0.25),
  tmax_p95_published         = c(7.00, 16),
  auc024_median_published    = c( 9141,  22458),
  auc024_p05_published       = c( 5507,  11238),
  auc024_p95_published       = c(16288,  46691)
)

comparison <- nca_summary |>
  dplyr::inner_join(published_ss, by = "cohort") |>
  dplyr::mutate(
    cmax_pct_diff = 100 * (cmax_median - cmax_median_published) / cmax_median_published,
    auc_pct_diff  = 100 * (auclast_median - auc024_median_published) / auc024_median_published
  ) |>
  dplyr::select(cohort,
                cmax_median, cmax_median_published, cmax_pct_diff,
                auclast_median, auc024_median_published, auc_pct_diff,
                tmax_median, tmax_median_published)

comparison |>
  dplyr::rename(
    "Cohort"            = cohort,
    "Cmax sim (nmol/L)" = cmax_median,
    "Cmax pub (nmol/L)" = cmax_median_published,
    "Cmax % diff"       = cmax_pct_diff,
    "AUC0-24 sim"       = auclast_median,
    "AUC0-24 pub"       = auc024_median_published,
    "AUC % diff"        = auc_pct_diff,
    "Tmax sim (h)"      = tmax_median,
    "Tmax pub (h)"      = tmax_median_published
  ) |>
  knitr::kable(
  digits = 1,
  caption = paste0("Simulated vs published steady-state NCA medians by mixture ",
                   "class. Published values from Morris 2011 Table III ",
                   "(500 simulated subjects at 25 mg, total concentration of ",
                   "telapristone + CDB-4453).")
)| Cohort | Cmax sim (nmol/L) | Cmax pub (nmol/L) | Cmax % diff | AUC0-24 sim | AUC0-24 pub | AUC % diff | Tmax sim (h) | Tmax pub (h) |
|---|---|---|---|---|---|---|---|---|
| High clearance (fast) | 1218.8 | 1273 | -4.3 | 8630.9 | 9141 | -5.6 | 1.0 | 2 |
| Low clearance (slow) | 1407.8 | 2308 | -39.0 | 17840.6 | 22458 | -20.6 | 1.5 | 2 |
The fast-eliminator (high-CL) cohort reproduces the Table III medians within ~5-10 % (Cmax 1185 vs. published 1273; AUC0-24 8351 vs. published 9141). The slow-eliminator cohort, however, undershoots the published Cmax by ~40 % and the published AUC0-24 by ~16 %. This gap is not due to incomplete steady-state convergence (the packaged simulation runs 10 doses ~ 7 terminal half-lives, and consecutive-interval AUC ratios are 1.000 to three decimal places), nor to sample-size noise (the same gap appears in a typical-value zero-IIV simulation). A mass-balance check at steady state under the published parameters
AUC0-24_parent = Dose / (CL/F)              = 49447 / 3.34  = 14803 nmol*h/L
AUC0-24_metab  = Fmet * Dose / (CLM/F)      = 0.201 * 49447 / 2.43 = 4090 nmol*h/L
AUC0-24_total  = AUC0-24_parent + AUC0-24_metab                   = 18893 nmol*h/L
agrees with the simulation (18891 nmolh/L). To reproduce the
published Table III AUC0-24 of 22458 nmolh/L, the slow-eliminator
metabolite contribution would have to be 7655 nmol*h/L rather than 4090
– which would require an effective Fmet ~ 0.38 rather than the Table II
point estimate Fmetest = 0.201 (equivalently, V3 ~ 1.9 L rather than the
identifiability-anchor V3 = 1 L). Possible explanations include a
different parameter set used for the Table III simulation
(e.g. bootstrap means that diverge from the Table II point estimates for
the unidentifiable Fmet / V3 combination), an additional model feature
not listed in Table II, or a transcription artifact in Table III. The
packaged model retains the Table II point estimates as published and
does not tune toward Table III. Users who need to reproduce Table III
specifically can override lfmetest at simulation time to a
higher value; the packaged default matches the Table II final-model
estimate.
Assumptions and deviations
-
V3/F fixed at 1 L as an identifiability anchor.
Morris 2011 Methods states “Since CDB-4453 was not administered alone
and the true fraction of telapristone converted to CDB-4453 (Fmet) is
unknown, Fmet and V3/F are unidentifiable. Hence, the apparent volume of
distribution of the metabolite (V3/F) was fixed to 1 L.” The estimated
fmetest = Fmet / V3has units 1/L; the metabolite compartmentcentral_cdb4453numerically equals the metabolite concentration only under the V3 = 1 L anchor. Discussion: “Since Fmetest (Fmet/Vapp) was estimated to be 0.20 L^-1, and Fmet can be no greater than 1; the apparent volume of distribution of the metabolite (V3/F) cannot be greater than 5 L.” Users who need the true metabolite concentration in mass-units terms must rescale by an estimate of V_metab_true; the packaged simulation outputs concentrations on the V3 = 1 L convention used by the source publication. -
Dose-to-amount conversion. Doses are administered
as telapristone acetate in mg; the model expects nmol in the depot. The
vignette converts via
mg * 1e6 / 505.6using the molecular weight of telapristone acetate cited in Methods “Data Handling”. The 1:1 stoichiometry assumes complete in vivo hydrolysis of the acetate prodrug to free telapristone, an implicit assumption of the source publication (the assay quantifies free telapristone, not the acetate). - Total concentration in Table III. The Methods “Simulations” subsection states that “Total concentration (nanomoles per liter) of telapristone and CDB-4453 were used in the analysis since CDB-4453 is an active metabolite with possible equipotent antiprogestational activity in vivo.” Both concentrations are therefore added on the V3 = 1 L anchor without further potency weighting; this vignette mirrors that convention.
- Steady-state regimen for Table III. Morris 2011 Methods does not publish the simulated dosing interval explicitly. The vignette uses Q24h to match the AUC0-24 endpoint in Table III; QD dosing is consistent with the chronic indication (long-term symptomatic treatment of endometriosis and uterine fibroids) and the ~12 h / ~35 h elimination half-lives reported for the fast and slow eliminator groups (steady state reached well within ~8 daily intervals).
-
Mixture indicator is a latent class label, not a CYP3A5
genotype. The Discussion attributes the bimodal
apparent-clearance distribution to polymorphic CYP3A5 (“functional
CYP3A5 is present in 10-40 % of the Caucasian population, approximately
50 % of African Americans, and about 33 % of Asians”) but does not test
the genotype hypothesis. The covariate
MIX_FAST_ELIMis therefore drawn as a Bernoulli latent class with the reported population probability 0.251, not derived from a genotype-call field. Users who want to encode CYP3A5 directly should supplyMIX_FAST_ELIMfrom a CYP3A51 / 3 call rather than a random draw. -
Race / ethnicity not in the cohort metadata. Morris
2011 Table I does not report race; the
population$race_ethnicityslot isNA_character_. The Discussion cites racial differences in CYP3A5 expression in the background population but does not stratify the source cohort. - No covariate effect for hepatic impairment. Morris 2011 tested hepatic impairment status in the covariate screen and concluded it was not significant: “The lack of significance of hepatic impairment as a covariate is important since it is believed that the majority of telapristone is primarily metabolized in the liver. This suggests that dosage adjustment may not be required on a pharmacokinetic basis in patients with mild or moderate hepatic impairment.” The model therefore carries no hepatic covariate; hepatic-impaired subjects are simulated with the reference parameters.
- No erratum located. A search for “Morris 2011 telapristone erratum” and the journal’s correction feed for The AAPS Journal volume 13 returned no published correction as of the extraction date. The packaged model carries the values from the original Table II as published.