Model and source
- Citation: Liu H, Yu Y, Liu L, Wang C, Guo N, Wang X, Xiang X, Han B. (2022). Application of physiologically-based pharmacokinetic/pharmacodynamic models to evaluate the interaction between nifedipine and apatinib. Frontiers in Pharmacology 13:970539. doi:10.3389/fphar.2022.970539.
- Description: Direct (ordinary, hyperbolic) Emax pharmacodynamic model of the change in systolic blood pressure (SBP) produced by the nifedipine plasma concentration in adults, the PD layer of the Liu 2022 nifedipine PBPK/PD model used to evaluate the CYP3A4-mediated drug-drug interaction with apatinib (Liu 2022 equation 3). The concentration-effect relationship is direct, with no effect compartment and no baseline term: the output dsbp is the drug-induced change in SBP (mmHg), negative for a reduction. Only this PD layer is reproduced here: the PK layer is a Simcyp minimal-PBPK model whose clearance is entered as recombinant CYP3A4 / CYP3A5 Vmax and Km per pmol of enzyme and whose controlled- release absorption uses an ADAM model with an unprinted Weibull dissolution profile, so it cannot be reproduced from the publication (see the vignette ‘Assumptions and deviations’). The nifedipine plasma concentration is therefore supplied by the user as the canonical PD-driver covariate CEFFECT (ng/mL). Emax and EC50 were set by the authors (EC50 from the literature, Emax chosen as the best of a range of literature values) rather than estimated, and no inter-individual variability or residual-error model is reported, so the model is typical-value only.
- Article: https://doi.org/10.3389/fphar.2022.970539 (open access, PMC9462537)
Apatinib, a VEGFR-2 tyrosine kinase inhibitor, causes hypertension in most treated patients, and nifedipine is the antihypertensive most often used for it. Apatinib also inhibits CYP3A4, the main clearance pathway of nifedipine, and raises nifedipine exposure. Liu 2022 asks whether that pharmacokinetic interaction also produces a clinically important pharmacodynamic interaction – an excessive fall in blood pressure – by chaining three pieces:
- a Simcyp v16 minimal-PBPK model of nifedipine (immediate-release tablet with first-order absorption; controlled-release tablet with the ADAM absorption model and a Weibull dissolution profile);
- the authors’ previously published Simcyp PBPK model of apatinib (Liu
2021), linked to nifedipine through competitive CYP3A4 inhibition
(
Ki = 0.12 uM,fu,mic = 0.65); - an ordinary Emax model (equation 3) relating the nifedipine plasma concentration to the change in systolic blood pressure (SBP).
Only the third component, the PD layer, is packaged in
nlmixr2lib. The reasoning is in Assumptions and deviations: the
two PBPK layers are Simcyp platform models whose clearance is entered
per pmol of recombinant enzyme and whose controlled-release absorption
depends on a dissolution profile the paper does not print, so they
cannot be reproduced from the publication. The PD layer is fully
specified by the paper and is self-contained once the nifedipine plasma
concentration is supplied through the CEFFECT
covariate.
mod <- readModelDb("Liu_2022_nifedipine")
mod
#> function() {
#>   description <- paste(
#>     "Direct (ordinary, hyperbolic) Emax pharmacodynamic model of the change in",
#>     "systolic blood pressure (SBP) produced by the nifedipine plasma",
#>     "concentration in adults, the PD layer of the Liu 2022 nifedipine",
#>     "PBPK/PD model used to evaluate the CYP3A4-mediated drug-drug",
#>     "interaction with apatinib (Liu 2022 equation 3). The concentration-effect",
#>     "relationship is direct, with no effect compartment and no baseline term:",
#>     "the output dsbp is the drug-induced change in SBP (mmHg), negative for a",
#>     "reduction. Only this PD layer is reproduced here: the PK layer is a",
#>     "Simcyp minimal-PBPK model whose clearance is entered as recombinant",
#>     "CYP3A4 / CYP3A5 Vmax and Km per pmol of enzyme and whose controlled-",
#>     "release absorption uses an ADAM model with an unprinted Weibull",
#>     "dissolution profile, so it cannot be reproduced from the publication",
#>     "(see the vignette 'Assumptions and deviations'). The nifedipine plasma",
#>     "concentration is therefore supplied by the user as the canonical PD-driver",
#>     "covariate CEFFECT (ng/mL). Emax and EC50 were set by the authors (EC50",
#>     "from the literature, Emax chosen as the best of a range of literature",
#>     "values) rather than estimated, and no inter-individual variability or",
#>     "residual-error model is reported, so the model is typical-value only.",
#>     sep = " "
#>   )
#>   reference <- paste(
#>     "Liu H, Yu Y, Liu L, Wang C, Guo N, Wang X, Xiang X, Han B. (2022).",
#>     "Application of physiologically-based pharmacokinetic/pharmacodynamic",
#>     "models to evaluate the interaction between nifedipine and apatinib.",
#>     "Frontiers in Pharmacology 13:970539. doi:10.3389/fphar.2022.970539.",
#>     sep = " "
#>   )
#>   vignette <- "Liu_2022_nifedipine"
#>   units <- list(
#>     time = "h",
#>     dosing = "(not applicable; nifedipine plasma concentration is supplied as the CEFFECT covariate, not as a dose record)",
#>     concentration = "ng/mL (nifedipine plasma concentration via CEFFECT; the PD output dsbp is in mmHg)"
#>   )
#>
#>   covariateData <- list(
#>     CEFFECT = list(
#>       description = "Nifedipine plasma concentration (ng/mL), supplied as the direct driver of the Emax reduction in systolic blood pressure",
#>       units = "ng/mL",
#>       type = "continuous",
#>       reference_category = NULL,
#>       notes = paste(
#>         "Member of the canonical PD-driver family CEFFECT; here the biophase is",
#>         "plasma itself, because Liu 2022 relates the change in SBP directly to",
#>         "the nifedipine concentration through an ordinary Emax model (equation",
#>         "3) with no effect compartment, citing 'a close and direct relationship",
#>         "between circulating drug concentrations and antihypertensive effect'",
#>         "(Discussion). EC50 is given as 12.12 ng/mL, so CEFFECT must be in",
#>         "ng/mL; the paper does not say whether this is total or unbound",
#>         "concentration, and every nifedipine concentration it reports",
#>         "(Tables 3 and 4, Figures 1 and 2) is total plasma, so total plasma is",
#>         "assumed. In the source study CEFFECT is the plasma profile predicted",
#>         "by the authors' Simcyp v16 minimal-PBPK model (Table 1: fu 0.039,",
#>         "B/P 0.685, Vss 0.57 L/kg, IR first-order ka 4.6 1/h with fa 1, CR",
#>         "tablet via ADAM, rCYP3A4 Vmax 22 pmol/min/pmol and Km 10.95 uM,",
#>         "rCYP3A5 Vmax 3.5 pmol/min/pmol and Km 31.9 uM). Its predicted mean",
#>         "Cmax was 26.51 ng/mL after 60 mg CR and 144.59 ng/mL after 20 mg IR",
#>         "in healthy volunteers (Table 3), and 20.97 ng/mL (alone) versus",
#>         "29.51 ng/mL (with apatinib 750 mg once daily, competitive CYP3A4",
#>         "inhibition, Ki 0.12 uM, fu,mic 0.65) after 30 mg CR (Table 4). That",
#>         "model is not reproduced in this file and cannot be reproduced from",
#>         "the publication. Users supply CEFFECT from their own nifedipine PK",
#>         "model or from observed plasma concentrations; set it to 0 for",
#>         "drug-free records."
#>       ),
#>       source_name = "C (Liu 2022 equation 3)"
#>     )
#>   )
#>
#>   population <- list(
#>     species = "human",
#>     n_subjects = NA_integer_,
#>     n_studies = NA_integer_,
#>     age_range = "26-65 years (Simcyp virtual populations)",
#>     weight_range = "not reported",
#>     sex_female_pct = 50,
#>     disease_state = paste(
#>       "PD layer checked against published mean SBP changes in hypertensive",
#>       "patients (Figure 3; Toal 2012 for 60 mg CR, single 10 mg IR dose) and",
#>       "then applied to virtual cancer patients and patients with Child-Pugh",
#>       "A / B / C hepatic impairment receiving apatinib"
#>     ),
#>     dose_range = paste(
#>       "Nifedipine single oral doses: 60 mg and 30 mg controlled-release (CR)",
#>       "tablet, 10 mg, 20 mg and 30 mg immediate-release (IR) tablet; with or",
#>       "without apatinib 750 mg orally once daily for 8 days (nifedipine on",
#>       "day 6)."
#>     ),
#>     regions = "China (authors' institution; Sim-Chinese population for the DDI verification)",
#>     notes = paste(
#>       "No subject-level data were fitted. The PD parameters are literature",
#>       "values: EC50 12.12 ng/mL 'reported ... for nifedipine at the regular",
#>       "doses' (Hirasawa 1985; Levine 2003; Meredith and Elliott 2004;",
#>       "Niu 2021), and Emax -30 mmHg selected as the best-fitting value from",
#>       "the literature range against observed mean SBP changes after 60 mg CR",
#>       "and 10 mg IR nifedipine in hypertensive patients (Results",
#>       "'Verification of pharmacodynamic model for nifedipine'; Table 5).",
#>       "All simulations in the paper used Simcyp virtual populations of",
#>       "100 subjects aged 26-65 years, 50% female (24 subjects for the",
#>       "Sim-Chinese DDI verification), so n_subjects and n_studies are not",
#>       "applicable."
#>     )
#>   )
#>
#>   ini({
#>     # ------------------------------------------------------------------
#>     # Liu 2022 equation 3 (Methods, 'Development and verification of
#>     # pharmacodynamic model for nifedipine'):
#>     #
#>     #          Emax * C
#>     #   E = -----------
#>     #        EC50 + C
#>     #
#>     # 'An ordinary Emax model (Eq. 3) was used to describe the relationship
#>     # between nifedipine concentration and the change of SBP ... The Emax
#>     # and EC50 were obtained from literature, which were set at -30 mmHg
#>     # and 12.12 ng/ml, respectively.'
#>     #
#>     # The paper's Emax is signed (-30 mmHg, a reduction). Here the magnitude
#>     # 30 mmHg is carried on the log scale and the sign is applied in
#>     # model(), so dsbp = -emax * C / (ec50 + C) reproduces equation 3.
#>     # ------------------------------------------------------------------
#>
#>     lemax <- fixed(log(30))
#>     label("Log of the Emax magnitude, maximum nifedipine-induced reduction in systolic blood pressure (mmHg)")
#>     # Liu 2022 Methods PD paragraph: Emax 'set at -30 mmHg'. Results,
#>     # 'Verification of pharmacodynamic model for nifedipine': 'When the Emax
#>     # was set to -30 mmHg, the PD model fitted best.' Discussion: chosen from
#>     # the 'range of Emax values reported in the literature' by comparing
#>     # predicted and observed SBP changes. A selected value with no standard
#>     # error, so it is fixed.
#>
#>     lec50 <- fixed(log(12.12))
#>     label("Log of EC50, nifedipine plasma concentration giving half the maximum SBP reduction (ng/mL)")
#>     # Liu 2022 Methods PD paragraph: EC50 'set at ... 12.12 ng/ml'.
#>     # Discussion: 'The EC50 was reported to be 12.12 ng/ml for nifedipine at
#>     # the regular doses ... So, the EC50 value was set to 12.12 ng/ml in this
#>     # study.' A literature value, not estimated, so it is fixed.
#>
#>     addSd <- fixed(0)
#>     label("Additive residual SD on the change in systolic blood pressure (mmHg; zero, no residual-error model is reported)")
#>   })
#>
#>   model({
#>     # 1. Nifedipine plasma concentration for this record, ng/mL, supplied
#>     #    through the canonical CEFFECT covariate column. The link is direct
#>     #    (no effect compartment), as in Liu 2022 equation 3.
#>     conc <- CEFFECT
#>
#>     # 2. Typical-value PD parameters; no IIV is reported.
#>     emax <- exp(lemax)
#>     ec50 <- exp(lec50)
#>
#>     # 3. Liu 2022 equation 3 with the signed Emax of -30 mmHg: the
#>     #    drug-induced change in SBP (mmHg), negative for a reduction.
#>     dsbp <- -emax * conc / (ec50 + conc)
#>
#>     # 4. Observation. addSd is fixed at zero because the source reports no
#>     #    residual-error model; free it to refit to individual SBP data.
#>     dsbp ~ add(addSd)
#>   })
#> }
#> <environment: 0x5613d92a95c8>
Population
No subject-level data were fitted. Every simulation in the paper used Simcyp virtual populations of 100 subjects aged 26-65 years, half of them female (24 subjects of the Sim-Chinese population for the DDI verification against Zhu 2020). The PD layer was checked against published mean SBP changes in hypertensive patients after a single 60 mg controlled-release (CR) tablet and a single 10 mg immediate-release (IR) tablet (Figure 3, Table 5), and was then applied to virtual cancer patients (Table 6, Figure 4) and to patients with Child-Pugh A, B and C hepatic impairment (Table 7), each with and without apatinib 750 mg once daily.
str(rxode2::rxode(readModelDb("Liu_2022_nifedipine"))$population)
#> List of 10
#>  $ species       : chr "human"
#>  $ n_subjects    : int NA
#>  $ n_studies     : int NA
#>  $ age_range     : chr "26-65 years (Simcyp virtual populations)"
#>  $ weight_range  : chr "not reported"
#>  $ sex_female_pct: num 50
#>  $ disease_state : chr "PD layer checked against published mean SBP changes in hypertensive patients (Figure 3; Toal 2012 for 60 mg CR,"| __truncated__
#>  $ dose_range    : chr "Nifedipine single oral doses: 60 mg and 30 mg controlled-release (CR) tablet, 10 mg, 20 mg and 30 mg immediate-"| __truncated__
#>  $ regions       : chr "China (authors' institution; Sim-Chinese population for the DDI verification)"
#>  $ notes         : chr "No subject-level data were fitted. The PD parameters are literature values: EC50 12.12 ng/mL 'reported ... for "| __truncated__
Source trace
The per-parameter origin is recorded as an in-file comment next to
each ini() entry in
inst/modeldb/specificDrugs/Liu_2022_nifedipine.R. The table
below collects them in one place.
| Equation / parameter | Value | Source location |
|---|---|---|
dsbp <- -emax * conc / (ec50 + conc) |
n/a | Equation 3, Methods “Development and verification of pharmacodynamic model for nifedipine” |
conc <- CEFFECT (direct link, no effect
compartment) |
n/a | Equation 3 uses the concentration C directly;
Discussion: “a close and direct relationship between circulating drug
concentrations and antihypertensive effect” |
lemax (Emax) |
30 mmHg magnitude (paper: -30 mmHg), fixed | Methods PD paragraph “set at -30 mmHg”; Results “When the Emax was set to -30 mmHg, the PD model fitted best” |
lec50 (EC50) |
12.12 ng/mL, fixed | Methods PD paragraph “set at … 12.12 ng/ml”; Discussion “the EC50 value was set to 12.12 ng/ml in this study” |
addSd |
0 (fixed) | No residual-error model is reported |
| (no IIV) | n/a | No inter-individual variability is reported for the PD parameters |
Units
| Symbol | Quantity | Units |
|---|---|---|
CEFFECT / conc
|
nifedipine plasma concentration | ng/mL (EC50 is given in ng/ml) |
ec50 |
half-maximal plasma concentration | ng/mL |
emax, dsbp
|
reduction / change in systolic blood pressure | mmHg (Table 5 and Figure 3 units) |
time |
time | h (Figures 3 and 4) |
conc / (ec50 + conc) is a ratio of concentrations and
therefore unitless, so dsbp carries the units of
emax (mmHg). The model has no ODE state and no dose record;
time only orders the records and does not enter any
equation.
Simulation
The model is an algebraic map from a nifedipine plasma concentration
to a change in SBP. A simulation is therefore a set of observation
records carrying the CEFFECT covariate. Because the model
declares no eta, do not pass
omega = NA or apply rxode2::zeroRe().
conc_values <- seq(0, 250, by = 0.5)
conc_grid <- data.frame(
  id = 1L,
  time = seq_along(conc_values),
  CEFFECT = conc_values,
  evid = 0L,
  amt = 0
)

sim <- rxode2::rxSolve(mod, events = conc_grid) |>
  as.data.frame()

head(sim[, c("CEFFECT", "dsbp")])
#>   CEFFECT      dsbp
#> 1     0.0  0.000000
#> 2     0.5 -1.188590
#> 3     1.0 -2.286585
#> 4     1.5 -3.303965
#> 5     2.0 -4.249292
#> 6     2.5 -5.129959
Concentration-effect curve
The paper does not plot the concentration-effect curve itself, so the figure below marks on it the mean predicted nifedipine Cmax values the paper prints for its PBPK simulations (Tables 3 and 4).
printed_cmax <- tibble::tribble(
  ~scenario, ~CEFFECT,
  "60 mg CR, healthy (Table 3)", 26.51,
  "20 mg IR, healthy (Table 3)", 144.59,
  "30 mg CR alone (Table 4)", 20.97,
  "30 mg CR + apatinib (Table 4)", 29.51
) |>
  mutate(dsbp = -30 * CEFFECT / (12.12 + CEFFECT))

ggplot(sim, aes(CEFFECT, dsbp)) +
  geom_line(linewidth = 0.9) +
  geom_hline(yintercept = -30, linetype = "dashed", colour = "grey50") +
  geom_point(data = printed_cmax, aes(colour = scenario), size = 2.6) +
  labs(
    x = "Nifedipine plasma concentration (ng/mL)",
    y = "Change in SBP (mmHg)",
    colour = NULL,
    title = "Liu 2022 equation 3: change in SBP versus nifedipine concentration",
    caption = paste(
      "Dashed line: Emax = -30 mmHg.",
      "Points: mean predicted Cmax printed in Liu 2022 Tables 3 and 4."
    )
  ) +
  theme(legend.position = "bottom", legend.direction = "vertical")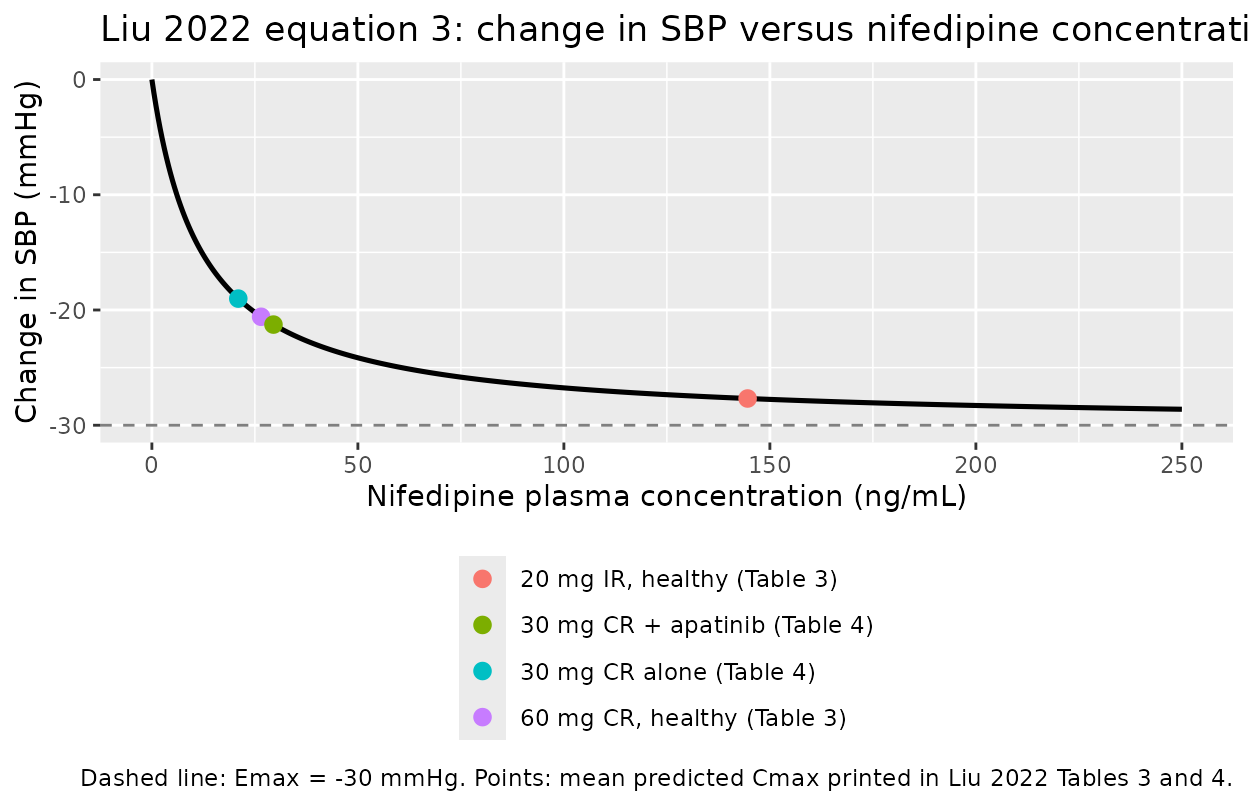
Validation
NCA is not an applicable validation for this model: there is no dose, no compartment and no concentration-time profile to integrate. The checks below follow the pattern for mechanistic models: definitional identities, boundary behaviour, and agreement with the summary values the paper prints. Every quantity is deterministic (the model has no random effects), so the identity checks use tight tolerances; where a bound is looser it is because the paper’s value comes from a different calculation, explained alongside.
Definitional identities
These hold by algebra and must match to solver precision. A wrong
ec50 moves the half-maximal point and breaks the second
identity immediately; a wrong emax breaks the second and
third.
anchor <- rxode2::rxSolve(
  mod,
  events = data.frame(
    id = 1L, time = 1:3, evid = 0L, amt = 0,
    CEFFECT = c(0, 12.12, 1e9)
  )
) |>
  as.data.frame()

identities <- tibble::tibble(
  Property = c(
    "C = 0 gives no change",
    "C = EC50 gives Emax / 2",
    "C -> infinity gives Emax"
  ),
  Expected = c(0, -15, -30),
  Model = anchor$dsbp
)
knitr::kable(identities, digits = 6,
caption = "Definitional identities of the ordinary Emax model.")| Property | Expected | Model |
|---|---|---|
| C = 0 gives no change | 0 | 0 |
| C = EC50 gives Emax / 2 | -15 | -15 |
| C -> infinity gives Emax | -30 | -30 |
stopifnot(
  isTRUE(all.equal(anchor$dsbp[1], 0)),
  isTRUE(all.equal(anchor$dsbp[2], -15, tolerance = 1e-10)),
  isTRUE(all.equal(anchor$dsbp[3], -30, tolerance = 1e-6))
)
The change in SBP must also fall monotonically with concentration and can never go beyond Emax:
Maximum SBP reduction against the paper’s printed exposures
With a direct Emax link the largest SBP reduction a subject
experiences, Rmax, occurs at that subject’s Cmax, so
Rmax_i = f(Cmax_i). The paper prints mean predicted Cmax
for the 30 mg CR DDI design (Table 4) and mean predicted Rmax for 30 mg
CR in virtual cancer patients with and without apatinib (Table 6).
Because f is concave, the mean of the individual
Rmax values is smaller in magnitude than
f(mean Cmax) (Jensen’s inequality), so the model evaluated
at the printed mean Cmax should slightly overshoot the printed mean
Rmax, never undershoot it.
ddi <- tibble::tibble(
  Arm = c("30 mg CR alone", "30 mg CR + apatinib"),
  `Mean Cmax, Table 4 (ng/mL)` = c(20.97, 29.51),
  `Mean Rmax, Table 6 (mmHg)` = c(-18.62, -20.30)
)

ddi_sim <- rxode2::rxSolve(
  mod,
  events = data.frame(
    id = 1L, time = 1:2, evid = 0L, amt = 0,
    CEFFECT = ddi$`Mean Cmax, Table 4 (ng/mL)`
  )
) |>
  as.data.frame()

ddi <- ddi |>
  mutate(
    `Model f(mean Cmax) (mmHg)` = ddi_sim$dsbp,
    `Difference (%)` = 100 * (`Model f(mean Cmax) (mmHg)` -
      `Mean Rmax, Table 6 (mmHg)`) / `Mean Rmax, Table 6 (mmHg)`
  )
knitr::kable(ddi, digits = 2,
caption = "Model SBP reduction at the printed mean Cmax versus the printed mean Rmax.")| Arm | Mean Cmax, Table 4 (ng/mL) | Mean Rmax, Table 6 (mmHg) | Model f(mean Cmax) (mmHg) | Difference (%) |
|---|---|---|---|---|
| 30 mg CR alone | 20.97 | -18.62 | -19.01 | 2.10 |
| 30 mg CR + apatinib | 29.51 | -20.30 | -21.27 | 4.76 |
stopifnot(
  # Jensen direction: the model at the mean Cmax is at least as large a
  # reduction as the paper's mean of individual maxima.
  all(ddi$`Model f(mean Cmax) (mmHg)` <= ddi$`Mean Rmax, Table 6 (mmHg)`),
  # Size: a wrong EC50 or Emax moves these by tens of percent. Achieved:
  # +2.1% and +4.8%.
  all(abs(ddi$`Difference (%)`) < 10)
)
Table 4 comes from the Sim-Chinese DDI-verification population (24 subjects) and Table 6 from the virtual cancer-patient population (100 subjects), so the two tables do not describe exactly the same cohort; the agreement within 5% is nevertheless what the paper’s Emax and EC50 imply.
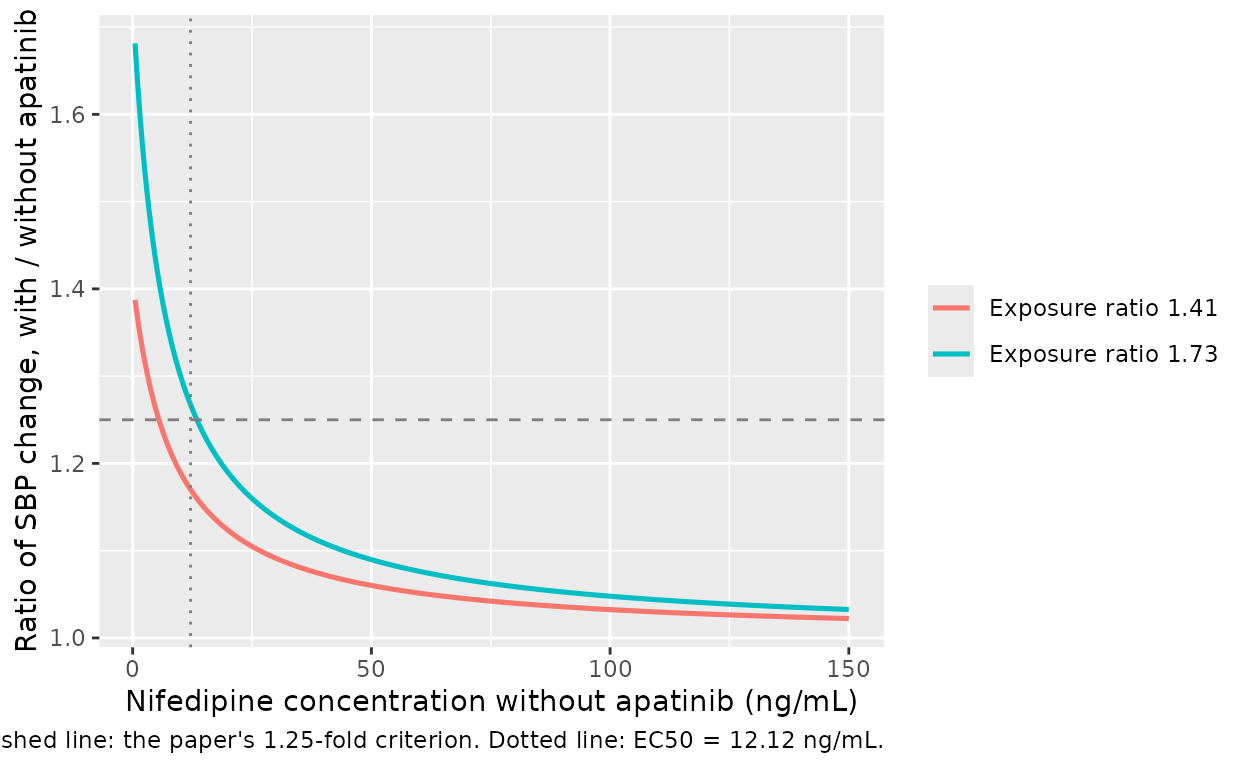
The pharmacodynamic interaction is attenuated by saturation
The paper’s central conclusion is that a 1.41-fold rise in nifedipine
Cmax (and 1.73-fold rise in AUC) with apatinib changes the SBP response
by no more than 1.25-fold. Equation 3 alone explains why: for a
concentration increase by a factor R, the effect increases by the factor
R (EC50 + C) / (EC50 + R C), which is R at very low concentration and
falls towards 1 as C approaches and passes EC50.
ratio_model <- ddi_sim$dsbp[2] / ddi_sim$dsbp[1]
attenuation <- tibble::tibble(
  Quantity = c(
    "Cmax ratio, with / without apatinib (Table 4)",
    "Rmax ratio, paper (Table 6, 30 mg CR)",
    "Rmax ratio, model at the Table 4 mean Cmax"
  ),
  Value = c(1.41, 1.09, ratio_model)
)
knitr::kable(attenuation, digits = 3)| Quantity | Value |
|---|---|
| Cmax ratio, with / without apatinib (Table 4) | 1.410 |
| Rmax ratio, paper (Table 6, 30 mg CR) | 1.090 |
| Rmax ratio, model at the Table 4 mean Cmax | 1.119 |
stopifnot(
  isTRUE(all.equal(
    ratio_model,
    1.41 * (12.12 + 20.97) / (12.12 + 1.41 * 20.97),
    tolerance = 1e-2
  )),
  ratio_model < 1.25,
  abs(ratio_model - 1.09) < 0.05
)
base_conc <- seq(0.5, 150, by = 0.5)
atten_curve <- bind_rows(
  tibble::tibble(CEFFECT = base_conc, r = 1.41),
  tibble::tibble(CEFFECT = base_conc, r = 1.73)
) |>
  mutate(
    effect_ratio = r * (12.12 + CEFFECT) / (12.12 + r * CEFFECT),
    label = paste0("Exposure ratio ", r)
  )

ggplot(atten_curve, aes(CEFFECT, effect_ratio, colour = label)) +
  geom_line(linewidth = 0.9) +
  geom_hline(yintercept = 1.25, linetype = "dashed", colour = "grey50") +
  geom_vline(xintercept = 12.12, linetype = "dotted", colour = "grey50") +
  labs(
    x = "Nifedipine concentration without apatinib (ng/mL)",
    y = "Ratio of SBP change, with / without apatinib",
    colour = NULL,
    caption = paste(
      "Dashed line: the paper's 1.25-fold criterion.",
      "Dotted line: EC50 = 12.12 ng/mL."
    )
  )
Comparison with the PD-verification table (Table 5)
Table 5 compares predicted and observed Rmax in hypertensive patients. The paper does not print the nifedipine Cmax of the hypertensive-patient simulations, so the nearest printed exposures are the healthy-volunteer predictions of Table 3. For the 10 mg IR tablet, the 20 mg IR Cmax is halved (the PBPK model has linear clearance at these doses). These are indicative comparisons across populations, not validation gates.
t5 <- tibble::tibble(
  `Dose (Table 5)` = c("60 mg CR", "10 mg IR"),
  `Exposure used (ng/mL)` = c(26.51, 144.59 / 2),
  `Exposure source` = c("Table 3, 60 mg CR Cmax", "Table 3, 20 mg IR Cmax / 2"),
  `Predicted Rmax, Table 5 (mmHg)` = c(-22.21, -30.13),
  `Observed Rmax, Table 5 (mmHg)` = c(-23.09, -33.20)
) |>
  mutate(`Model f(Cmax) (mmHg)` = -30 * `Exposure used (ng/mL)` /
    (12.12 + `Exposure used (ng/mL)`))
knitr::kable(t5, digits = 2)| Dose (Table 5) | Exposure used (ng/mL) | Exposure source | Predicted Rmax, Table 5 (mmHg) | Observed Rmax, Table 5 (mmHg) | Model f(Cmax) (mmHg) |
|---|---|---|---|---|---|
| 60 mg CR | 26.51 | Table 3, 60 mg CR Cmax | -22.21 | -23.09 | -20.59 |
| 10 mg IR | 72.30 | Table 3, 20 mg IR Cmax / 2 | -30.13 | -33.20 | -25.69 |
The printed predicted Rmax of -30.13 mmHg for 10 mg IR is beyond the model’s Emax of -30 mmHg, and the 5th percentile of the predicted curve in Figure 3B reaches about -33 mmHg. No concentration can produce that with a single deterministic Emax of -30 mmHg, so the paper’s Simcyp PD simulation must have carried between-subject variability on Emax and/or EC50 that the paper does not report. This is recorded under Assumptions and deviations.
Assumptions and deviations
-
PBPK layers not reproduced. The nifedipine PK layer
is a Simcyp v16 minimal-PBPK model. Its clearance is entered as
recombinant CYP3A4 and CYP3A5 Vmax (pmol/min/pmol of enzyme) and Km
(Table 1). Turning those into a hepatic and gut-wall clearance needs the
enzyme abundances, microsomal protein per gram of liver, liver weight,
hepatic blood flow and the intersystem extrapolation factors of the
Simcyp population library, none of which the paper prints, and no
in-vivo clearance is given to anchor them. The CR tablet is absorbed
through the ADAM model with a Weibull dissolution profile taken from
Doki 2017 whose parameters are not printed either. The apatinib layer is
a separate Simcyp model (Liu 2021) whose clearance is also entered per
mg of microsomal protein. The PK layers therefore cannot be reproduced
from the publication, and the nifedipine plasma concentration is
supplied through
CEFFECT. The printed Table 1 compound inputs are kept in theCEFFECTnotes of the model file for provenance. -
Total plasma concentration. Equation 3 uses
“nifedipine concentration” without saying total or unbound. Every
concentration the paper reports is total plasma (Tables 3 and 4, Figures
1 and 2), and the EC50 of 12.12 ng/mL is a total-plasma literature
value, so
CEFFECTis total plasma. -
Emax and EC50 are fixed. Both were set rather than
estimated: EC50 from the literature, Emax chosen as the best of a range
of literature values by comparing predicted with observed SBP changes.
Neither carries a standard error, so both are wrapped in
fixed(). -
No between-subject variability. The paper reports
none for the PD layer, but its predicted mean Rmax for 10 mg IR (-30.13
mmHg, Table 5) is beyond Emax, and Figures 3 and 4 show 5th-95th
percentile bands, so the Simcyp PD simulation must have included
variability on Emax and/or EC50 (probably the platform default). Its
magnitude is not reported and is not invented here; the model is
typical-value only and
addSdis fixed at zero. -
Sign convention. The paper’s Emax is signed (-30
mmHg). The model carries the magnitude on the log scale
(
lemax = log(30)) and applies the sign inmodel(), sodsbpis negative for a reduction, matching equation 3 and Figures 3 and 4. - AUE is not checked. The area under the effect-time curve (Tables 5 to 7) depends on the full predicted concentration-time course of the virtual populations, which the paper shows only as raster mean curves for a different population (Figure 2, Sim-Chinese DDI design) than its AUE tables. The windows over which AUE was integrated are also not stated (Tables 5 and 6 give 433.98 and 787.55 mmHg*h for the same 60 mg CR Rmax of -22.21 mmHg).
- No erratum. A Europe PMC search on 2026-10-09 found no correction notice for this article and no supplementary material.