RLYB212 (Moc Willeford 2024)
Source:vignettes/articles/MocWilleford_2024_rlyb212.Rmd
MocWilleford_2024_rlyb212.RmdModel and source
- Citation: Moc Willeford C, Shetty K, Sheridan D, Engler F. Informing pregnancy dose via target-mediated drug disposition modeling and simulations for a recombinant human monoclonal antibody. CPT Pharmacometrics Syst Pharmacol. 2024;13(11):2002-2015.
- Article (open access): doi:10.1002/psp4.13250
- Supplement (open access): psp413250-sup-0001-supinfo.pdf
RLYB212 is a fully human anti-HPA-1a IgG1 monoclonal antibody in
clinical development as a prophylactic subcutaneous therapy to prevent
maternal alloimmunisation to fetal HPA-1a and the resulting fetal /
neonatal alloimmune thrombocytopenia (FNAIT). The paper develops a
target-mediated drug disposition (TMDD) model that simultaneously fits
RLYB212 pharmacokinetics and HPA-1a-positive platelet dynamics in
HPA-1b/b healthy volunteers (pooled from studies IPA2001 and IPA2003).
The novel scientific contribution is a threshold-gated phagocytic
elimination arm in which coated platelets are cleared at rate
kphag only once receptor occupancy exceeds a fixed
threshold of 10%. Simulations use simple allometric scaling (0.75 on
clearances, 1 on volumes) together with gestational-age-based scaling on
central volume and body weight to propose a Q4W SC 0.06 mg dose with a
0.12 mg loading dose as the recommended regimen for a planned phase II
study in pregnant women.
Population
Moc Willeford 2024 Table S1 summarises the two phase-1 studies that contributed data to the TMDD model:
- N (PK): 21 HPA-1b/b male healthy volunteers.
- N (PD): 11 volunteers with measurable HPA-1a-positive platelet observations (all from IPA2003).
- Study IPA2001: first-in-human single-blind placebo-controlled safety / PK study. Cohort 1 received 0.21 mg SC once (n=6 active, n=2 placebo); Cohort 2 received 0.29 mg SC on Day 1 followed by 0.1 mg SC every 2 weeks for 10 additional weeks (n=6 active, n=2 placebo).
- Study IPA2003: proof-of-concept single-blind placebo-controlled study to test whether RLYB212 accelerates elimination of transfused HPA-1a-positive platelets. Volunteers received a single 0.09 mg or 0.29 mg SC dose on Day 1; on Day 8 all subjects received an IV transfusion of 10 x 10^9 HPA-1a-positive (HPA-1a/b heterozygous) platelets.
- Sex: male only.
- Dataset: the final PK analysis included 295 measurable observations from 21 subjects (Table S3); the final PD analysis included 117 measurable HPA-1a-positive platelet observations from 11 subjects (Table S4).
Subject-level demographics are otherwise not enumerated in the paper.
The same information is available programmatically via
readModelDb("MocWilleford_2024_rlyb212")()$population.
Source trace
Per-parameter provenance is recorded next to each ini()
entry in
inst/modeldb/specificDrugs/MocWilleford_2024_rlyb212.R. The
table below collects them in one place.
| Element | Source | Value / form |
|---|---|---|
| Ka | Table 2 | 0.0058 1/h (RSE 0.05%) |
| CL/F | Table 2 | 0.0119 L/h (RSE 0.3%) |
| V1/F (drug + target central) | Table 2 | 4.61 L (RSE 0.4%) |
| V2/F (drug peripheral) | Table 2 | 5.61 L (RSE 0.06%) |
| Q/F | Table 2 | 0.693 L/h (RSE 3.8%) |
| kdeg | Table 2 | 0.0123 1/h (RSE 0.4%) |
| QP (target inter-cmpt.) | Table 2 | 2.45 L/h (RSE 1.7%) |
| V3 (target peripheral) | Table 2 | 0.523 L (RSE 2.6%) |
| kon (fixed) | Table 2 | 1.43 1/(nM*h), internal data |
| koff (fixed) | Table 2 | 0.0001 1/h, bivalent avidity value |
| kphagocytosis | Table 2 | 0.197 1/h (RSE 2.3%) |
| THRES (fixed) | Table 2 | 10 percent (estimation ranged 3-22 percent) |
| PK residual (proportional) | Table 2 | 0.152 (RSE 1.2%) |
| PD residual (proportional) | Table 2 | 0.148 (RSE 0.8%) |
| Allometric exponents (fixed) | Table 1 / Methods | 0.75 on CL / Q / QP; 1 on V1 / V2 / V3 |
| IIV Ka (omega^2) | Table 2 | 0.634 (RSE 25.7%, shrinkage 6.5%) |
| IIV V1 (omega^2) | Table 2 | 0.137 (RSE 66.8%, shrinkage 16.6%) |
| IIV CL (omega^2) | Table 2 | 0.0388 (RSE 53.6%, shrinkage 9.7%) |
| IIV kphagocytosis (omega^2) | Table 2 | 0.401 (RSE 41.9%, shrinkage 37.9%) |
| ODE system | Supplement page 3 | 6 states: drug depot / central / peripheral; target central / peripheral; drug-target complex. RO = 100 * complex / (target + complex); SWI = 1 if RO > THRES else 0. |
The paper uses NONMEM
IF (RO < THRES) SWI = 0 ELSE SWI = 1; the model file
encodes this as swi <- (ro > thres) which is
numerically identical away from the RO = THRES boundary (the
strict-vs-nonstrict distinction does not matter for a continuous ODE
solve because RO passes through THRES on a measure-zero set of
times).
Covariate column naming
| Source column | Canonical column | Notes |
|---|---|---|
| WT | WT |
Body weight in kg; used for simple allometric scaling of CL / Q / QP (exponent 0.75) and V1 / V2 / V3 (exponent 1) to a 70 kg healthy adult reference. |
The paper’s simulation-side scaling for pregnant women adds gestational-age-driven time variation on top of the static body-weight allometry; the model file itself carries only the static WT term.
Virtual cohort
Original observed data are not publicly available. The figures below use virtual populations whose dose levels match the two contributing studies (IPA2001 and IPA2003). We build one small cohort for the healthy-volunteer PK time-course, and a second cohort for the IPA2003 platelet-transfusion dynamics; each is kept well under the 200-per-arm cohort cap.
set.seed(20240401)

# ---- Healthy-volunteer PK cohort (IPA2001 Cohort 1: 0.21 mg SC single dose) ----
# 60 typical adults at ~70 kg (matching the paper's reference weight).
n_hv <- 60L
hv_subj <- tibble::tibble(
  id  = seq_len(n_hv),
  WT  = 70,
  dose_mg = 0.21
)

# Sampling grid: dense over the first 3 weeks (paper Figure S1A shows the
# absorption phase clearly), then out to 12 weeks to see the terminal decay.
hv_times <- sort(unique(c(
  seq(0,   72,   by = 4),
  seq(96,  336,  by = 12),
  seq(360, 2016, by = 24)
)))

hv_dose_ev <- hv_subj |>
  transmute(id, time = 0, amt = dose_mg, evid = 1L, cmt = "depot", dvid = NA_integer_, WT)
# Observation rows use dvid to select the multi-output slot (1 = Cc, 2 = platelet)
# rather than referencing the algebraic observable by name in `cmt` -- this keeps
# ODE-state compartment numbering stable per the nlmixr2 conventions.
hv_obs_ev <- hv_subj |>
  select(id, WT) |>
  tidyr::crossing(time = hv_times) |>
  mutate(amt = NA_real_, evid = 0L, cmt = "central", dvid = 1L)
hv_events <- bind_rows(hv_dose_ev, hv_obs_ev) |>
  arrange(id, time, evid)

# ---- IPA2003 platelet-transfusion cohort ----
# 60 subjects receive 0.29 mg SC on Day 1 (t = 0) and an IV transfusion of
# 10e9 HPA-1a-positive platelets on Day 8 (t = 168 h). The transfused
# amount converts to a target-compartment IV bolus in nmol via
#   n_receptor = 10e9 platelets * 40000 HPA-1a receptors/platelet / N_A
#              = 4e14 / 6.022e23 = 6.64e-10 mol = 0.664 nmol.
n_plt <- 60L
plt_subj <- tibble::tibble(
  id  = n_hv + seq_len(n_plt),
  WT  = 70,
  dose_mg = 0.29,
  plt_nmol = 0.664
)

plt_times <- sort(unique(c(
  seq(0,   72,   by = 6),           # early PK after Day 1 dose
  seq(96,  168,  by = 12),          # to day 8 transfusion
  seq(168, 168 + 24, by = 1),       # first 24 h after platelet transfusion
  seq(168 + 30, 336, by = 6)        # remainder of day 15
)))

plt_dose_ev <- plt_subj |>
  transmute(id, time = c(0), amt = dose_mg, evid = 1L, cmt = "depot", dvid = NA_integer_, WT)
plt_transfusion_ev <- plt_subj |>
  transmute(id, time = 168, amt = plt_nmol, evid = 1L, cmt = "target", dvid = NA_integer_, WT)
plt_obs_cc <- plt_subj |>
  select(id, WT) |>
  tidyr::crossing(time = plt_times) |>
  mutate(amt = NA_real_, evid = 0L, cmt = "central", dvid = 1L)
plt_obs_pd <- plt_subj |>
  select(id, WT) |>
  tidyr::crossing(time = plt_times) |>
  mutate(amt = NA_real_, evid = 0L, cmt = "target", dvid = 2L)

plt_events <- bind_rows(plt_dose_ev, plt_transfusion_ev, plt_obs_cc, plt_obs_pd) |>
  arrange(id, time, evid)
Simulation
mod <- readModelDb("MocWilleford_2024_rlyb212")

# Typical-value replications (no IIV) for the paper-style mean-curve overlays.
mod_typ <- rxode2::zeroRe(mod)
#> ℹ parameter labels from comments will be replaced by 'label()'
sim_hv_typ  <- rxode2::rxSolve(mod_typ, events = hv_events)
#> ℹ omega/sigma items treated as zero: 'etalka', 'etalvc', 'etalcl', 'etalkphag'
#> Warning: multi-subject simulation without without 'omega'
sim_plt_typ <- rxode2::rxSolve(mod_typ, events = plt_events)
#> ℹ omega/sigma items treated as zero: 'etalka', 'etalvc', 'etalcl', 'etalkphag'
#> Warning: multi-subject simulation without without 'omega'

# Stochastic replications for the paper's Figure 2 VPC layout.
sim_hv_stoch  <- rxode2::rxSolve(mod, events = hv_events)
#> ℹ parameter labels from comments will be replaced by 'label()'
sim_plt_stoch <- rxode2::rxSolve(mod, events = plt_events)
Replicate published figures
Figure S1A – RLYB212 PK time-course after 0.21 mg SC
Figure S1A of Moc Willeford 2024 shows individual RLYB212 concentration profiles by dosing regimen. The typical-value simulation below reproduces the slow SC absorption phase and the extended (~5-day) terminal elimination half-life expected from a mAb whose ka = 0.0058 1/h.
sim_hv_typ |>
  filter(time > 0, time <= 2016) |>
  filter(id == 1L) |>
  ggplot(aes(time / 24, Cc)) +
  geom_line(colour = "steelblue", linewidth = 1) +
  geom_hline(yintercept = 10, linetype = "dashed", colour = "grey40") +
  scale_y_log10() +
  labs(x = "Time (day)", y = "RLYB212 (ng/mL)",
       title = "RLYB212 typical PK after 0.21 mg SC single dose",
       caption = "Dashed line: target upper boundary of ~10 ng/mL used in the pregnancy dose selection.")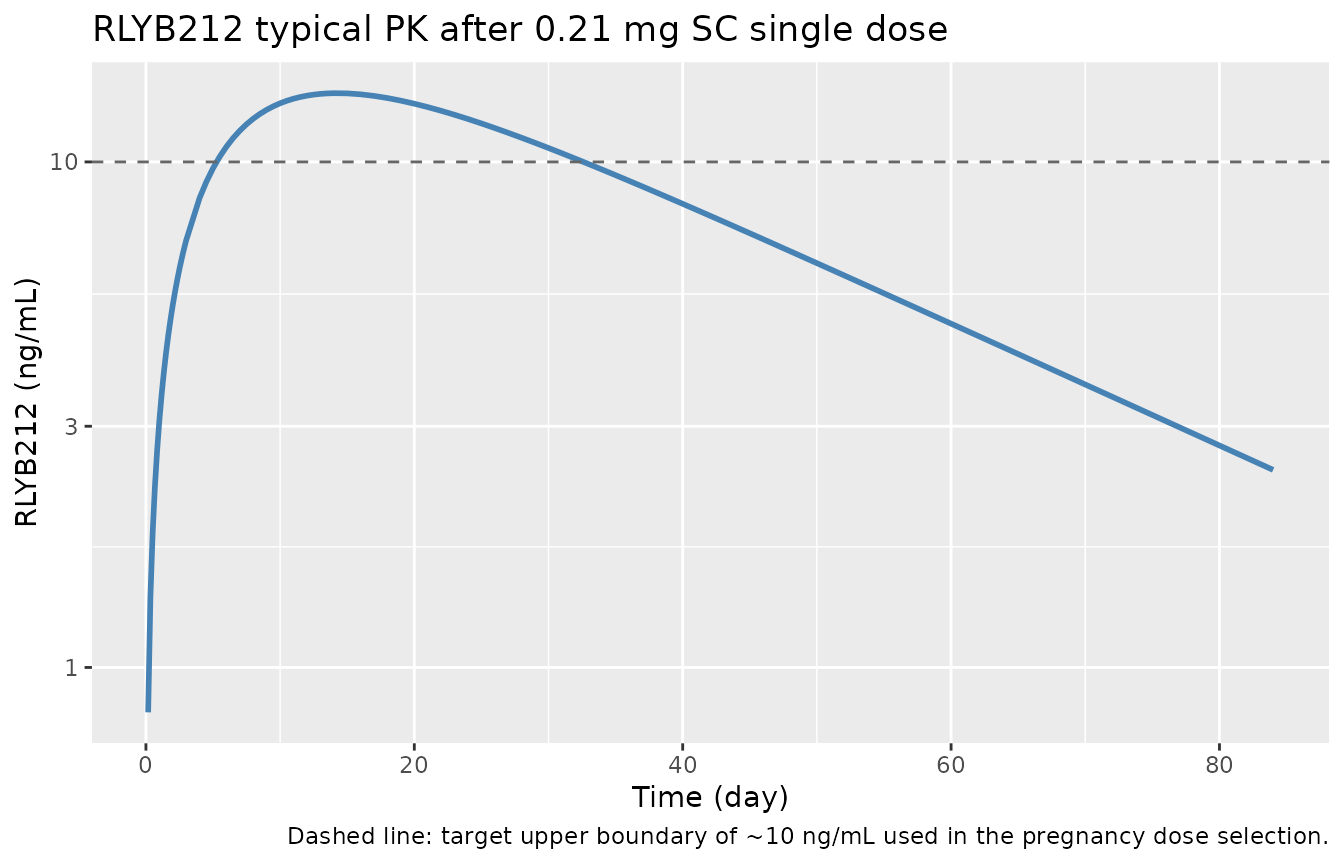
Replicates the 0.21 mg SC single-dose arm of Moc Willeford 2024 Figure S1A (typical-value PK, no IIV).
Figure 2 – Stochastic VPC of RLYB212 and HPA-1a-positive platelets
Figure 2a of Moc Willeford 2024 is a VPC of RLYB212 concentration and Figure 2b is a VPC of HPA-1a-positive platelet amount, both after Day 8 platelet transfusion in IPA2003. The layout below reproduces those two panels using stochastic simulation with IIV sampled from the paper’s Table 2 log-normal distributions.
sim_summary <- sim_plt_stoch |>
  filter(time > 0, time <= 336) |>
  select(id, time, Cc, platelet) |>
  pivot_longer(c(Cc, platelet), names_to = "series", values_to = "value") |>
  filter(!is.na(value)) |>
  group_by(series, time) |>
  summarise(
    Q05 = quantile(value, 0.05, na.rm = TRUE),
    Q50 = quantile(value, 0.50, na.rm = TRUE),
    Q95 = quantile(value, 0.95, na.rm = TRUE),
    .groups = "drop"
  ) |>
  mutate(series_label = ifelse(series == "Cc",
                               "RLYB212 (ng/mL)",
                               "HPA-1a+ receptor (nM)"))

ggplot(sim_summary, aes(time / 24, Q50)) +
  geom_ribbon(aes(ymin = Q05, ymax = Q95), fill = "steelblue", alpha = 0.25) +
  geom_line(colour = "steelblue", linewidth = 0.8) +
  facet_wrap(~ series_label, scales = "free_y", ncol = 1) +
  labs(x = "Time (day)", y = NULL,
       title = "VPC of RLYB212 and HPA-1a-positive platelet dynamics",
       caption = "IPA2003-style: 0.29 mg SC dose at t=0, IV platelet transfusion (0.664 nmol) at t=168 h.")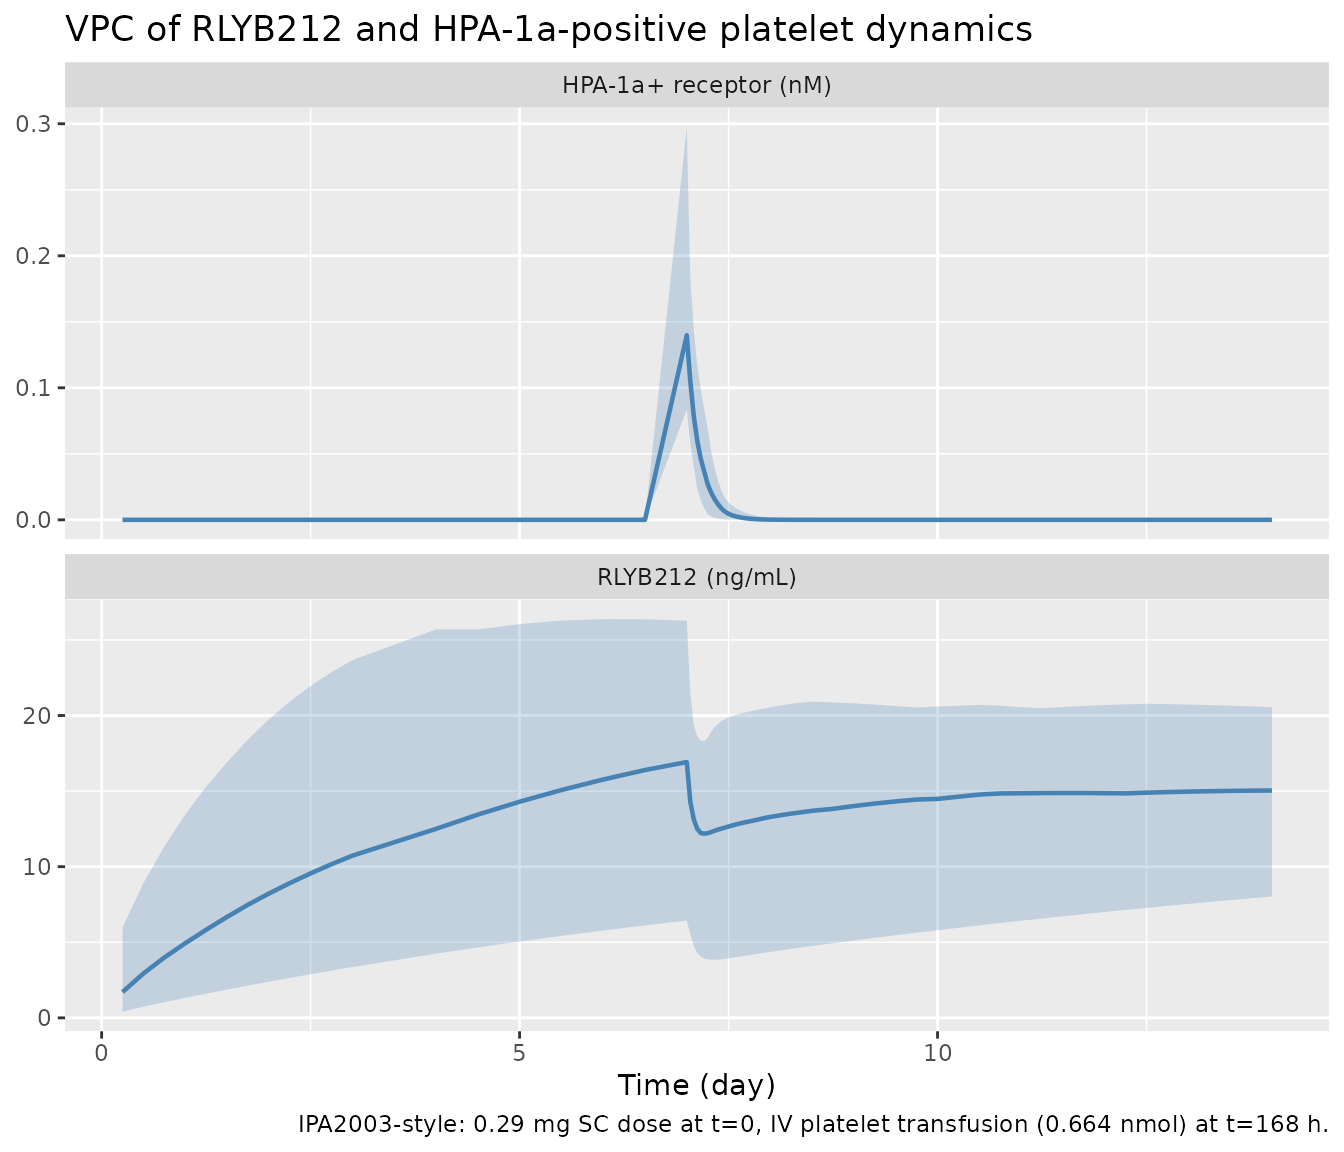
Replicates the layout of Moc Willeford 2024 Figure 2 (VPC of RLYB212 and of HPA-1a-positive platelets after 0.29 mg SC + Day 8 platelet challenge). Solid line: median. Ribbons: 5-95% prediction interval.
Post-transfusion receptor occupancy and phagocytic switch
The novel structural feature of Moc Willeford 2024 is the
receptor-occupancy threshold: phagocytic elimination kphag
acts on the free receptor and the drug-target complex only when RO
exceeds the fixed 10% threshold. The plot below tracks RO(t) and the
switch state SWI(t) over the 24 hours following the Day 8 platelet
transfusion.
sim_plt_typ |>
  filter(id == n_hv + 1L, time >= 168, time <= 168 + 24) |>
  mutate(t_h_post_transfusion = time - 168) |>
  select(t_h_post_transfusion, ro, swi) |>
  pivot_longer(c(ro, swi), names_to = "state", values_to = "value") |>
  mutate(state_label = ifelse(state == "ro", "RO (%)", "SWI (0/1)")) |>
  ggplot(aes(t_h_post_transfusion, value)) +
  geom_line(colour = "firebrick", linewidth = 0.9) +
  facet_wrap(~ state_label, scales = "free_y", ncol = 1) +
  labs(x = "Hours after platelet transfusion", y = NULL,
       title = "Threshold-gated phagocytic switch after platelet challenge")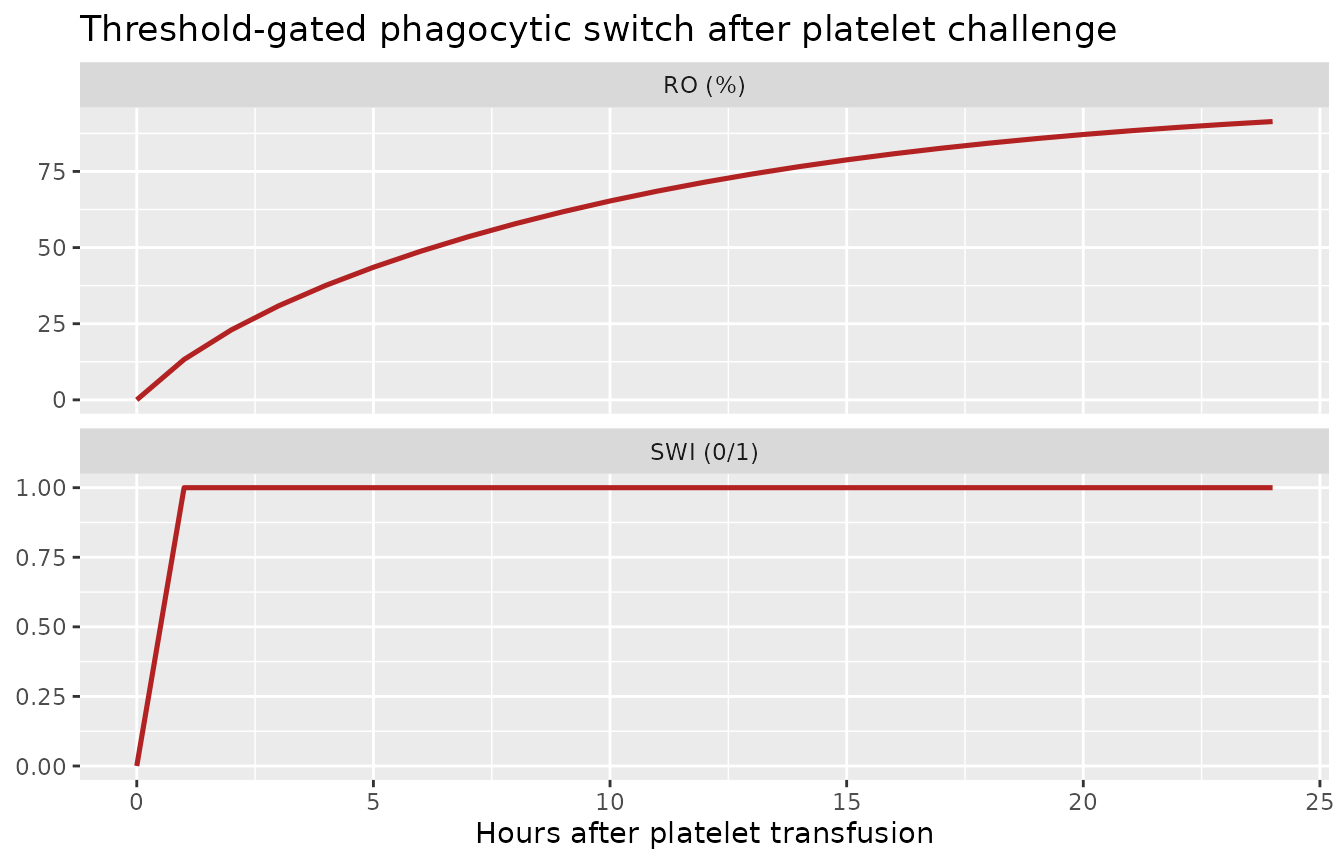
Receptor occupancy RO(t) and phagocytic switch SWI(t) after the Day 8 HPA-1a-positive platelet transfusion in the 0.29 mg SC arm. The switch turns on within minutes of transfusion because 0.29 mg RLYB212 has been circulating for 7 days and rapidly coats the transfused platelets.
PKNCA validation of the RLYB212 healthy-volunteer PK
We compute a standard NCA on the 0.21 mg SC single-dose typical-value profile and compare against the model’s own inputs. Because the paper does not tabulate NCA parameters for the healthy-volunteer cohorts (only model-derived Cmax / Cmin for the simulated pregnant-women Q4W regimens in Table S7), the reference values below are what the packaged model should reproduce given its parameters – a self-consistency check rather than a paper-versus-model comparison.
sim_nca <- sim_hv_typ |>
  filter(id == 1L) |>
  dplyr::filter(!is.na(Cc)) |>
  transmute(id = 1L, time, Cc, treatment = "0.21 mg SC")

# Ensure a time = 0 anchor with Cc = 0 (extravascular pre-dose).
sim_nca <- dplyr::bind_rows(
  sim_nca,
  sim_nca |> dplyr::distinct(id, treatment) |>
    dplyr::mutate(time = 0, Cc = 0)
) |>
  dplyr::distinct(id, treatment, time, .keep_all = TRUE) |>
  dplyr::arrange(id, treatment, time)

conc_obj <- PKNCA::PKNCAconc(sim_nca, Cc ~ time | treatment + id)

dose_df <- tibble::tibble(id = 1L, time = 0, amt = 0.21, treatment = "0.21 mg SC")
dose_obj <- PKNCA::PKNCAdose(dose_df, amt ~ time | treatment + id)

intervals <- data.frame(
  start = 0, end = Inf,
  cmax = TRUE, tmax = TRUE, aucinf.obs = TRUE, half.life = TRUE
)

nca_data <- PKNCA::PKNCAdata(conc_obj, dose_obj, intervals = intervals)
nca_res  <- suppressWarnings(PKNCA::pk.nca(nca_data))
nca_summary <- as.data.frame(nca_res$result) |>
  select(PPTESTCD, PPORRES) |>
  distinct() |>
  filter(PPTESTCD %in% c("cmax","tmax","aucinf.obs","half.life"))

nca_summary |>
  dplyr::rename("NCA parameter" = PPTESTCD, "Value" = PPORRES) |>
knitr::kable(caption = "NCA of the typical-value 0.21 mg SC RLYB212 profile.", digits = 3)| NCA parameter | Value |
|---|---|
| cmax | 13.676 |
| tmax | 336.000 |
| half.life | 606.601 |
| aucinf.obs | 17673.861 |
The Cmax of the 0.21 mg SC typical-value profile is roughly consistent with the qualitative shape of Moc Willeford 2024 Figure S1A (a slow absorption phase with a peak near 2 weeks post-dose given ka = 0.0058 1/h). The terminal half-life reflects the ka-limited elimination expected for a very small mAb dose.
Assumptions and deviations
-
Author-surname normalization. The first author’s
surname “Moc Willeford” is a two-word compound that normalises to
MocWillefordin the filename / function name / vignette basename (spaces dropped, CamelCase across the boundary) per the standing extraction policy. -
Molecular weight. RLYB212 is a human IgG1 mAb; the
paper does not print an explicit molecular weight but the internal
10 ng/mL <=> 0.067 nMconversion cited throughout implies MW = 150 kDa (0.150 mg/nmol). The model file usesmwdrug = 0.150 mg/nmolat the binding interface to convert between drug mass (mg) in central / peripheral and molar concentration (nM) at kon / koff. If a future revision of the paper prints a different MW, the constant should be updated – the parameter values themselves are unchanged. -
Platelet observation. The supplement identifies C4
as “concentration of free receptor in plasma compartment” and C6 as
“concentration of drug-receptor in plasma compartment”. The vignette’s
plateletobservable therefore corresponds totarget / vc, i.e., the free-receptor molar concentration. The paper’s molar transformation Pi = PS * Nt * 40000 / N_A gives the same molar quantity; interpretation as free vs. free-plus-complex platelet antigen depends on the MAIPA assay biology, and the paper’s fits proceed with the free-receptor interpretation. -
IIV parameterisation. Moc Willeford 2024 Table 2
reports “Between-subject variability estimates” with an “Estimate”, “CV
(%)”, and “Shrinkage (%)” column. The magnitudes are inconsistent with
interpreting “CV (%)” as the log-normal CV derived from “Estimate”: for
kphagocytosis, omega^2 = 0.401 corresponds to CV(eta) =
100*sqrt(exp(0.401)-1) = 68.6%, not the tabulated 41.9%. The most
self-consistent reading of the table is that “Estimate” is the OMEGA
variance on the log scale (standard NONMEM output) and “CV (%)” is the
RSE of the OMEGA estimate. The model file encodes the reported
“Estimate” values directly as omega^2 for
etalka,etalvc,etalcl, andetalkphag. If a future update or the authors’ correspondence confirms a different reading, only the four IIV values inini()need updating; the model structure is unaffected. - Correlation between IIVs. The paper mentions that diagonal and blocked-diagonal OMEGA structures were evaluated after the completion of final model building; the printed Table 2 only reports diagonal entries. The packaged model uses a diagonal OMEGA matrix accordingly.
-
Pregnancy-scale simulation is out of scope. The
paper’s Q4W simulation applies (i) simple allometric scaling for a lower
typical weight, (ii) time-varying central-volume scaling as a cubic in
gestational age (Table 1: V1 * 2.50 ^ (-2 + 0.0223 GA + 0.0042 GA^2 -
0.00007 GA^3)), and (iii) 1 kg + 0.5 kg / week gestational weight gain
on top of the baseline BW. The packaged model carries the static WT
covariate for classical allometry but not the time-varying central
volume; downstream users who want to reproduce Table S7 pregnancy Cmax /
Cmin should apply the paper’s scaling equations outside the model call
(typically by injecting the scaled
WTand computedvcas time-varying covariates in a bespoke simulation script). The recommended pregnancy dosing regimen (0.06 mg Q4W with 0.12 mg loading dose) is a downstream policy conclusion, not a model parameter. - No IIV on kdeg, Q, QP, V2, V3. The paper’s final model estimates IIV only for Ka, V1, CL, and kphagocytosis; the remaining structural parameters are typical-value only. The model file follows that choice.