Imipenem + aminoglycoside MBM vs. resistant Pseudomonas aeruginosa (Yadav 2017)
Source:vignettes/articles/Yadav_2017_imipenem_aminoglycoside_pseudomonas.Rmd
Yadav_2017_imipenem_aminoglycoside_pseudomonas.RmdModel and source
- Article: https://doi.org/10.1128/AAC.01011-16
- Citation: Yadav R, Bulitta JB, Nation RL, Landersdorfer CB. Optimization of synergistic combination regimens against carbapenem- and aminoglycoside-resistant clinical Pseudomonas aeruginosa isolates via mechanism-based pharmacokinetic/pharmacodynamic modeling. Antimicrob Agents Chemother 2017;61(1):e01011-16.
This is not a population PK model. It is a mechanism-based PK/PD model (MBM) of bacterial killing and resistance, fit with S-ADAPT to total viable counts from 48-h static-concentration time-kill (SCTK) assays in cation-adjusted Mueller-Hinton II broth. The paper studied three carbapenem-resistant clinical isolates of P. aeruginosa (FADDI-PA088, FADDI-PA001, FADDI-PA022) with monotherapies and combinations of imipenem (IPM) with the aminoglycosides tobramycin (TOB) and amikacin (AMK). Amikacin combinations against FADDI-PA022 were not studied.
The MBM (Table 3 of Yadav 2017) is contributed to nlmixr2lib as five model files, one per studied (strain, aminoglycoside) combination, all sharing the same structural model and differing only in the strain- and AGS-specific parameter values:
yadav_models <- c(
  "Yadav_2017_imipenem_tobramycin_PA088",
  "Yadav_2017_imipenem_amikacin_PA088",
  "Yadav_2017_imipenem_tobramycin_PA001",
  "Yadav_2017_imipenem_amikacin_PA001",
  "Yadav_2017_imipenem_tobramycin_PA022"
)
yadav_models
#> [1] "Yadav_2017_imipenem_tobramycin_PA088"
#> [2] "Yadav_2017_imipenem_amikacin_PA088"
#> [3] "Yadav_2017_imipenem_tobramycin_PA001"
#> [4] "Yadav_2017_imipenem_amikacin_PA001"
#> [5] "Yadav_2017_imipenem_tobramycin_PA022"
The antibiotic exposures cipm (imipenem) and
cags (aminoglycoside) are state variables that the user
doses. In the original SCTK assays they were essentially constant in
time (with imipenem supplemented at 6 and 30 h to offset thermal
degradation), so the model defaults to d/dt(cipm) = 0,
d/dt(cags) = 0; the user can attach elimination terms or
external popPK to simulate clinical regimens.
Because there is no absorption-distribution-elimination profile to integrate, PKNCA / NCA is not an appropriate validation. The checks below are the mechanistic equivalents: antibiotic-free carrying-capacity hold, the mechanistic-synergy curve (Figure 4), and replication of representative kill / regrowth combinations from Figure 2.
Population (biological context)
Three carbapenem-resistant P. aeruginosa clinical isolates from the Monash University collection (Yadav 2017 Table 1):
| Isolate | MIC IPM | MIC TOB | MIC AMK | Notes |
|---|---|---|---|---|
| FADDI-PA088 | 16 mg/L | 32 mg/L | 4 mg/L | Double-resistant for IPM/TOB; AMK-susceptible. Both IPM and TOB MICs at the 98th percentile of EUCAST distributions. |
| FADDI-PA001 | 32 mg/L | 4 mg/L | 32 mg/L | Carbapenem- and amikacin-resistant; tobramycin breakpoint-susceptible. Harboured a preexisting IPM-resistant subpopulation (3.1 log10 CFU/mL at 0 h). |
| FADDI-PA022 | 16 mg/L | 8 mg/L | > 32 mg/L (NS) | Carbapenem- and tobramycin-resistant; amikacin combinations not studied. |
All susceptibility testing and SCTK experiments used cation-adjusted
Mueller-Hinton II broth (CAMHB) at a clinically relevant high initial
inoculum of ~10^7.5 CFU/mL. Bacteria were sampled at 0, 1, 3, 6, 24, 29
and 48 h. The model was fit jointly per strain across all IPM
monotherapies, AGS monotherapies, and IPM + AGS combinations. The same
metadata are available programmatically via
readModelDb("<modelname>")$population.
Source trace
Per-parameter origins are recorded as in-file comments next to every
ini() entry in
inst/modeldb/specificDrugs/Yadav_2017_imipenem_*.R. All
values are the population-mean estimates from Yadav 2017 Table 3
(“Population mean value (SE [%]) for strain, treatment”); footnote
a tags tobramycin-specific estimates and footnote b
tags amikacin-specific estimates. The structural model is from the
Methods sub-sections “Life cycle growth model”, “Model for combinations
of imipenem and an aminoglycoside” (Eqs 1-4), and “Mechanism-based
modeling of synergy” (Eq 5).
| Equation / parameter | Source location |
|---|---|
Total viable count
CFUall = sum of 6 bacterial states
|
Eq 1 (Methods) |
Signal-molecule growth inhibition
Inh_k12 = Imax,sig12 * Csig / (Csig + IC50,sig)
|
Eq 2 (Methods); explicit Csig ODE not given in main
text |
| State-1 ODE (Eq 3): replication + transition + killing | Eq 3 (Methods, p. 14) |
| State-2 ODE (Eq 4) | Eq 4 (Methods, p. 14) |
Plateau factor
PLAT = 1 - CFUall / (CFUall + CFUmax)
|
Eq 3 footnote (Methods) |
Outer-membrane synergy
OM_effect = 1 - Imax,OM,AGS * C_AGS / (C_AGS + IC50,OM,AGS)
|
Eq 5 (Methods) |
| Per-strain parameter columns (Log CFU0, CFUmax, k21, MGTs, Log MUT, Kmax/KC50/Hill for IPM and AGS, MTT_sig, Imax,sig12, Log10 IC50,sig, Imax,OM, IC50,OM, SD_CFU) | Table 3 |
| Tobramycin (a) vs. amikacin (b) AGS-specific values | Table 3 footnotes a/b |
| 3.11/1.15/2.53-fold KC50,IPM decrease at saturating AGS | Table 3 footnote c (also = 1/(1-Imax,OM)) |
| Initial conditions: total inoculum CFU0, RI seeded by 10^Log MUT,IPM, IR seeded by 10^Log MUT,AGS | Methods, “Initial conditions” |
Per-isolate parameter snapshot
snap <- lapply(yadav_models, function(m) {
  th <- rxode2::rxode(readModelDb(m))$theta
  data.frame(model = m, parameter = names(th), value = unname(th))
}) |>
  do.call(rbind, args = _) |>
  tidyr::pivot_wider(names_from = model, values_from = value)
knitr::kable(snap, digits = 4,
caption = "Population-mean parameter values per (strain, AGS) combination, as loaded from the five model files.")| parameter | Yadav_2017_imipenem_tobramycin_PA088 | Yadav_2017_imipenem_amikacin_PA088 | Yadav_2017_imipenem_tobramycin_PA001 | Yadav_2017_imipenem_amikacin_PA001 | Yadav_2017_imipenem_tobramycin_PA022 |
|---|---|---|---|---|---|
| log10cfu0 | 7.540 | 7.460 | 7.920 | 7.780 | 6.990 |
| log10cfumax | 9.560 | 9.560 | 9.230 | 9.230 | 9.540 |
| lk21 | 3.912 | 3.912 | 3.912 | 3.912 | 3.912 |
| mgt_ss | 26.900 | 26.900 | 45.300 | 45.300 | 63.800 |
| mgt_ri | 873.000 | 873.000 | 481.000 | 481.000 | 565.000 |
| mgt_ir | 26.900 | 26.900 | 45.300 | 45.300 | 63.800 |
| log10mf_ipm | -4.730 | -4.730 | -4.990 | -4.990 | -3.900 |
| log10mf_ags | -7.000 | -6.680 | -7.330 | -6.660 | -7.550 |
| kmax_ipm | 3.340 | 3.340 | 3.210 | 3.210 | 2.230 |
| kc50_ss_ipm | 0.992 | 0.992 | 33.200 | 33.200 | 15.200 |
| kc50_ri_ipm | 264.000 | 264.000 | 118.000 | 118.000 | 67.300 |
| kc50_ir_ipm | 23.500 | 23.500 | 61.800 | 61.800 | 52.700 |
| hill_ipm | 3.000 | 3.000 | 3.090 | 3.090 | 3.080 |
| kmax_ss_ags | 11.800 | 11.800 | 2.840 | 2.840 | 2.930 |
| kmax_ri_ags | 3.280 | 3.280 | 3.140 | 3.140 | 2.800 |
| kmax_ir_ags | 11.800 | 11.800 | 2.840 | 2.840 | 2.930 |
| kc50_ss_ags | 18.600 | 4.880 | 16.600 | 153.000 | 54.900 |
| kc50_ri_ags | 849.000 | 280.000 | 228.000 | 738.000 | 568.000 |
| kc50_ir_ags | 615.000 | 329.000 | 46.700 | 170.000 | 159.000 |
| hill_ags | 1.110 | 1.110 | 2.040 | 2.040 | 0.998 |
| mtt_sig | 1.000 | 1.000 | 1.000 | 1.000 | 0.087 |
| imax_sig12 | 0.997 | 0.997 | 0.996 | 0.996 | 0.881 |
| log10ic50sig | 10.200 | 10.200 | 9.630 | 9.630 | 8.950 |
| imax_om | 0.678 | 0.678 | 0.130 | 0.130 | 0.604 |
| ic50_om | 5.550 | 1.130 | 1.540 | 4.800 | 4.290 |
| addSd | 0.378 | 0.378 | 0.290 | 0.290 | 0.475 |
Units (dimensional analysis)
| Symbol | Meaning | Units |
|---|---|---|
bact_susceptible_susceptible{1,2},
bact_resistant_intermediate{1,2},
bact_intermediate_resistant{1,2}
|
Bulitta life-cycle bacterial states | CFU/mL |
cipm, cags, csig
|
imipenem / aminoglycoside / signal-molecule concentrations | mg/L (IPM, AGS); CFU/mL (csig) |
lk21, k12*, kmax_*,
kill_*, kout_sig
|
rate constants | 1 / h |
kc50_*, ic50_om, ic50sig
|
half-effect concentrations | mg/L (IPM, AGS); CFU/mL (sig) |
mgt_*, mtt_sig
|
mean generation / turnover times | min (mgt_*); h (mtt_sig) |
cfumax, cfu0
|
population scale / inoculum | CFU/mL |
hill_ipm, hill_ags, plat,
inh_k12, om_effect, imax_sig12,
imax_om
|
dimensionless | – |
log10* parameters (log10cfu0,
log10cfumax, log10mf_*,
log10ic50sig) |
base-10 log of the linear value | log10 of the corresponding unit |
Every growth/kill ODE term reduces to (1/h) x (CFU/mL) = (CFU/mL)/h,
matching d/dt(bact_*); k12 = 60/MGT carries 60
in (min/h), converting the mean generation time (min) to a rate (1/h);
kout_sig = 1/MTT_sig converts the turnover time (h) to a
rate (1/h).
mod <- rxode2::rxode(readModelDb("Yadav_2017_imipenem_tobramycin_PA088"))
mod$state
#> [1] "bact_susceptible_susceptible1" "bact_susceptible_susceptible2"
#> [3] "bact_resistant_intermediate1"  "bact_resistant_intermediate2"
#> [5] "bact_intermediate_resistant1"  "bact_intermediate_resistant2"
#> [7] "csig"                          "cipm"
#> [9] "cags"
Carrying-capacity (growth control) check
With no antibiotic, the population grows from the inoculum toward
CFUmax. For the Yadav 2017 plateau factor
PLAT = 1 - CFUall / (CFUall + CFUmax), the steady state is
PLAT = 0.5 at CFUall = CFUmax, so the
simulated plateau equals CFUmax (unlike the Rees 2018
plateau form which settles at half the carrying capacity). The
signal-molecule inhibition adds a smaller secondary brake on growth and
shifts the plateau only slightly.
gc_one <- function(mname) {
  m <- rxode2::rxode(readModelDb(mname))
  ev <- et(seq(0, 48, by = 0.5))
  s <- rxode2::rxSolve(m, ev, method = "lsoda",
                       atol = 1e-10, rtol = 1e-10, maxsteps = 1e6,
                       returnType = "data.frame")
  data.frame(model = mname, time = s$time, Cc = s$Cc, CFUall = s$CFUall)
}
gc <- do.call(rbind, lapply(yadav_models, gc_one))

gc_tab <- gc |>
  group_by(model) |>
  summarise(
    log10cfu0_sim     = round(first(Cc), 2),
    log10cfumax_sim   = round(max(Cc), 2),
    .groups = "drop"
  )
knitr::kable(gc_tab,
caption = "Growth-control hold: each model starts at its log10cfu0 and reaches log10cfumax by 48 h.")| model | log10cfu0_sim | log10cfumax_sim |
|---|---|---|
| Yadav_2017_imipenem_amikacin_PA001 | 7.78 | 9.23 |
| Yadav_2017_imipenem_amikacin_PA088 | 7.46 | 9.56 |
| Yadav_2017_imipenem_tobramycin_PA001 | 7.92 | 9.23 |
| Yadav_2017_imipenem_tobramycin_PA022 | 6.99 | 9.54 |
| Yadav_2017_imipenem_tobramycin_PA088 | 7.54 | 9.56 |
ggplot(gc, aes(time, Cc, colour = model)) +
  geom_line(linewidth = 0.8) +
  labs(x = "Time (h)", y = expression(log[10]~CFU/mL),
       title = "Antibiotic-free growth from inoculum to carrying capacity",
       colour = NULL) +
  theme(legend.position = "bottom", legend.text = element_text(size = 7)) +
  guides(colour = guide_legend(ncol = 1))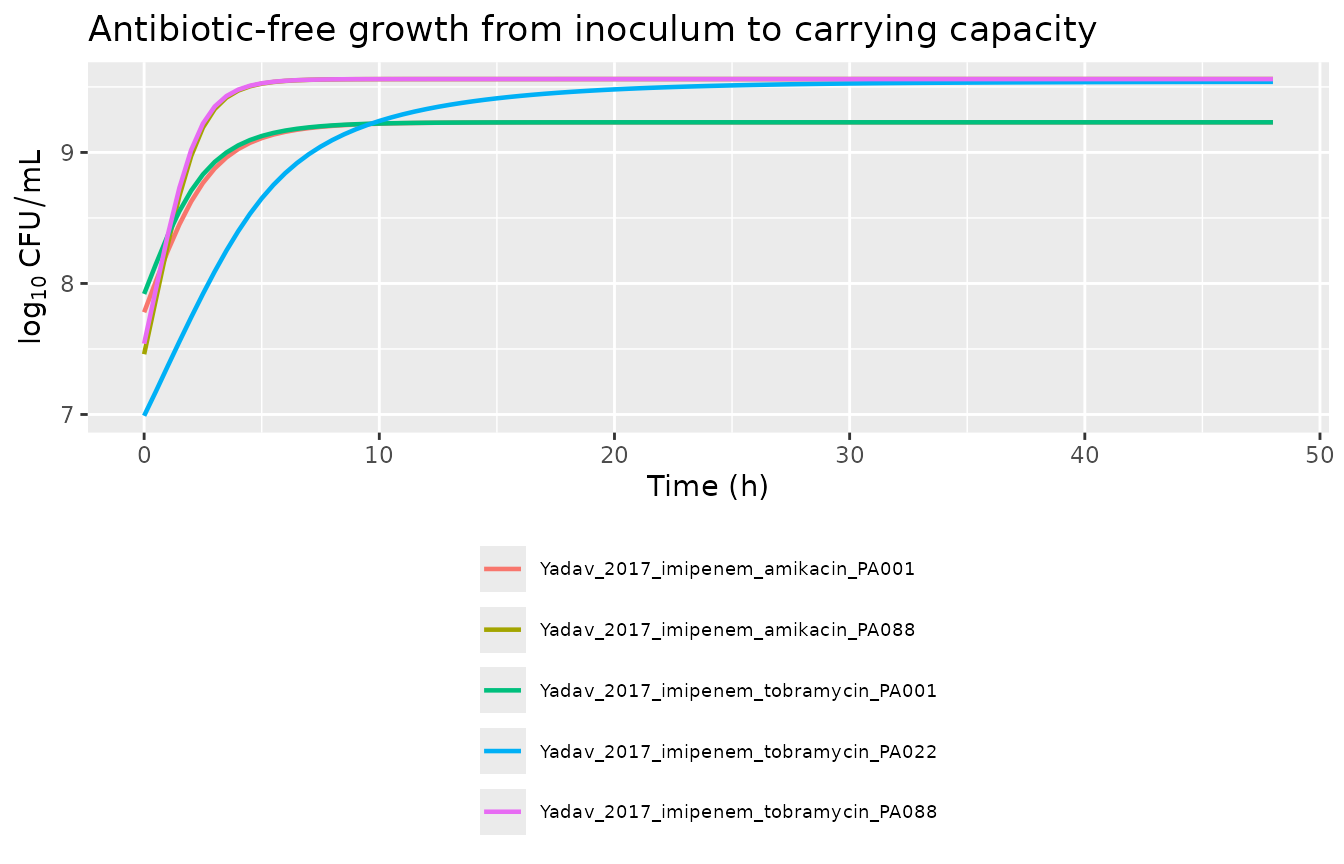
Mechanistic-synergy check (replicate Figure 4)
The outer-membrane effect
OM_effect = 1 - Imax,OM * C_AGS / (C_AGS + IC50,OM) scales
the effective imipenem KC50 (Eq 5). At saturating AGS the effective
KC50,IPM is reduced to (1 - Imax,OM) * KC50,IPM, which
gives the fold-decrease quoted in Table 3 footnote c: 3.11-fold for
FADDI-PA088, 1.15-fold for FADDI-PA001, and 2.53-fold for
FADDI-PA022.
om_effect <- function(cags, imax_om, ic50_om) 1 - imax_om * cags / (cags + ic50_om)

strain_params <- tibble::tribble(
  ~panel,                    ~ags,         ~imax_om, ~ic50_om, ~kc50_ss_ipm, ~kc50_ri_ipm, ~kc50_ir_ipm,
  "A: FADDI-PA088 + TOB",    "tobramycin", 0.678,    5.55,     0.992,        264,          23.5,
  "A: FADDI-PA088 + AMK",    "amikacin",   0.678,    1.13,     0.992,        264,          23.5,
  "B: FADDI-PA001 + TOB",    "tobramycin", 0.130,    1.54,     33.2,         118,          61.8,
  "B: FADDI-PA001 + AMK",    "amikacin",   0.130,    4.80,     33.2,         118,          61.8,
  "C: FADDI-PA022 + TOB",    "tobramycin", 0.604,    4.29,     15.2,         67.3,         52.7
)

fig4 <- strain_params |>
  tidyr::crossing(cags = seq(0, 32, by = 0.5)) |>
  mutate(
    om     = om_effect(cags, imax_om, ic50_om),
    KC50_SS_IPM_eff = om * kc50_ss_ipm,
    KC50_RI_IPM_eff = om * kc50_ri_ipm,
    KC50_IR_IPM_eff = om * kc50_ir_ipm
  ) |>
  tidyr::pivot_longer(c(KC50_SS_IPM_eff, KC50_RI_IPM_eff, KC50_IR_IPM_eff),
                      names_to = "subpop", values_to = "kc50_eff_mgL") |>
  mutate(subpop = recode(subpop,
                         KC50_SS_IPM_eff = "KC50,SS,IPM",
                         KC50_RI_IPM_eff = "KC50,RI,IPM",
                         KC50_IR_IPM_eff = "KC50,IR,IPM"))

ggplot(fig4, aes(cags, kc50_eff_mgL, colour = subpop, linetype = ags)) +
  geom_line(linewidth = 0.8) +
  facet_wrap(~panel, scales = "free_y") +
  labs(x = "Aminoglycoside (mg/L)", y = "Effective KC50,IPM (mg/L)",
       title = "Replicates Figure 4 of Yadav 2017",
       caption = "OM_effect lowers the effective KC50,IPM for two or three subpopulations.",
       colour = NULL, linetype = NULL) +
  theme(legend.position = "bottom")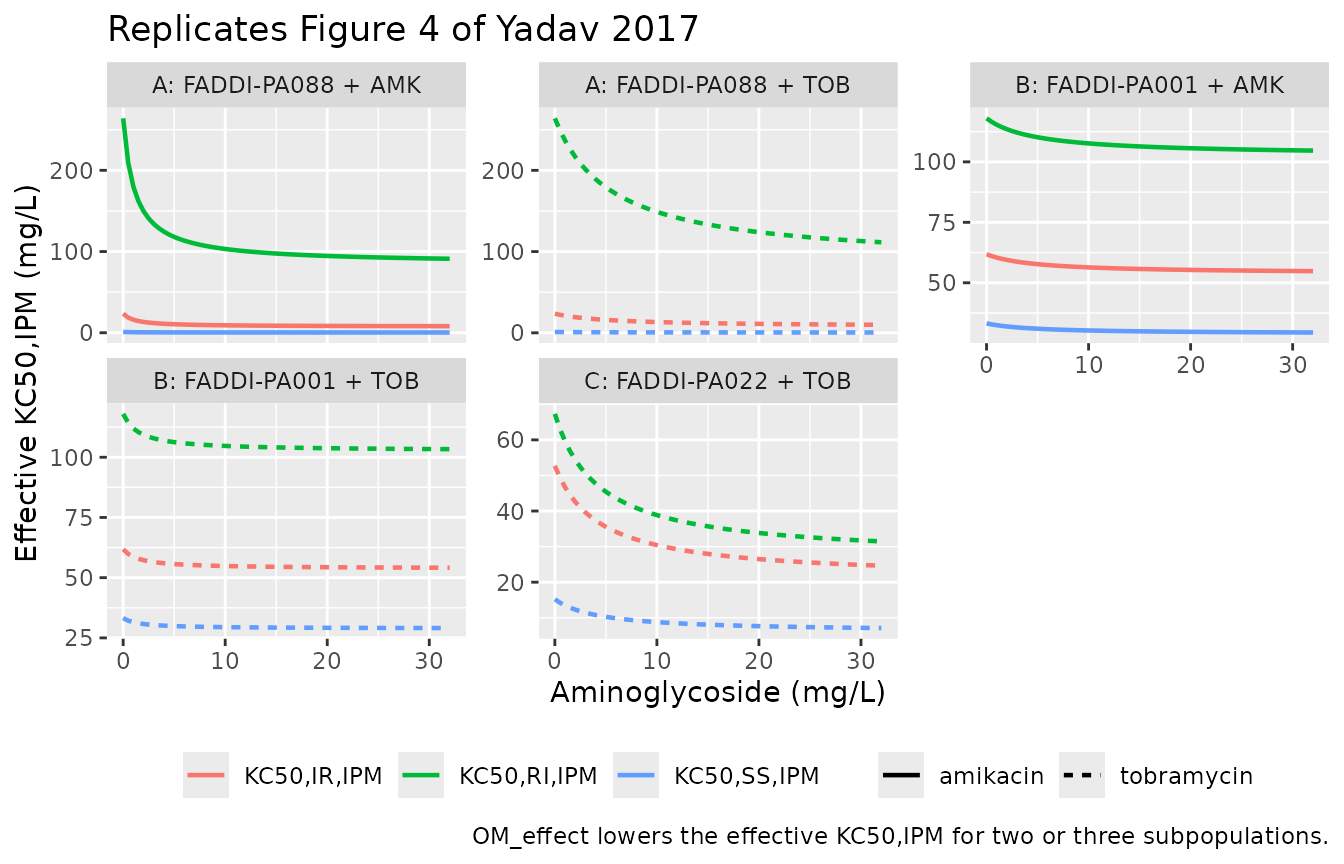
strain_params |>
  mutate(
    fold_at_saturation_AGS = round(1 / (1 - imax_om), 2)
  ) |>
  select(panel, ags, imax_om, ic50_om, fold_at_saturation_AGS) |>
knitr::kable(caption = "Maximum fold-decrease in KC50,IPM at saturating AGS (1/(1-imax_om)). Matches Table 3 footnote c.")| panel | ags | imax_om | ic50_om | fold_at_saturation_AGS |
|---|---|---|---|---|
| A: FADDI-PA088 + TOB | tobramycin | 0.678 | 5.55 | 3.11 |
| A: FADDI-PA088 + AMK | amikacin | 0.678 | 1.13 | 3.11 |
| B: FADDI-PA001 + TOB | tobramycin | 0.130 | 1.54 | 1.15 |
| B: FADDI-PA001 + AMK | amikacin | 0.130 | 4.80 | 1.15 |
| C: FADDI-PA022 + TOB | tobramycin | 0.604 | 4.29 | 2.53 |
Replicate Figure 2 (selected time-kill panels)
Figure 2 of Yadav 2017 shows observed (markers) and individual fitted (lines) total viable counts for combinations of imipenem with tobramycin or amikacin against all three isolates. The published lines are the MBM fits we are reproducing. We pick representative cells that illustrate the qualitative patterns the authors emphasise in the Results: (i) regrowth under IPM monotherapy and at low AGS, (ii) prevention of regrowth at adequate AGS even below the AGS MIC for FADDI-PA088, and (iii) the near-monotherapy-like behaviour of low-IPM combinations against FADDI-PA001 (whose KC50,SS,IPM is much higher).
combo_sim <- function(mname, cipm_dose, cags_dose, tmax = 48) {
  m <- rxode2::rxode(readModelDb(mname)) |> rxode2::zeroRe()
  ev <- et(amt = cipm_dose, cmt = "cipm", time = 0) |>
    et(amt = cags_dose, cmt = "cags", time = 0) |>
    et(seq(0, tmax, by = 0.5))
  rxode2::rxSolve(m, ev, method = "lsoda", atol = 1e-10, rtol = 1e-10,
                  maxsteps = 1e6, returnType = "data.frame") |>
    transmute(time, log10CFU = log10(pmax(CFUall, 1)))
}

# Panels: A1 (PA088 + TOB), A2 (PA088 + AMK), B1 (PA001 + TOB), C (PA022 + TOB)
panels <- tibble::tribble(
  ~panel, ~model,                                        ~cipm_dose, ~cags_dose,
  "A1 PA088 + TOB", "Yadav_2017_imipenem_tobramycin_PA088",  0,   0,
  "A1 PA088 + TOB", "Yadav_2017_imipenem_tobramycin_PA088", 24,   0,
  "A1 PA088 + TOB", "Yadav_2017_imipenem_tobramycin_PA088", 24,   1,
  "A1 PA088 + TOB", "Yadav_2017_imipenem_tobramycin_PA088", 24,  16,
  "A2 PA088 + AMK", "Yadav_2017_imipenem_amikacin_PA088",   24,   0,
  "A2 PA088 + AMK", "Yadav_2017_imipenem_amikacin_PA088",   24,   1,
  "A2 PA088 + AMK", "Yadav_2017_imipenem_amikacin_PA088",   24,  16,
  "B1 PA001 + TOB", "Yadav_2017_imipenem_tobramycin_PA001",  0,   0,
  "B1 PA001 + TOB", "Yadav_2017_imipenem_tobramycin_PA001", 36,   0,
  "B1 PA001 + TOB", "Yadav_2017_imipenem_tobramycin_PA001", 36,  16,
  "C  PA022 + TOB", "Yadav_2017_imipenem_tobramycin_PA022",  0,   0,
  "C  PA022 + TOB", "Yadav_2017_imipenem_tobramycin_PA022", 24,   0,
  "C  PA022 + TOB", "Yadav_2017_imipenem_tobramycin_PA022", 24,  16
)

fig2 <- panels |>
  rowwise() |>
  mutate(sim = list(combo_sim(model, cipm_dose, cags_dose))) |>
  tidyr::unnest(sim) |>
  mutate(label = sprintf("IPM=%g + AGS=%g", cipm_dose, cags_dose))
#> Warning: There were 13 warnings in `mutate()`.
#> The first warning was:
#> ℹ In argument: `sim = list(combo_sim(model, cipm_dose, cags_dose))`.
#> ℹ In row 1.
#> Caused by warning:
#> ! No omega parameters in the model
#> ℹ Run `dplyr::last_dplyr_warnings()` to see the 12 remaining warnings.

ggplot(fig2, aes(time, log10CFU, colour = label)) +
  geom_line(linewidth = 0.8) +
  facet_wrap(~panel) +
  scale_x_continuous(breaks = seq(0, 48, by = 12)) +
  ylim(0, 11) +
  labs(x = "Time (h)", y = expression(log[10]~CFU/mL),
       title = "Replicates selected panels of Figure 2 of Yadav 2017",
       caption = "Growth control regrows to ~CFUmax; IPM monotherapies kill and regrow; effective IPM+AGS combinations suppress regrowth.",
       colour = "Regimen (mg/L)") +
  theme(legend.position = "bottom")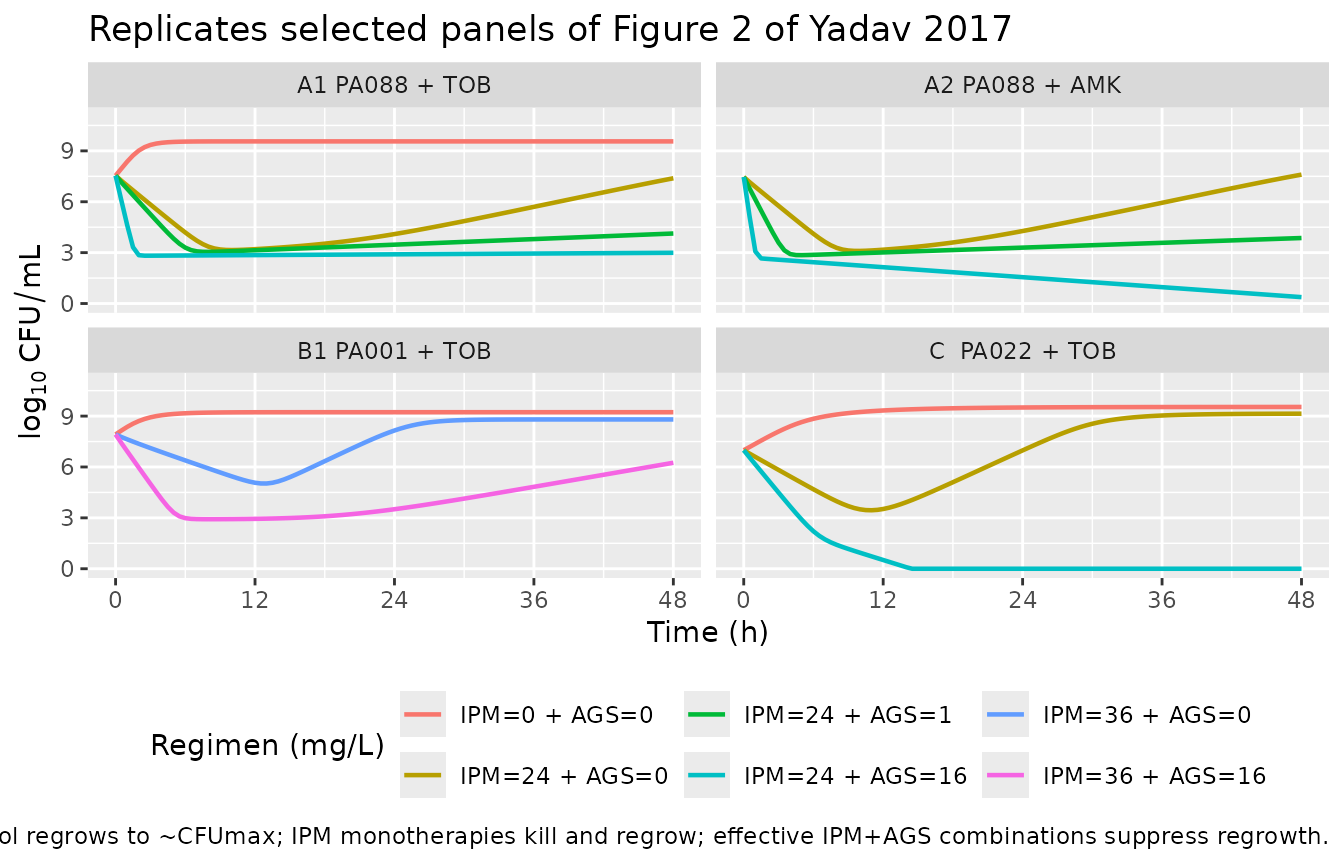
fig2 |>
  group_by(panel, label) |>
  summarise(
    log10CFU_t0   = round(first(log10CFU), 2),
    log10CFU_t6   = round(log10CFU[time == 6], 2),
    log10CFU_t24  = round(log10CFU[time == 24], 2),
    log10CFU_t48  = round(log10CFU[time == 48], 2),
    .groups = "drop"
  ) |>
knitr::kable(caption = "Simulated log10 viable counts at sampling time-points used by Yadav 2017 (0, 6, 24, 48 h).")| panel | label | log10CFU_t0 | log10CFU_t6 | log10CFU_t24 | log10CFU_t48 |
|---|---|---|---|---|---|
| A1 PA088 + TOB | IPM=0 + AGS=0 | 7.54 | 9.55 | 9.56 | 9.56 |
| A1 PA088 + TOB | IPM=24 + AGS=0 | 7.54 | 4.19 | 4.09 | 7.38 |
| A1 PA088 + TOB | IPM=24 + AGS=1 | 7.54 | 3.29 | 3.47 | 4.13 |
| A1 PA088 + TOB | IPM=24 + AGS=16 | 7.54 | 2.83 | 2.90 | 2.99 |
| A2 PA088 + AMK | IPM=24 + AGS=0 | 7.46 | 4.11 | 4.27 | 7.60 |
| A2 PA088 + AMK | IPM=24 + AGS=1 | 7.46 | 2.87 | 3.30 | 3.86 |
| A2 PA088 + AMK | IPM=24 + AGS=16 | 7.46 | 2.44 | 1.55 | 0.38 |
| B1 PA001 + TOB | IPM=0 + AGS=0 | 7.92 | 9.17 | 9.23 | 9.23 |
| B1 PA001 + TOB | IPM=36 + AGS=0 | 7.92 | 6.39 | 8.15 | 8.80 |
| B1 PA001 + TOB | IPM=36 + AGS=16 | 7.92 | 2.98 | 3.51 | 6.25 |
| C PA022 + TOB | IPM=0 + AGS=0 | 6.99 | 8.84 | 9.51 | 9.54 |
| C PA022 + TOB | IPM=24 + AGS=0 | 6.99 | 4.68 | 6.98 | 9.14 |
| C PA022 + TOB | IPM=24 + AGS=16 | 6.99 | 2.21 | 0.00 | 0.00 |
Assumptions and deviations
-
Model class / species. This is an in-vitro
mechanism-based PK/PD model, not a popPK model;
population$speciesrecords the P. aeruginosa isolate. No PKNCA validation is performed (there is no drug NCA to compute); the mechanistic checks above replace it, per the endogenous/mechanistic validation strategy. - File naming. The dispatch metadata listed the drug as “Antimicrobial Agents and Chemo”, which is the journal name (Antimicrobial Agents and Chemotherapy), not a drug. The paper unambiguously models imipenem combined with tobramycin or amikacin, so the five model files use the corresponding drug + isolate suffix.
-
Five files, one paper. Per the
replicate-author-structure policy, one vignette walks the paper as a
whole and loads each of the five
modellib()entries at the appropriate point. The authors did a single per-strain joint fit covering all IPM, AGS, and IPM + AGS data within that strain; we expose five fully-specified files because most parameters that differ between TOB and AMK within a strain (KC50,AGS, IC50,OM,AGS, Log MUT,AGS, Log CFU0) are drug-specific while the structural shared subset is duplicated. The parameter snapshot table makes the shared / drug-specific split explicit. -
Signal-molecule ODE form. Methods Eq 2 defines the
inhibition term
Inh_k12 = Imax,sig12 * Csig / (Csig + IC50,sig)but the main paper does not give theCsigODE; it cites Bulitta 2010 (ref 61), which is not on disk. The standard formd/dt(csig) = (1/MTT_sig) * (CFU_all - csig)withcsig(0) = cfu0is used, givingcsig = CFU_allat steady state. This is the canonical Bulitta life-cycle formulation and the only internally-consistent reading of the reportedMTT_sigandLog10 IC50,sigvalues (the latter is on a log10 CFU/mL scale, matchingCFU_allat carrying capacity). See “Source trace” for the equation locations. -
Plateau factor.
PLAT = 1 - CFUall/(CFUall + CFUmax)(Methods Eq 3 footnote). AtCFUall = CFUmax, PLAT = 0.5, which combined with the state-2 doubling factor of 2 produces steady-state growth balance atCFUmax. The simulated plateau therefore equalsCFUmax, not0.5 * CFUmaxas in the Rees 2018 plateau form. -
OM_effect placement. The aminoglycoside reduces the
effective imipenem KC50 through
(OM_effect * KC50,IPM)^Hill,IPMin the IPM killing denominator (Methods Eq 3). Footnote c of Table 3 reports a 3.11-fold decrease for FADDI-PA088 at saturating AGS, matching1/(1 - 0.678) = 3.106– the structural placement above. The AGS killing term uses its ownKC50,AGSand is not affected byOM_effect. -
Initial state partitioning. The total inoculum
(
CFU0) is placed in the SS subpopulation state 1; the RI and IR subpopulations are seeded atCFU0 * 10^Log MUT,IPMandCFU0 * 10^Log MUT,AGSrespectively, also in state 1. Methods, “Initial conditions” specifies the seeds but not the state-1 / state-2 split; the balanced state-2 fraction is small (a few percent for the fast-MGT SS/IR populations) and equilibrates within ~1 / k21 (a few minutes).csigstarts atcfu0(steady state with the inoculum). -
Antibiotic disposition.
d/dt(cipm) = 0,d/dt(cags) = 0is the SCTK assumption (constant bath concentrations, with the imipenem thermal-degradation supplementation at 6 and 30 h absorbed into the effective constant). Users simulating clinical PK should attach elimination terms or couple to an external popPK model (e.g.Hennig_2008_tobramycin,Delattre_2010_amikacin) by overridingd/dt(cipm)andd/dt(cags). The paper’s Monte Carlo simulations used previously reported critically-ill popPK models for imipenem (ref 37 Conil et al.) and tobramycin (ref 36 Aarons et al.); those popPK models are not extracted in this addition. -
Csig observation floor.
csigis bounded below by 0 by the ODE structure but never falls to zero in practice (it tracksCFUallwhich is bounded below by the unkilled subpopulations). No explicit flooring is required. -
Solver. The default
liblsodasolver was observed to return NaN for these models when the bacterial states approach the stationary plateau;method = "lsoda"is used throughout this vignette.maxsteps = 1e6with tight tolerances (atol = rtol = 1e-10) is used because the rapid kill at high IPM near MIC makes the system stiff during the kill transient. - Erratum check. Web access for an erratum / corrigendum search is not available in this offline build. No erratum is referenced in the lead PDF. Any later correction in PubMed or the AAC journal page should be checked before deploying the model in a regulatory context.
-
Convention check.
nlmixr2lib::checkModelConventions()returns clean (no warnings, no errors) for all five model files. The bacterial-state compartments (bact_susceptible_susceptible{1,2}etc.) match the existingbacterialSubpopRegexfor two-drug Bulitta life-cycle models. The drug and signal-molecule concentration states (cipm,cags,csig) are declared viapaper_specific_compartments.