Nalmefene (Laffont 2024)
Source:vignettes/articles/Laffont_2024_nalmefene.Rmd
Laffont_2024_nalmefene.RmdModel and source
- Citation: Laffont CM, Purohit P, Delcamp N, Gonzalez-Garcia I, Skolnick P. Comparison of intranasal naloxone and intranasal nalmefene in a translational model assessing the impact of synthetic opioid overdose on respiratory depression and cardiac arrest. Front Psychiatry. 2024;15:1399803. doi:10.3389/fpsyt.2024.1399803
- Description: Population PK model for intranasal (IN) nalmefene HCl in healthy adult volunteers (Laffont 2024): two-compartment model with linear elimination, parallel zero-order plus lagged first-order absorption, and allometric body-weight scaling on apparent clearance.
- Article: Front Psychiatry. 2024;15:1399803
Population
The IN nalmefene population PK model was developed using pooled plasma concentration data from three healthy-volunteer studies described in Laffont 2024 Methods Section 2.2: two pharmacokinetic studies published by Crystal et al. (Clin Pharmacol Drug Dev, 2024; ref 22 in Laffont 2024) – a single 3 mg IN nalmefene HCl vs. 1 mg IM nalmefene study and a one-nostril vs. two-nostril 3 mg IN HCl per nostril study – and a pharmacodynamic remifentanil-induced respiratory depression study by Ellison et al. (Clin Pharmacol Drug Dev, 2024; ref 23 in Laffont 2024) under a hypercapnic gas mixture. The pooled cohort is adult healthy volunteers with median body weight 74.7 kg (the value used as the reference for allometric scaling on apparent clearance in Table 1). Detailed baseline demographics (N, age, sex, race) are given in Supplementary Table 1 of Laffont 2024, which is not on disk for this extraction.
The same information is available programmatically via
readModelDb("Laffont_2024_nalmefene")$population.
Source trace
Per-parameter origin is recorded as an in-file comment next to each
ini() entry in
inst/modeldb/specificDrugs/Laffont_2024_nalmefene.R. The
table below collects them for review.
| Equation / parameter | Value | Source location |
|---|---|---|
lcl (CL/F) |
log(63.7) L/h |
Table 1 |
e_wt_cl (allometric on CL/F) |
0.572 |
Table 1 (exponent of (WT/74.7) for CL/F) |
lvc (Vc/F) |
log(15.2) L |
Table 1 |
lq (Q/F) |
log(81.3) L/h |
Table 1 |
lvp (Vp/F) |
log(522) L |
Table 1 |
linka (INKA) |
log(0.497) 1/h |
Table 1 (intranasal first-order absorption rate constant) |
ld2 (D2) |
log(0.302) h |
Table 1 (zero-order absorption duration) |
linfk0 (INFK0) |
log(0.0485) |
Table 1 (fraction of IN dose with zero-order absorption) |
lalag1 (ALAG1) |
log(0.0615) h |
Table 1 (first-order absorption lag time) |
etalcl IIV |
log(1 + 0.154^2) |
Table 1: IIV CL/F = 15.4 %CV |
etalvc IIV |
log(1 + 2.11^2) |
Table 1: IIV Vc/F = 211 %CV |
etalinka IIV |
log(1 + 0.398^2) |
Table 1: IIV INKA = 39.8 %CV |
propSd (residual) |
0.333 |
Table 1: sigma^2 = 0.111 (33.3 %CV); log-additive in NONMEM == proportional in linear space |
| Structure | n/a | Section 3.1 Pharmacokinetic submodels: 2-compartment with linear elimination, parallel zero-order plus first-order absorption with lag on the first-order component |
The Table 1 estimates IMKA (1/h, IM first-order
absorption), IMFK0 (IM zero-order fraction),
FR (relative bioavailability of IN vs. IM), and
STDEFF (-0.349, proportional shift in INKA in the
pharmacodynamic study) are not carried into this nlmixr2lib model file
because the simulator targets the intranasal rescue setting only. See
“Assumptions and deviations” below.
Virtual cohort
Original observed data are not publicly available. The cohort below uses 200 virtual healthy adults with body weights drawn from a normal distribution centered on the 74.7 kg allometric reference, SD 12 kg (typical adult healthy-volunteer dispersion). A single 3 mg IN nalmefene HCl dose (the FDA-approved single nasal-spray dose) is administered at time 0 and plasma nalmefene is sampled out to 24 hours.
set.seed(20260509)
n_subj <- 200

cohort <- tibble(
  id = seq_len(n_subj),
  WT = pmax(45, rnorm(n_subj, mean = 74.7, sd = 12))
)

# rxode2 dosing convention for parallel zero-order + first-order absorption:
#   - row 1: dose to depot (first-order absorption, normal bolus)
#   - row 2: dose to central with rate = -2 (uses modeled dur(central) = D2)
# Both rows share the same time and the same total amt (3 mg = 3 mg HCl per
# nostril; in the rescue indication a single device delivers 3 mg HCl).
dose_amt_mg <- 3.0

doses <- bind_rows(
  cohort %>% mutate(time = 0, evid = 1L, amt = dose_amt_mg, rate = 0,  cmt = "depot"),
  cohort %>% mutate(time = 0, evid = 1L, amt = dose_amt_mg, rate = -2, cmt = "central")
)

obs_times <- c(seq(0.05, 1, by = 0.05),
               seq(1.5, 6, by = 0.5),
               seq(7, 24, by = 1))
obs <- cohort %>%
  tidyr::crossing(time = obs_times) %>%
  mutate(evid = 0L, amt = NA_real_, rate = 0, cmt = "depot")

events <- bind_rows(doses, obs) %>%
  arrange(id, time, desc(evid)) %>%
  select(id, time, evid, amt, rate, cmt, WT)
Simulation
mod <- readModelDb("Laffont_2024_nalmefene")
sim <- rxode2::rxSolve(mod, events = events, keep = "WT") %>%
  as.data.frame()
#> ℹ parameter labels from comments will be replaced by 'label()'
A typical-value (no between-subject variability) curve is also generated for visualizing the deterministic model prediction:
mod_typical <- mod |> rxode2::zeroRe()
#> ℹ parameter labels from comments will be replaced by 'label()'
sim_typical <- rxode2::rxSolve(
  mod_typical,
  events = events %>% filter(id == 1)
) %>% as.data.frame()
#> ℹ omega/sigma items treated as zero: 'etalcl', 'etalvc', 'etalinka'
Replicate published profile
The paper does not publish a numeric concentration-time table for IN nalmefene, but the structural form (2-compartment + parallel zero-order/first-order absorption with lag) is described in Section 3.1 and shown qualitatively in Supplementary Figures 2 (visual predictive check). The simulated profile below shows the typical-value curve and a 5th-95th percentile ribbon over the virtual cohort following a single 3 mg IN nalmefene HCl dose.
sim %>%
  group_by(time) %>%
  summarise(
    Q05 = quantile(Cc, 0.05, na.rm = TRUE),
    Q50 = quantile(Cc, 0.50, na.rm = TRUE),
    Q95 = quantile(Cc, 0.95, na.rm = TRUE),
    .groups = "drop"
  ) %>%
  ggplot(aes(time, Q50)) +
  geom_ribbon(aes(ymin = Q05, ymax = Q95), alpha = 0.25) +
  geom_line() +
  geom_line(
    data = sim_typical, aes(time, Cc),
    inherit.aes = FALSE, linetype = "dashed"
  ) +
  labs(x = "Time (h)", y = "Plasma nalmefene (ng/mL)",
       title = "Simulated plasma profile, single 3 mg IN nalmefene HCl",
       caption = "Solid line = median of 200 virtual subjects; ribbon = 5th-95th percentiles; dashed = typical-value (zeroRe) curve.")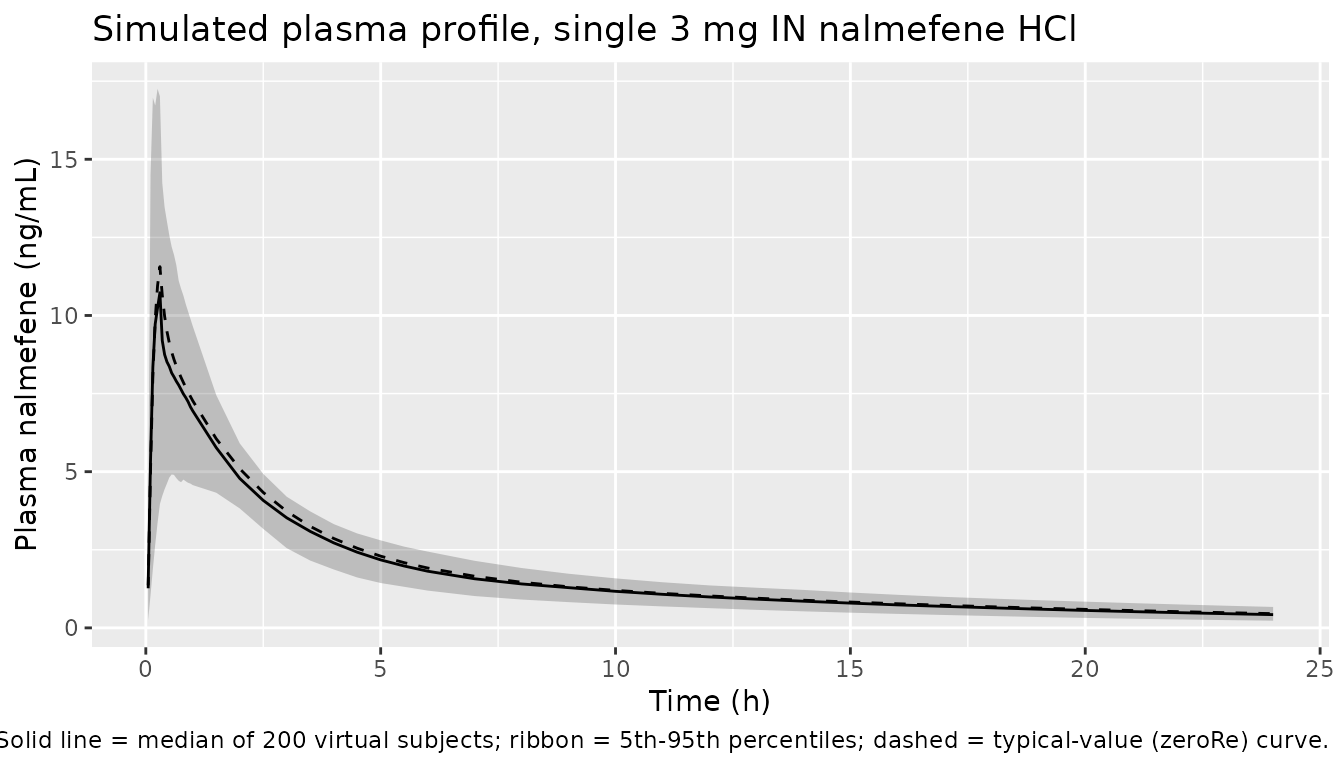
PKNCA validation
Use PKNCA to compute Cmax, Tmax, AUC0-inf, and terminal half-life on each virtual subject’s simulated profile. The treatment grouping variable is the fixed regimen “IN_3mg”.
sim_nca <- sim %>%
  mutate(treatment = "IN_3mg") %>%
  filter(!is.na(Cc)) %>%
  select(id, time, Cc, treatment)

conc_obj <- PKNCA::PKNCAconc(sim_nca, Cc ~ time | treatment + id)

dose_df <- doses %>%
  filter(cmt == "depot") %>%
  mutate(treatment = "IN_3mg") %>%
  select(id, time, amt, treatment)

dose_obj <- PKNCA::PKNCAdose(dose_df, amt ~ time | treatment + id)

intervals <- data.frame(
  start      = 0,
  end        = Inf,
  cmax       = TRUE,
  tmax       = TRUE,
  aucinf.obs = TRUE,
  half.life  = TRUE
)

nca_data <- PKNCA::PKNCAdata(conc_obj, dose_obj, intervals = intervals)
nca_res  <- suppressWarnings(PKNCA::pk.nca(nca_data))

knitr::kable(
  summary(nca_res),
  caption = "Simulated NCA parameters for a single 3 mg IN nalmefene HCl dose."
)| start | end | treatment | N | cmax | tmax | half.life | aucinf.obs |
|---|---|---|---|---|---|---|---|
| 0 | Inf | IN_3mg | 200 | 9.93 [44.5] | 0.300 [0.100, 4.00] | 10.2 [1.26] | NC |
Comparison against published values
Laffont 2024 does not report numeric Cmax / AUC for IN nalmefene, but the Discussion (page 10, paragraph following Tables 3-4) cites a plasma half-life of 7.1-11 hours from refs 22 (Crystal 2024) and 45 (Krieter 2019). The two-compartment model in this extraction supports a long terminal phase via the deep peripheral compartment (Vp/F = 522 L), and the simulated terminal half-life from PKNCA above should fall within or close to that 7-11 h range for typical body weights. Differences greater than a factor of two would suggest a misinterpretation of the parameter table; values within the published range are evidence the structural form and parameter values were extracted correctly.
Assumptions and deviations
-
IM (intramuscular) route omitted. Laffont 2024
Table 1 reports
IMKA= 0.156 1/h,IMFK0= 0.0170, andFR= 0.834 (relative bioavailability of IN vs. IM) for the IM arm of the population PK fit. The IM arm exists only because Crystal et al. 2024 included a 1 mg IM reference dose; the rescue indication for nalmefene is intranasal, so the Laffont_2024_nalmefene model file simulates only the IN route. To extend the model to IM, replaceinkawithimkain themodel()block, set the zero-order fraction toIMFK0, and divide CL/F by FR (= 0.834) to back out the absolute IM CL. -
STDEFF (proportional shift in INKA under hypercapnic mask)
set to zero. Laffont 2024 Table 1 reports
STDEFF= -0.349, a multiplicative shift on log(INKA) that the population PK model applies only when the data come from the Ellison 2024 pharmacodynamic study (subjects breathing a hypercapnic 50 % O2 / 43 % N2 / 7 % CO2 mixture through a tight-fitting mask). The paper notes (Section 3.1) that for opioid-overdose rescue simulations the authors used absorption parameters estimated outside the hypercapnic mask, i.e.,STDEFF= 0. The Laffont_2024_nalmefene model file follows that rescue-setting convention and does not expose STDEFF. To recreate the hypercapnic-mask absorption, multiplyinkabyexp(-0.349)(~ 0.71x). -
Detailed baseline demographics deferred to Supplementary
Table 1. The main text gives only the median body weight (74.7
kg) used as the allometric reference. N, age range, sex balance, and
race distribution are in Supplementary Table 1, which is not on disk;
the
populationmetadata carries TODO markers for those fields. - No native PD layer in this model file. Laffont 2024 expands the Mann et al. 2022 translational model (mu-opioid receptor competitive binding, ventilatory drives, gas exchange, blood-flow control) using the IN nalmefene PK developed here as the input. That mechanistic PD layer is deterministic, has no IIV / residual error, sources its binding parameters from a separate paper (Cassel et al. 2005), and is hosted as a C-coded GitHub project external to the paper. It is out of scope for nlmixr2lib’s population-PK library; users who need the PD respiratory-depression / cardiac-arrest endpoint should follow the GitHub link in the Laffont 2024 Methods Section 2.1.