Dostarlimab (Melhem 2022)
Source:vignettes/articles/Melhem_2022_dostarlimab.Rmd
Melhem_2022_dostarlimab.RmdModel and source
- Citation: Melhem M, Hanze E, Lu Z, Venkatakrishnan K, Gupta N, Vugmeyster Y. Population pharmacokinetics and exposure-response of anti-programmed cell death protein-1 monoclonal antibody dostarlimab in advanced solid tumours. Br J Clin Pharmacol. 2022;88(9):4142-4154. doi:[10.1111/bcp.15339](https://doi.org/10.1111/bcp.15339)
- Description: Two-compartment population PK model for dostarlimab (anti-PD-1 IgG4) with time-dependent (sigmoid I_max) clearance in adults with advanced solid tumours.
- Modality: Therapeutic monoclonal antibody (IgG4 hinge-stabilized), IV infusion.
Dostarlimab is an anti-PD-1 monoclonal antibody. The Melhem 2022 paper developed a population PK model from the Phase 1 GARNET trial (NCT02715284) supporting the recommended therapeutic dose regimen of 500 mg IV Q3W for four cycles followed by 1000 mg IV Q6W.
Structure: linear two-compartment IV model with time-dependent clearance via a sigmoid I_max function of time since first dose:
with (a fractional decrease in log-CL at ; , matching the paper’s “maximum reduction of 14.9%”), days, and . Allometric weight scaling uses reference weight 70 kg (exponent 0.470 on CL, 0.419 on Vc and Vp).
Population
The final-model population was 546 patients with 4783 PK observations (after exclusion of 21 records with absolute conditional weighted residual > 5) drawn from a single multinational Phase 1 trial across multiple expansion cohorts (Melhem 2022 Tables 1-2):
- 23.4% mismatch repair-deficient (dMMR/MSI-H) endometrial cancer (EC),
- 29.3% mismatch repair-proficient (MMRp/MSS) EC,
- 12.3% non-small-cell lung cancer (NSCLC),
- 28.8% non-EC dMMR/MSI-H or POLE-mutant tumours,
- and an ovarian-cancer cohort.
Demographics: median age 64 years (range 24-86), 77.3% female, median weight 71.4 kg (range 34-182), median albumin 39 g/L, median ALT 17 U/L. Hepatic and renal impairment were present at baseline (mild-to-moderate in 11% and 61% of patients respectively) but did not affect dostarlimab PK. ADAs ever-positive in 18.5% of patients but had no impact on clearance.
The reference patient used in the published forest plot (Methods, PopPK model development, last paragraph) is female, 70 kg, 64 years old, with baseline albumin 39 g/L and ALT 18 U/L.
The same metadata is available programmatically via
readModelDb("Melhem_2022_dostarlimab")$population.
Source trace
The per-parameter origin is recorded as an in-file comment next to
each ini() entry in
inst/modeldb/specificDrugs/Melhem_2022_dostarlimab.R. The
table below collects them in one place for review.
| Parameter (model name) | Value | Source |
|---|---|---|
lcl (CL_base, L/day) |
log(0.179) | Melhem 2022 Table 3, CL |
lvc (Vc_base, L) |
log(2.98) | Melhem 2022 Table 3, Vc |
lq (Q, L/day) |
log(0.547) | Melhem 2022 Table 3, Q |
lvp (Vp, L) |
log(2.10) | Melhem 2022 Table 3, Vp |
lImax (log|I_max|) |
log(0.161) | Melhem 2022 Table 3, I_max = -0.161 |
lt50 (T50, days) |
log(108) | Melhem 2022 Table 3, T50 |
lhill (Hill) |
log(5.29) | Melhem 2022 Table 3, Hill |
e_wt_cl |
0.470 | Melhem 2022 Table 3, Effect of WT on CL |
e_wt_vc_vp |
0.419 | Melhem 2022 Table 3, Effect of WT on Vc and Vp |
e_age_cl |
-0.227 | Melhem 2022 Table 3, Effect of age on CL |
e_alb_cl |
-1.01 | Melhem 2022 Table 3, Effect of ALB on CL |
e_alt_cl |
-0.0585 | Melhem 2022 Table 3, Effect of ALT on CL |
e_alb_vc |
-0.153 | Melhem 2022 Table 3, Effect of ALB on Vc |
e_sex_cl |
0.165 | Melhem 2022 Table 3, Effect of male on CL |
e_sex_vc |
0.162 | Melhem 2022 Table 3, Effect of male on Vc |
IIV block etalcl + etalvc
|
c(0.0551, 0.0210, 0.0258) | Melhem 2022 Table 3 (omega^2 and covariance) |
etalImax |
0.537 | Melhem 2022 Table 3, omega^2 I_max |
propSd |
0.133 | Melhem 2022 Table 3, proportional residual |
addSd (mg/L) |
2.79 | Melhem 2022 Table 3, additive residual |
Equations:
-
d/dt(central)andd/dt(peripheral1): standard two-compartment IV micro-constant form (kel = cl/vc, k12 = q/vc, k21 = q/vp). Source: Melhem 2022 Results, equation block (“The final PopPK model is mathematically described by the following equations”). - Time-dependent CL via exp-Hill: same equation block.
- Covariate effects on CL and Vc: power form (cov / ref)^theta for continuous covariates, multiplicative (1 + theta * SEXM) for sex.
Virtual cohort
Original observed data are not publicly available. The simulations below use a virtual cohort whose covariate distributions approximate the published trial demographics (Melhem 2022 Table 2).
set.seed(2022)
n_subj <- 200

cohort <- tibble(
  ID   = seq_len(n_subj),
  WT   = pmin(pmax(rlnorm(n_subj, log(71.4), 0.27), 34),  182),  # Table 2: median 71.4 kg, range 34-182
  AGE  = pmin(pmax(rnorm(n_subj,  62.5, 11.0),       24),  86),  # Table 2: mean 62.5, range 24-86
  ALB  = pmin(pmax(rnorm(n_subj,  38.2, 5.1),        19,        51)),  # Table 2: mean 38.2 g/L, range 19-51
  ALT  = pmin(pmax(rlnorm(n_subj, log(17), 0.5),     2.9),      120),  # Table 2: median 17, range 2.9-120
  SEXF = rbinom(n_subj, 1, 0.773)                                       # Table 2: 77.3% female
)
The recommended therapeutic dose (RTD) is 500 mg IV Q3W for four cycles followed by 1000 mg IV Q6W. The simulation runs for one year of dosing.
# RTD schedule (days from first dose).
loading_doses_d <- seq(0, by = 21, length.out = 4)              # 500 mg Q3W x 4
maint_start_d   <- max(loading_doses_d) + 21                    # first 1000 mg dose 21 d after the 4th 500 mg
maint_doses_d   <- seq(maint_start_d, by = 42, length.out = 12) # 1000 mg Q6W

obs_times_d <- sort(unique(c(seq(0, 365, by = 1), loading_doses_d, maint_doses_d)))

build_events <- function(pop) {
  d_load <- pop |>
    tidyr::crossing(TIME = loading_doses_d) |>
    mutate(AMT = 500, EVID = 1, CMT = "central", DUR = 0.5 / 24, DV = NA_real_,
           treatment = "RTD 500 mg Q3W x4 -> 1000 mg Q6W")
  d_maint <- pop |>
    tidyr::crossing(TIME = maint_doses_d) |>
    mutate(AMT = 1000, EVID = 1, CMT = "central", DUR = 0.5 / 24, DV = NA_real_,
           treatment = "RTD 500 mg Q3W x4 -> 1000 mg Q6W")
  d_obs <- pop |>
    tidyr::crossing(TIME = obs_times_d) |>
    mutate(AMT = NA_real_, EVID = 0, CMT = "central", DUR = NA_real_,
           DV = NA_real_, treatment = "RTD 500 mg Q3W x4 -> 1000 mg Q6W")
  dplyr::bind_rows(d_load, d_maint, d_obs) |>
    dplyr::arrange(ID, TIME, dplyr::desc(EVID)) |>
    as.data.frame()
}

events <- build_events(cohort)
Simulation
mod <- readModelDb("Melhem_2022_dostarlimab")
sim <- rxSolve(mod, events = events, returnType = "data.frame")
Concentration-time profiles
Median and 5-95th percentile envelope across the virtual cohort under the recommended therapeutic dose:
sim_summary <- sim |>
  dplyr::filter(time > 0) |>
  dplyr::group_by(time) |>
  dplyr::summarise(
    median = stats::median(Cc, na.rm = TRUE),
    lo     = stats::quantile(Cc, 0.05, na.rm = TRUE),
    hi     = stats::quantile(Cc, 0.95, na.rm = TRUE),
    .groups = "drop"
  )

ggplot(sim_summary, aes(time, median)) +
  geom_ribbon(aes(ymin = lo, ymax = hi), alpha = 0.2, fill = "steelblue") +
  geom_line(linewidth = 1, colour = "steelblue") +
  labs(
    x = "Time (days)",
    y = "Dostarlimab serum concentration (mg/L)",
    title = "Simulated dostarlimab PK at the recommended therapeutic dose",
    subtitle = paste0("Median and 90% prediction interval (N = ",
                      n_subj, " virtual patients)"),
    caption = "Model: Melhem 2022 Br J Clin Pharmacol 88(9):4142-4154"
  ) +
  theme_bw()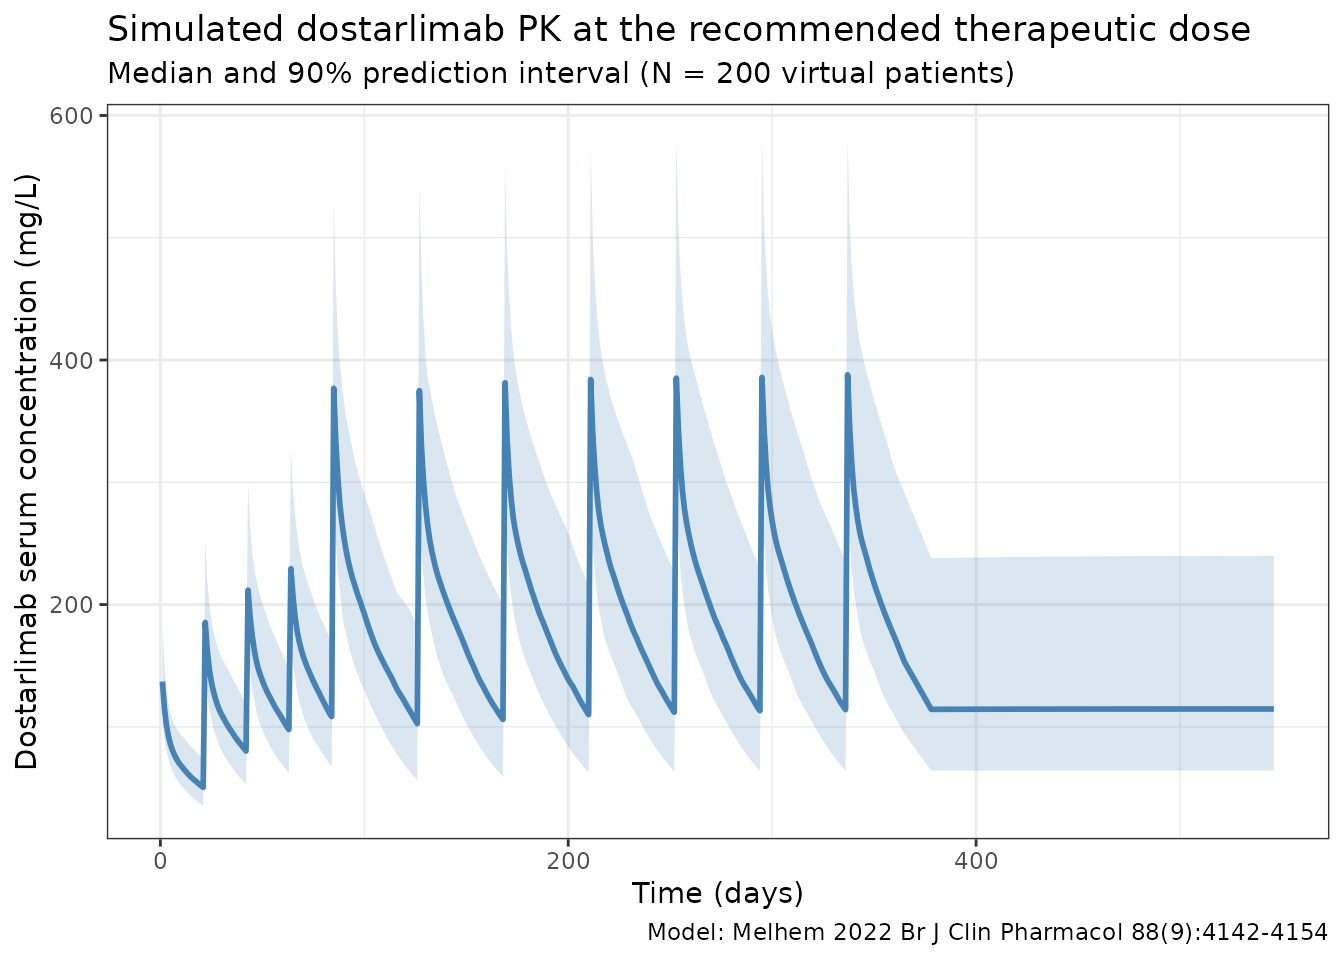
Time-dependent clearance
Melhem 2022 reports time-dependent clearance with a sigmoid I_max function of time since first dose. The typical-value CL profile below reproduces the time course at the reference patient (deterministic, etas = 0):
t_grid <- seq(0, 365, by = 5)
events_cl <- data.frame(
  ID   = 1, WT = 70, AGE = 64, ALB = 39, ALT = 18, SEXF = 1,
  TIME = c(0, t_grid),
  AMT  = c(500, rep(NA_real_, length(t_grid))),
  EVID = c(1,  rep(0, length(t_grid))),
  CMT  = "central",
  DUR  = c(0.5 / 24, rep(NA_real_, length(t_grid))),
  DV   = NA_real_
)
sim_cl <- rxSolve(
  mod, events = events_cl,
  params = c(WT = 70, AGE = 64, ALB = 39, ALT = 18, SEXF = 1,
             etalcl = 0, etalvc = 0, etalImax = 0),
  omega  = NA,
  returnType = "data.frame"
)
sim_cl <- sim_cl[sim_cl$time > 0, ]

ggplot(sim_cl, aes(time, cl / cl_base)) +
  geom_line(linewidth = 1, colour = "steelblue") +
  geom_hline(yintercept = exp(-0.161), linetype = "dashed", colour = "grey40") +
  labs(
    x = "Time since first dose (days)",
    y = "CL(t) / CL(0)",
    title = "Time-dependent clearance in Melhem 2022",
    subtitle = "Reference patient; asymptotes at exp(I_max) = 0.851 (14.9% reduction)"
  ) +
  theme_bw()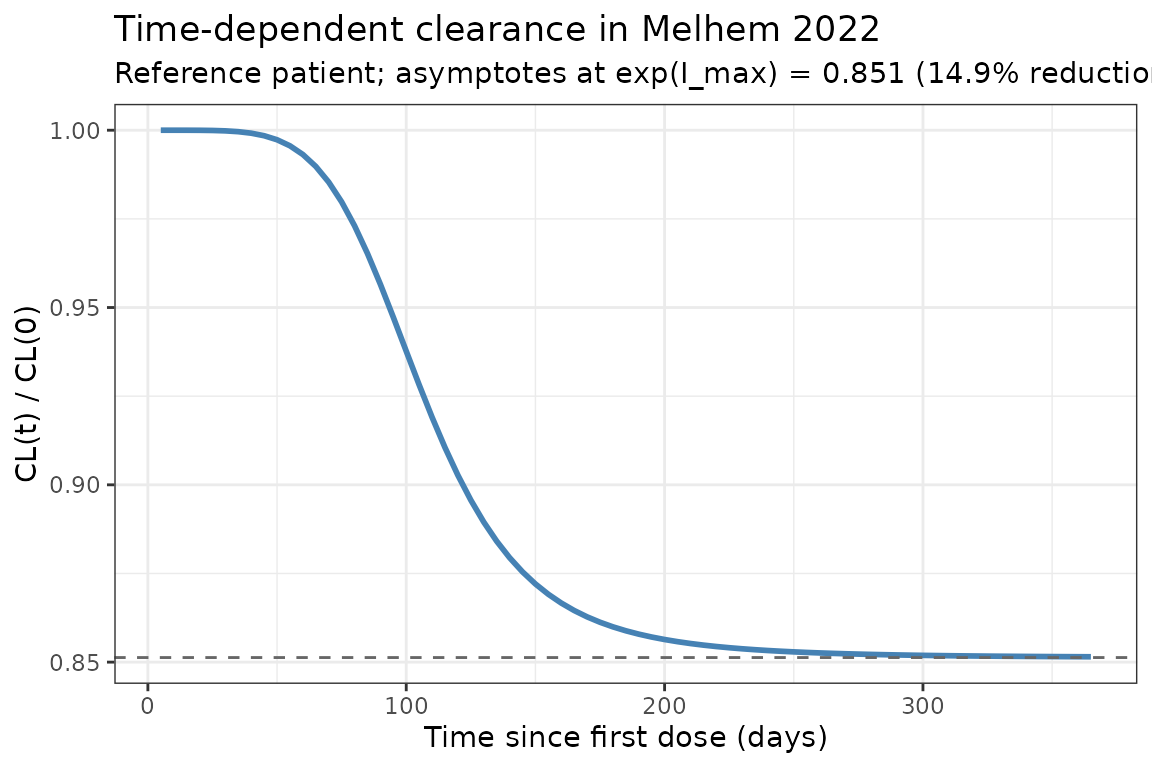
PKNCA validation
NCA computed over the third 21-day dosing interval (2nd-3rd 500 mg dose window, days 21-42 after first dose) for the simulated reference cohort:
interval_start <- 21
interval_end   <- 42

sim_nca <- sim |>
  dplyr::filter(!is.na(Cc),
                time >= interval_start,
                time <= interval_end) |>
  dplyr::mutate(time_rel  = time - interval_start,
                treatment = "RTD 500 mg Q3W x4 -> 1000 mg Q6W") |>
  dplyr::select(id, treatment, time_rel, Cc)

conc_obj <- PKNCA::PKNCAconc(sim_nca, Cc ~ time_rel | treatment + id)

dose_df <- data.frame(
  id        = cohort$ID,
  treatment = "RTD 500 mg Q3W x4 -> 1000 mg Q6W",
  time_rel  = 0,
  amt       = 500
)
dose_obj <- PKNCA::PKNCAdose(dose_df, amt ~ time_rel | treatment + id)

intervals <- data.frame(
  start     = 0,
  end       = 21,
  cmax      = TRUE,
  tmax      = TRUE,
  auclast   = TRUE,
  half.life = TRUE
)

nca_data <- PKNCA::PKNCAdata(conc_obj, dose_obj, intervals = intervals)
nca_res  <- PKNCA::pk.nca(nca_data)
knitr::kable(summary(nca_res),
caption = "Simulated NCA parameters (3rd dosing interval, days 21-42 after first dose)")| start | end | treatment | N | auclast | cmax | tmax | half.life |
|---|---|---|---|---|---|---|---|
| 0 | 21 | RTD 500 mg Q3W x4 -> 1000 mg Q6W | 200 | 2310 [19.9] | 186 [17.7] | 1.00 [1.00, 1.00] | 25.8 [5.12] |
Comparison against published NCA
Melhem 2022 Table 4 reports per-patient cycle-1 (Day 21) exposure summary statistics for the efficacy ER subset (N = 362, all from the RTD Part 2B arm):
| Metric | Published (Table 4) | Notes |
|---|---|---|
| Cmin (mg/L) | mean 41.3 (SD 10.5), range 13.7-70.2 | Cycle 1 trough, RTD |
| Cmax (mg/L) | mean 177 (SD 32.8), range 103-284 | Cycle 1 peak, RTD |
| AUC (mg*h/L) | mean 34 400 (SD 6090), range 19 100-51 000 | Cycle 1 over 21 d, RTD |
Note the published AUC is reported in mgh/L but
is computed over the 21-day cycle 1 interval; the simulated
auclast from PKNCA in the table above is in
mgday/L because the simulation time variable is
in days. Multiplying simulated auclast by 24 converts to
mg*h/L for comparison. Simulated cycle-1 Cmax in the 150-200 mg/L range
(single 500 mg dose into ~3 L Vc, with a small fraction redistributed
peripherally by day 1) is consistent with the published Table 4 mean of
177 mg/L.
Assumptions and deviations
-
Residual error convention. Melhem 2022 Table 3
reports the proportional residual variability as 0.133 (unitless) and
the additive residual variability as 2.79 mg/L. The additive entry
carries the units of the observation (mg/L, not mg2/L2),
indicating that the table column is the standard deviation, not
the variance. Both entries are therefore used directly as
propSdandaddSdin nlmixr2’s combinedadd(addSd) + prop(propSd)form. A 13.3% CV is consistent with mAb assay residuals reported in comparable anti-PD-1 papers. -
Imax parameterization. I_max is always negative in
the source (-0.161). To keep every individual I_max strictly negative
under log-normal IIV, the model stores log|I_max| and applies the
negative sign in the
model()block:Imax_i <- -exp(lImax + etalImax). The table’s omega^2_Imax = 0.537 maps to omega = sqrt(0.537) = 0.733, which the paper labels “73.3% CV” — i.e., omega is reported as a CV without the log-normal CV = sqrt(exp(omega^2) - 1) correction. The packaged model uses 0.537 directly as the variance ofetalImax, preserving the paper’s table value at the cost of a ~10 percentage- point divergence between “labelled CV” and “true log-normal CV”; the same parameterization is used byMasters_2022_avelumab.R. - Albumin units typo in Methods. The Methods text describes the reference patient with “ALB 39 g dL-1”, but Table 2 lists albumin in g/L (median 39, range 19-51). 39 g/dL is physiologically impossible (normal serum albumin is 35-50 g/L = 3.5-5 g/dL). The model uses g/L as the canonical unit and 39 g/L as the reference, consistent with Table 2 and with the same range reported elsewhere in the paper.
-
Time variable. The packaged model uses rxode2’s
t(simulation time in days) for the time-dependent CL term. Simulations must therefore start at t = 0 with the first dose so that the time-on-CL profile aligns with the source’s “time since first dose” convention. -
Time-varying covariates. ALB and ALT enter the
published model as time-varying covariates. The simulations in this
vignette hold each subject’s ALB and ALT fixed at their baseline value
over the dosing window. Modelling on-treatment ALB/ALT trajectories is
out of scope for the packaged structural model; users with longitudinal
lab data can pass time-varying ALB / ALT columns to
rxSolvedirectly via the event table. -
Race / ethnicity in the cohort. The simulated
cohort does not include explicit race / ethnicity columns because race
did not enter the final population PK model in Melhem 2022. The race
distribution in the published analysis set (Table 2: 75.1% White, 3.5%
Black, 2.4% Asian, 16.3% Not reported) is recorded in the model’s
populationmetadata for users who need to stratify simulations. -
Race covariates not declared. No
RACE_*covariate is registered incovariateDatabecause the structural model has no race effect. - Erratum. A 15 June 2022 publisher correction was issued for the copyright line only; no parameter, equation, or unit was changed.