Mavacamten exposure-response for LVOT gradient and LVEF (Merali 2024)
Source:vignettes/articles/Merali_2024_mavacamten.Rmd
Merali_2024_mavacamten.RmdModel and source
Merali 2024 developed two exposure-response (E-R) models for the
echocardiographic endpoints that guide mavacamten dose titration in
hypertrophic cardiomyopathy (HCM): the Valsalva left ventricular outflow
tract gradient (VLVOTg, efficacy) and the left ventricular ejection
fraction (LVEF, safety). Both are driven by Cavg168, the average
mavacamten plasma concentration over the week before the echocardiogram.
The paper then linked them to the sponsor population PK model to compare
dose-titration regimens; that PK model is packaged as
Chang_2024_mavacamten.
- Citation: Merali S, Salinger DH, Palmisano M, Sehnert AJ, Thanneer N, Back H, Seroogy JD, Gretler DD, Roy A, Perera V. Recommendation of mavacamten posology by model-based analyses in adults with obstructive hypertrophic cardiomyopathy. CPT Pharmacometrics Syst Pharmacol. 2024;13(9):1448-1461. doi:10.1002/psp4.13138. PMID: 38695527. PMCID: PMC11533099.
- Efficacy model: Exposure-response (efficacy) model for the Valsalva left ventricular outflow tract (LVOT) peak gradient in adults with obstructive hypertrophic cardiomyopathy given mavacamten or placebo (Merali 2024). The gradient is the individual baseline value VLVOTg0, times an exponential placebo time course that declines to a fixed 87.67% of baseline, times exp(-kMAVA * Cavg168), where Cavg168 (CAV) is the average mavacamten plasma concentration over the 168 h before the echocardiogram, supplied from a population PK model such as Chang_2024_mavacamten. The observed baseline gradient enters VLVOTg0 and kMAVA, and baseline NT-proBNP enters VLVOTg0, as power terms; correlated log-normal IIV on VLVOTg0 and kMAVA and an exponential residual error. The paired safety model is Merali_2024_mavacamten_lvef.
- Safety model: Exposure-response (safety) model for left ventricular ejection fraction (LVEF) in adults with obstructive or nonobstructive hypertrophic cardiomyopathy given mavacamten or placebo (Merali 2024). LVEF is the individual baseline value LVEF0 times (1 - kMAVA * Cavg168^qq), where Cavg168 (CAV) is the average mavacamten plasma concentration over the 168 h before the echocardiogram, supplied from a population PK model such as Chang_2024_mavacamten; there is no placebo effect. The observed baseline LVEF, nonobstructive HCM and female sex enter LVEF0; the observed baseline LVEF and studies other than EXPLORER-HCM enter kMAVA, and studies other than EXPLORER-HCM shift the exposure exponent qq. Correlated log-normal IIV on LVEF0 and kMAVA and a log-normal residual error. The paired efficacy model is Merali_2024_mavacamten_lvot_gradient_valsalva.
- Article: https://doi.org/10.1002/psp4.13138 (open access)
The two models are separate files because the authors fitted them separately, to different analysis sets.
Population
The VLVOTg model was fitted to 3597 observations from 272 patients with obstructive HCM in PIONEER-HCM, EXPLORER-HCM, PIONEER-OLE and the EXPLORER-LTE cohort of MAVA-LTE. The LVEF model was fitted to 4175 observations from 331 patients: the same 272 patients with obstructive HCM plus 59 patients with nonobstructive HCM from MAVERICK-HCM. Baseline covariates (Table S2): LVEF mean 74% (SD 5.9) and 73% (6.4), VLVOTg mean 75.1 mmHg (34.0) and 63.5 (39.7), 40.8% and 43.5% female, about three quarters on a beta-blocker, NYHA class II in about 72%. Patients who continued from a parent study into an extension had their baseline values reset for the extension. Age and body weight are not reported for the analysis sets.
The same information is available programmatically via
readModelDb("Merali_2024_mavacamten_lvef")()$population.
Source trace
| Equation / parameter | Value | Source location |
|---|---|---|
VLVOTg = VLVOTg0 * PBO(t) * exp(-kMAVA * Cavg168) |
– | Results, first equation |
PBO(t) = PBOMAX + (1 - PBOMAX) * exp(-kPBO * t) |
– | Results, second equation |
lrbase (log VLVOTg0, ref.) |
4.22 | Table 2, ‘Log(VLVOTg0.REF), log(mm Hg)’ |
e_lvot_gradient_valsalva_bl_rbase |
0.521 | Table 2, ‘Log(VLVOTg0) ~ log(VLVOTg0/69)’ |
e_ntprobnp_rbase |
0.108 | Table 2, ‘Log(VLVOTg0) ~ log(NT-proBNP/736)’ |
lslope (log kMAVA, ref.) |
-5.66 | Table 2, ‘Log(kMAVA.REF), log(1/(ng/mL))’ |
e_lvot_gradient_valsalva_bl_slope |
0.438 | Table 2, ‘Log(kMAVA) ~ log(VLVOTg0/69)’ |
lkpbo |
log(0.0373 /week) | Table 2, ‘kPBO, 1/wk’ |
pbomax |
0.8767 (fixed) | Table 2, ‘VLVOTgPBOMAX’, and footnote |
etalrbase, etalslope
|
24.5%, 43.3% CV; r = 0.010 | Table 2, IIV rows |
expSd_lvot_gradient_valsalva |
0.468 | Table 2, ‘Residual SD (exponential error)’ |
LVEF = LVEF0 * (1 - kMAVA * Cavg168^qq) |
– | Results, third equation |
lrbase (LVEF0, ref.) |
log(74.0) | Table 2, ‘LVEF0.REF, %’ |
e_lvef_bl_rbase |
33.6 / 100 | Table 2, ‘LVEF0 ~ log(LVEF0/74), %’ |
e_dis_hcm_nonobstructive_rbase |
-3.24 / 100 | Table 2, ‘LVEF0 ~ nonobstructive HCM, %’ |
e_sexf_rbase |
1.40 / 100 | Table 2, ‘LVEF0 ~ female, %’ |
lslope (log kMAVA, ref.) |
-12.8 | Table 2, ‘Log(kMAVA.REF), 1/(ng/mL)’ |
e_study_explorerhcm_slope |
4.29 | Table 2, ‘Log(kMAVA.REF) ~ all studies except EXPLORER-HCM’ |
e_lvef_bl_slope |
1.73 | Table 2, ‘Log(kMAVA.REF) ~ log(LVEF0/74)’ |
pow (qq, ref.) |
1.69 | Table 2, ‘qqREF’ |
e_study_explorerhcm_pow |
-0.64 | Table 2, ‘qqREF ~ all studies except EXPLORER-HCM’ |
etalrbase, etalslope
|
SD 2.38 / 100; 61.6% CV; r = -0.062 | Table 2, IIV rows |
expSd_lvef |
4.80 / 100 | Table 2, ‘Residual SD’ |
| Reference patient | VLVOTg 69 mmHg, NT-proBNP 736 ng/L; male EXPLORER-HCM patient with obstructive HCM, LVEF 74% | Table 2 footnote |
Reference-patient exposure-response curves
With the random effects removed, the efficacy model at a long time after baseline (placebo effect fully developed) and the safety model are evaluated over a grid of Cavg168 values for the reference patients. For the LVEF model the curve is drawn for EXPLORER-HCM and for the other studies, whose exposure-response differs (Table 2).
mod_vlvotg <- readModelDb("Merali_2024_mavacamten_lvot_gradient_valsalva")
mod_lvef <- readModelDb("Merali_2024_mavacamten_lvef")

cav_grid <- seq(0, 1000, by = 25)
ref_vlvotg <- data.frame(
  id = 1L, time = 1000, evid = 0L, CAV = cav_grid,
  LVOT_GRADIENT_VALSALVA_BL = 69, NTPROBNP = 0.736
)
ref_lvef <- tidyr::expand_grid(
  STUDY_EXPLORERHCM = c(1, 0), CAV = cav_grid
) |>
  mutate(
    id = 1L, evid = 0L,
    LVEF_BL = 74, DIS_HCM_NONOBSTRUCTIVE = 0, SEXF = 0
  ) |>
  arrange(desc(STUDY_EXPLORERHCM), CAV) |>
  mutate(time = seq_len(n())) |>
  as.data.frame()

# Time does not enter the LVEF model, so the whole grid is one typical patient
# observed at successive nominal times; the efficacy grid sits at week 1000,
# where the placebo effect has reached PBOMAX.
ref_vlvotg$time <- 1000 + seq_len(nrow(ref_vlvotg)) * 1e-6

sim_ref_v <- rxode2::rxSolve(rxode2::zeroRe(mod_vlvotg), ref_vlvotg, keep = "CAV") |>
  as.data.frame()
#> ℹ parameter labels from comments will be replaced by 'label()'
#> ℹ omega/sigma items treated as zero: 'etalrbase', 'etalslope'
sim_ref_l <- rxode2::rxSolve(rxode2::zeroRe(mod_lvef), ref_lvef,
  keep = c("CAV", "STUDY_EXPLORERHCM")
) |>
  as.data.frame()
#> ℹ parameter labels from comments will be replaced by 'label()'
#> ℹ omega/sigma items treated as zero: 'etalrbase', 'etalslope'

p1 <- ggplot(sim_ref_v, aes(CAV, lvot_gradient_valsalva)) +
  geom_line() +
  geom_hline(yintercept = 30, linetype = "dashed") +
  labs(x = "Cavg168 (ng/mL)", y = "Valsalva LVOT gradient (mmHg)",
       title = "Efficacy (reference patient, steady placebo effect)")
p2 <- ggplot(sim_ref_l, aes(CAV, lvef,
  linetype = ifelse(STUDY_EXPLORERHCM == 1, "EXPLORER-HCM", "Other studies"))) +
  geom_line() +
  geom_hline(yintercept = 50, linetype = "dotted") +
  labs(x = "Cavg168 (ng/mL)", y = "LVEF (%)", linetype = NULL,
       title = "Safety (reference patient)") +
  theme(legend.position = "bottom")
print(p1)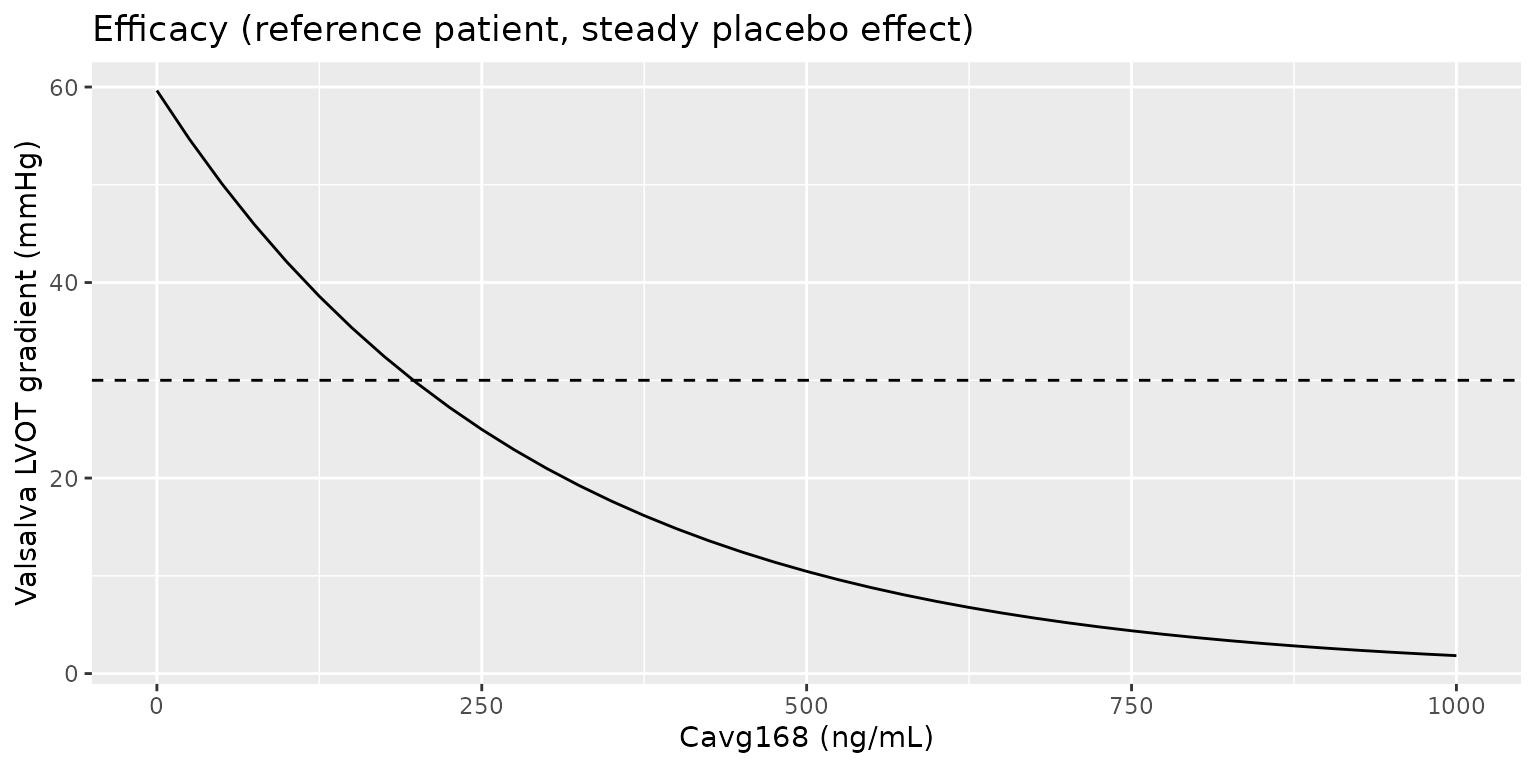
print(p2)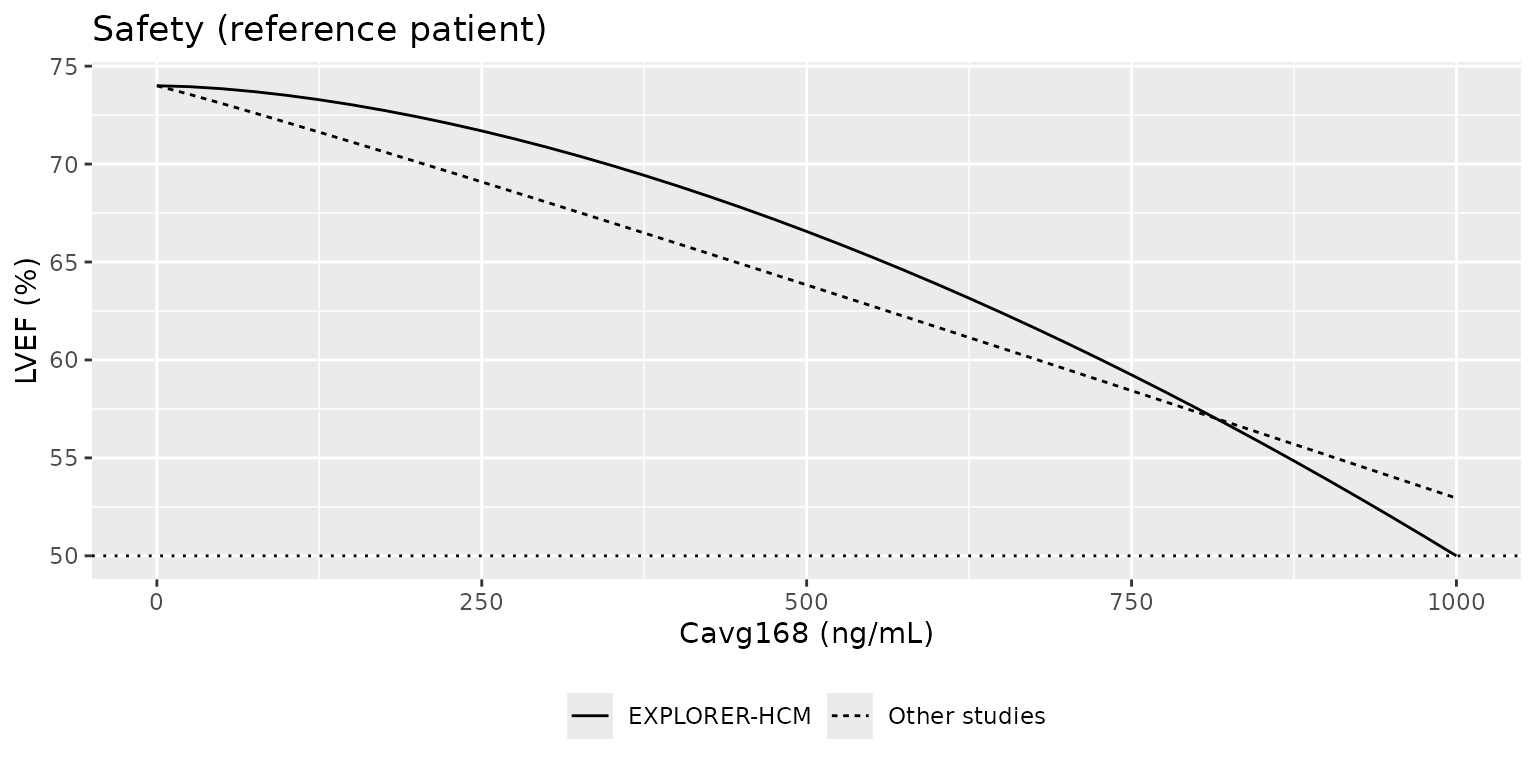
Closed-form and placebo checks
The paper states that the placebo effect “accounted for a maximum of
12.3% decline in VLVOTg from baseline”, i.e. 1 - PBOMAX.
The model output for the reference patient is also recomputed from the
Table 2 values directly.
closed_v <- exp(4.22) * 0.8767 * exp(-exp(-5.66) * cav_grid)
closed_l_explorer <- 74 * (1 - exp(-12.8) * cav_grid^1.69)
closed_l_other <- 74 * (1 - exp(-12.8 + 4.29) * cav_grid^(1.69 - 0.64))

placebo_decline_pct <- 100 * (1 - sim_ref_v$lvot_gradient_valsalva[1] / exp(4.22))

checks <- data.frame(
  Check = c(
    "Maximum placebo decline in VLVOTg (%)",
    "VLVOTg at Cavg168 = 400 ng/mL (mmHg)",
    "LVEF at Cavg168 = 400 ng/mL, EXPLORER-HCM (%)",
    "LVEF at Cavg168 = 400 ng/mL, other studies (%)"
  ),
  Model = c(
    placebo_decline_pct,
    sim_ref_v$lvot_gradient_valsalva[sim_ref_v$CAV == 400],
    sim_ref_l$lvef[sim_ref_l$CAV == 400 & sim_ref_l$STUDY_EXPLORERHCM == 1],
    sim_ref_l$lvef[sim_ref_l$CAV == 400 & sim_ref_l$STUDY_EXPLORERHCM == 0]
  ),
  Reference = c(
    12.3,
    closed_v[cav_grid == 400],
    closed_l_explorer[cav_grid == 400],
    closed_l_other[cav_grid == 400]
  )
)
checks |>
  mutate(across(c(Model, Reference), \(x) signif(x, 4))) |>
knitr::kable(caption = "Typical-value model output against the paper's statement and the Table 2 closed form.")| Check | Model | Reference |
|---|---|---|
| Maximum placebo decline in VLVOTg (%) | 12.33 | 12.30 |
| VLVOTg at Cavg168 = 400 ng/mL (mmHg) | 14.81 | 14.81 |
| LVEF at Cavg168 = 400 ng/mL, EXPLORER-HCM (%) | 68.90 | 68.90 |
| LVEF at Cavg168 = 400 ng/mL, other studies (%) | 65.95 | 65.95 |
# Same parameters on both sides (model vs. hand formula): differences are
# floating-point only. The placebo statement is printed to 3 figures.
stopifnot(
  abs(placebo_decline_pct - 12.3) < 0.05,
  all(abs(sim_ref_v$lvot_gradient_valsalva - closed_v) < 1e-6 * closed_v),
  all(abs(sim_ref_l$lvef[sim_ref_l$STUDY_EXPLORERHCM == 1] - closed_l_explorer) < 1e-6),
  all(abs(sim_ref_l$lvef[sim_ref_l$STUDY_EXPLORERHCM == 0] - closed_l_other) < 1e-6)
)
Covariate effects on the baseline parameters
th_v <- rxode2::rxode(mod_vlvotg)$theta
#> ℹ parameter labels from comments will be replaced by 'label()'
th_l <- rxode2::rxode(mod_lvef)$theta
#> ℹ parameter labels from comments will be replaced by 'label()'
cov_tab <- tibble::tribble(
  ~Parameter, ~Contrast, ~Ratio,
  "VLVOTg0", "baseline VLVOTg 40 vs 69 mmHg", (40 / 69)^th_v[["e_lvot_gradient_valsalva_bl_rbase"]],
  "VLVOTg0", "baseline VLVOTg 120 vs 69 mmHg", (120 / 69)^th_v[["e_lvot_gradient_valsalva_bl_rbase"]],
  "VLVOTg0", "NT-proBNP 3000 vs 736 ng/L", (3 / 0.736)^th_v[["e_ntprobnp_rbase"]],
  "kMAVA (VLVOTg)", "baseline VLVOTg 120 vs 69 mmHg", (120 / 69)^th_v[["e_lvot_gradient_valsalva_bl_slope"]],
  "LVEF0", "baseline LVEF 60 vs 74%", (60 / 74)^th_l[["e_lvef_bl_rbase"]],
  "LVEF0", "nonobstructive vs obstructive HCM", exp(th_l[["e_dis_hcm_nonobstructive_rbase"]]),
  "LVEF0", "female vs male", exp(th_l[["e_sexf_rbase"]]),
  "kMAVA (LVEF)", "baseline LVEF 60 vs 74%", (60 / 74)^th_l[["e_lvef_bl_slope"]],
  "kMAVA (LVEF)", "other studies vs EXPLORER-HCM", exp(th_l[["e_study_explorerhcm_slope"]])
)
cov_tab |>
  mutate(Ratio = signif(Ratio, 3)) |>
knitr::kable(caption = "Typical-value ratios implied by the Table 2 covariate effects.")| Parameter | Contrast | Ratio |
|---|---|---|
| VLVOTg0 | baseline VLVOTg 40 vs 69 mmHg | 0.753 |
| VLVOTg0 | baseline VLVOTg 120 vs 69 mmHg | 1.330 |
| VLVOTg0 | NT-proBNP 3000 vs 736 ng/L | 1.160 |
| kMAVA (VLVOTg) | baseline VLVOTg 120 vs 69 mmHg | 1.270 |
| LVEF0 | baseline LVEF 60 vs 74% | 0.932 |
| LVEF0 | nonobstructive vs obstructive HCM | 0.968 |
| LVEF0 | female vs male | 1.010 |
| kMAVA (LVEF) | baseline LVEF 60 vs 74% | 0.696 |
| kMAVA (LVEF) | other studies vs EXPLORER-HCM | 73.000 |
A patient with a lower observed baseline LVEF starts from a lower LVEF0 and also has a smaller kMAVA, so the relative LVEF reduction at a given exposure is smaller.
Linking to the PK model: the first four weeks
All the regimens Merali 2024 simulated start at 5 mg once daily, and the first titration decision is at week 4, so up to week 4 every regimen is the same and Table S3 (VLVOTg below 30 mmHg) and Table S4 (LVEF below 50%) report one value for all of them: 49.7% and 0.325% of 4000 virtual patients. Table 4 (5000 patients, representative CYP2C19 distribution) gives 50.8% and 0.2%.
This section rebuilds that week-4 snapshot for 200 virtual
EXPLORER-HCM patients: mavacamten 5 mg once daily for 4 weeks with
Chang_2024_mavacamten, Cavg168 from PKNCA over the last
week (hours 504 to 672), then both E-R models at week 4 with their
random effects and residual error, as in the paper’s simulations.
rxode2::rxSetSeed(20240501)
n_pat <- 200L

# CYP2C19 phenotype distribution of Table S1 (representative US / EU)
pheno_levels <- c("PM", "IM", "NM", "RM", "UM")
pheno_prob <- c(4.0, 20.9, 49.3, 22.8, 3.0) / 100

cohort <- tibble::tibble(
  id = seq_len(n_pat),
  phenotype = factor(sample(pheno_levels, n_pat, replace = TRUE, prob = pheno_prob),
    levels = pheno_levels),
  WT = pmin(pmax(rnorm(n_pat, 81.1, 16.9), 45), 150),
  CRCL = pmin(pmax(rnorm(n_pat, 94.5, 18), 30), 150),
  SEXF = rbinom(n_pat, 1, 0.408),
  # Table S2 VLVOTg-set baseline gradient, mean 75.1 (SD 34.0) mmHg, log-normal
  LVOT_GRADIENT_VALSALVA_BL = rlnorm(n_pat, log(75.1) - 0.5 * log(1 + (34 / 75.1)^2),
    sqrt(log(1 + (34 / 75.1)^2))),
  # Table S2 baseline LVEF, mean 74% (SD 5.9); EXPLORER-HCM enrolled LVEF >= 55%
  LVEF_BL = pmin(pmax(rnorm(n_pat, 74, 5.9), 55), 90),
  # NT-proBNP in ng/mL, log-normal around the 736 ng/L reference (spread assumed)
  NTPROBNP = rlnorm(n_pat, log(0.736), 1)
) |>
  mutate(
    CYP2C19_PM = as.integer(phenotype == "PM"),
    CYP2C19_IM = as.integer(phenotype == "IM"),
    CYP2C19_RM = as.integer(phenotype == "RM"),
    CYP2C19_UM = as.integer(phenotype == "UM"),
    CYP2C19_MISSING = 0L, DIS_HEALTHY = 0L, FED = 0L, FORM_SOLUTION = 0L,
    CONMED_OMEPRAZOLE = 0L, CONMED_ESOMEPRAZOLE = 0L, STUDY_MYK461014 = 0L,
    DOSE_MAVACAMTEN_MG = 5,
    STUDY_EXPLORERHCM = 1L, DIS_HCM_NONOBSTRUCTIVE = 0L
  )

pk_cov <- c("WT", "CRCL", "SEXF", "CYP2C19_PM", "CYP2C19_IM", "CYP2C19_RM",
  "CYP2C19_UM", "CYP2C19_MISSING", "DIS_HEALTHY", "FED", "FORM_SOLUTION",
  "CONMED_OMEPRAZOLE", "CONMED_ESOMEPRAZOLE", "STUDY_MYK461014", "DOSE_MAVACAMTEN_MG")

dose_rows <- cohort |>
  select(id, all_of(pk_cov)) |>
  tidyr::expand_grid(time = seq(0, 27 * 24, by = 24)) |>
  mutate(evid = 1L, amt = 5, cmt = "depot")
obs_rows <- cohort |>
  select(id, all_of(pk_cov)) |>
  tidyr::expand_grid(time = seq(504, 672, by = 2)) |>
  mutate(evid = 0L, amt = 0, cmt = "central")
pk_events <- bind_rows(dose_rows, obs_rows) |>
  select(id, time, evid, amt, cmt, everything()) |>
  arrange(id, time, desc(evid)) |>
  as.data.frame()
mod_pk <- readModelDb("Chang_2024_mavacamten")
sim_pk <- rxode2::rxSolve(mod_pk, events = pk_events) |>
  as.data.frame() |>
  left_join(cohort |> select(id, phenotype), by = "id")
#> ℹ parameter labels from comments will be replaced by 'label()'
PKNCA: Cavg168 at week 4
nca_conc <- sim_pk |>
  filter(!is.na(Cc)) |>
  select(id, time, Cc, phenotype)
nca_dose <- pk_events |>
  filter(evid == 1) |>
  select(id, time, amt) |>
  left_join(cohort |> select(id, phenotype), by = "id")

conc_obj <- PKNCA::PKNCAconc(nca_conc, Cc ~ time | phenotype + id)
dose_obj <- PKNCA::PKNCAdose(nca_dose, amt ~ time | phenotype + id)
intervals <- data.frame(start = 504, end = 672, cav = TRUE, cmax = TRUE, cmin = TRUE)
nca_res <- PKNCA::pk.nca(PKNCA::PKNCAdata(conc_obj, dose_obj, intervals = intervals))

cavg168 <- as.data.frame(nca_res$result) |>
  filter(PPTESTCD == "cav") |>
  select(id, phenotype, CAV = PPORRES)

cavg168 |>
  group_by(phenotype) |>
  summarise(
    n = n(),
    median = signif(median(CAV), 3),
    p05 = signif(quantile(CAV, 0.05), 3),
    p95 = signif(quantile(CAV, 0.95), 3),
    .groups = "drop"
  ) |>
  rename(
    "CYP2C19 phenotype" = phenotype,
    "N" = n,
    "Median Cavg168 (ng/mL)" = median,
    "5th percentile" = p05,
    "95th percentile" = p95
  ) |>
knitr::kable(caption = "Simulated Cavg168 over week 4 of mavacamten 5 mg once daily.")| CYP2C19 phenotype | N | Median Cavg168 (ng/mL) | 5th percentile | 95th percentile |
|---|---|---|---|---|
| PM | 5 | 441 | 221.0 | 596 |
| IM | 44 | 247 | 117.0 | 452 |
| NM | 93 | 195 | 79.6 | 358 |
| RM | 48 | 187 | 97.2 | 369 |
| UM | 10 | 230 | 77.8 | 319 |
Echocardiographic endpoints at week 4
er_events <- cohort |>
  left_join(cavg168 |> select(id, CAV), by = "id") |>
  mutate(time = 4, evid = 0L) |>
  select(id, time, evid, CAV, LVOT_GRADIENT_VALSALVA_BL, NTPROBNP, LVEF_BL,
    SEXF, DIS_HCM_NONOBSTRUCTIVE, STUDY_EXPLORERHCM) |>
  as.data.frame()

rxode2::rxSetSeed(20240502)
sim_v4 <- rxode2::rxSolve(mod_vlvotg, er_events,
  keep = c("CAV", "LVOT_GRADIENT_VALSALVA_BL")) |>
  as.data.frame()
#> ℹ parameter labels from comments will be replaced by 'label()'
sim_l4 <- rxode2::rxSolve(mod_lvef, er_events, keep = c("CAV", "LVEF_BL")) |>
  as.data.frame()
#> ℹ parameter labels from comments will be replaced by 'label()'

week4 <- data.frame(
  Endpoint = c("VLVOTg < 30 mmHg (%)", "LVEF < 50% (%)"),
  Simulated = c(100 * mean(sim_v4$sim < 30), 100 * mean(sim_l4$sim < 50)),
  `Table S3 / S4` = c(49.7, 0.325),
  `Table 4` = c(50.8, 0.2),
  check.names = FALSE
)
week4 |>
  mutate(Simulated = round(Simulated, 1)) |>
knitr::kable(caption = "Week-4 proportions: 200 simulated patients against the paper's 4000- and 5000-patient simulations.")| Endpoint | Simulated | Table S3 / S4 | Table 4 |
|---|---|---|---|
| VLVOTg < 30 mmHg (%) | 49.5 | 49.700 | 50.8 |
| LVEF < 50% (%) | 0.5 | 0.325 | 0.2 |
stopifnot(
  # 200 patients give a binomial SE of about 3.5 points on a 50% proportion,
  # and the baseline-gradient distribution is an approximation (see below);
  # a mis-transcribed kMAVA, VLVOTg0 or residual SD moves this by tens of
  # points.
  abs(week4$Simulated[1] - 49.7) < 15,
  # LVEF below 50% is a ~0.3% event: assert only that it stays rare.
  week4$Simulated[2] < 5
)
The simulated change from baseline against Cavg168 has the shape of Figure 1: VLVOTg falls steeply over the 5 mg exposure range while LVEF changes by a few points.
fig1 <- bind_rows(
  sim_v4 |> transmute(CAV, cfb = LVOT_GRADIENT_VALSALVA_BL - sim,
    endpoint = "(a) Baseline VLVOTg - VLVOTg (mmHg)"),
  sim_l4 |> transmute(CAV, cfb = LVEF_BL - sim,
    endpoint = "(b) Baseline LVEF - LVEF (%)")
)
ggplot(fig1, aes(CAV, cfb)) +
  geom_point(alpha = 0.4) +
  geom_smooth(method = "loess", formula = y ~ x, se = FALSE) +
  facet_wrap(~endpoint, scales = "free_y") +
  labs(x = "Cavg168 (ng/mL)", y = "Change from baseline",
       caption = "Simulated analogue of Merali 2024 Figure 1 (week 4, 5 mg once daily).")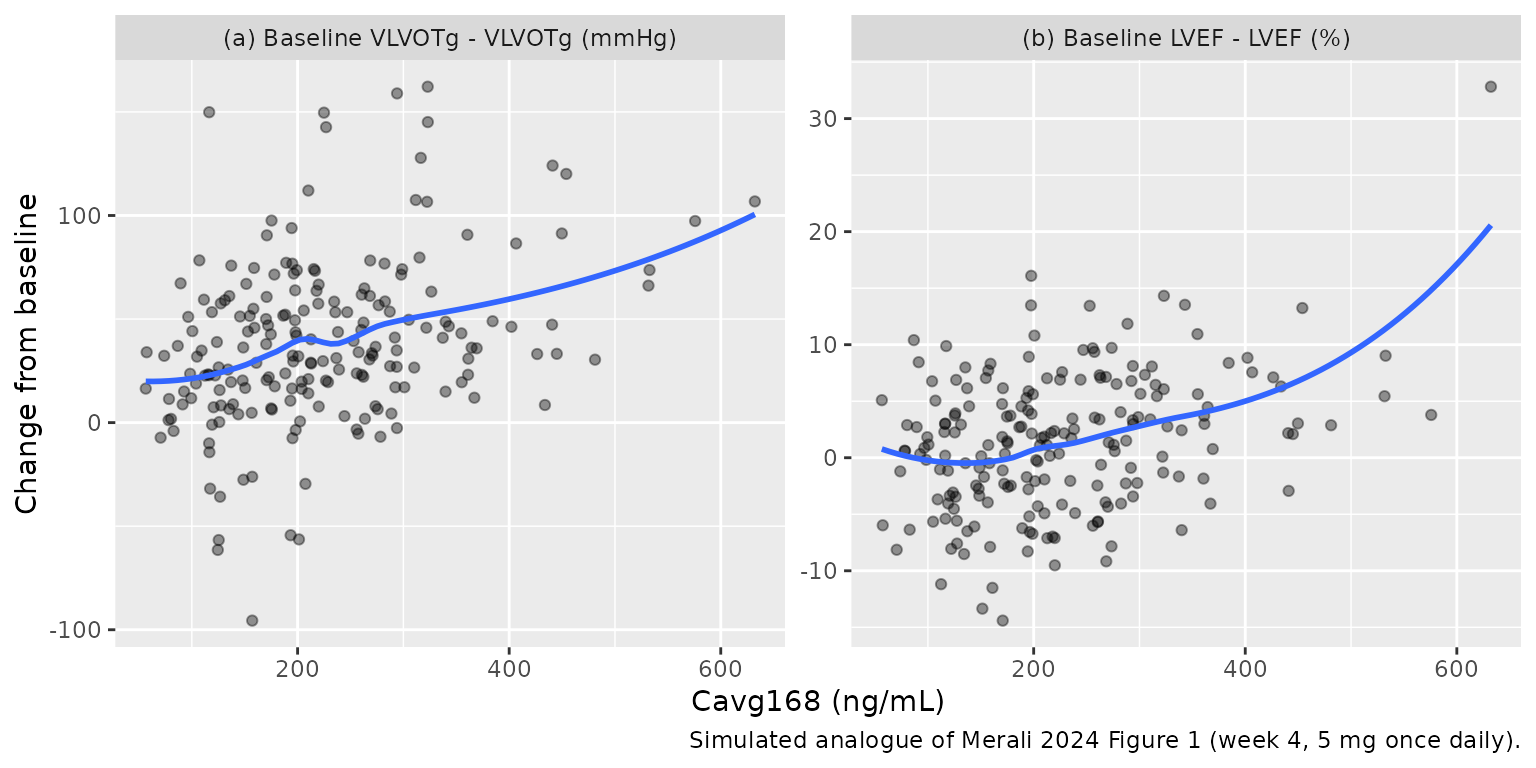
Assumptions and deviations
- Scale of the LVEF ‘%’ rows. The Results state that the LVEF model has log-normal random effects on LVEF0 and kMAVA and a log-normal residual error. Table 2 prints the LVEF0 covariate effects (33.6, -3.24, 1.40), the LVEF0 random-effect SD (2.38) and the residual SD (4.80) with a ‘%’ label and no ‘Log(…)’ prefix. The maintainers read these as log-scale quantities multiplied by 100, so they are divided by 100 here: the baseline LVEF effect is a power exponent of 0.336, the nonobstructive-HCM and female effects shift log LVEF0 by -0.0324 and +0.0140, and the IIV and residual SDs are 0.0238 and 0.048 on the log scale. The 2025 refit of the same model with added Chinese patients (doi:10.1002/psp4.13312) reports its baseline LVEF exponent unscaled as 0.315, the same magnitude as 0.336. Read instead as additive percentage points, the residual SD would be 4.80 points rather than about 3.6 points at an LVEF of 74%.
- IIV conversion. The %CV rows are converted with omega^2 = log(1 + CV^2); the paper does not define its %CV. Covariances are r * omega_i * omega_j.
-
Baseline covariates are observed values. In the
Table 2 covariate rows ‘VLVOTg0’ and ‘LVEF0’ denote the patient’s
observed baseline (Methods: “baseline VLVOTg on both VLVOTg0 and
kMAVA”), supplied as
LVOT_GRADIENT_VALSALVA_BLandLVEF_BL; the model parameters VLVOTg0 and LVEF0 carry their own random effects. - Baseline LVEF covariate on kMAVA. The Results text says baseline LVEF acts on “the steepness parameter”; Table 2 places it on log kMAVA, which the model follows.
-
NT-proBNP unit. The Table 2 footnote gives the
reference as “736 ng/mL”, but Table S2 reports NT-proBNP in ng/L (mean
1280), so the reference is 736 ng/L = 0.736 ng/mL and
NTPROBNPis supplied in ng/mL. -
Study effect. “All studies except EXPLORER-HCM” is
coded as
1 - STUDY_EXPLORERHCM; extension records of patients who came from EXPLORER-HCM (the EXPLORER-LTE cohort of MAVA-LTE) carrySTUDY_EXPLORERHCM = 0. Simulations of the approved regimen, as in the paper, use the EXPLORER-HCM value. -
Placebo time.
tis time in weeks from the patient’s (possibly reset) baseline; the placebo time course multiplies the gradient for mavacamten and placebo patients alike. - Virtual cohort. Body weight and eGFR follow the Chang 2024 PK population (the E-R analysis sets do not report them); baseline VLVOTg and LVEF follow the Table S2 means and SDs (log-normal and truncated normal, LVEF at least 55% per the EXPLORER-HCM entry criterion). Table S2 prints the NT-proBNP SD as 34 against a mean of 1280 ng/L, which is not usable, so NT-proBNP is drawn log-normally around the 736 ng/L reference with a log-scale SD of 1; its exponent (0.108) makes the week-4 result insensitive to that choice. The paper resampled the observed EXPLORER-HCM patients instead.
- Titration simulations not reproduced. Tables 3, 4 and S3-S6 and Figures 2-3 come from 4000- and 5000-patient simulations of the concentration- and echocardiography-guided titration rules of Table 1 over 40 and 104 weeks. Only the week-4 snapshot, before any titration step, is rebuilt here.
- No erratum for Merali 2024 was found on Europe PMC (checked 2026-10-31).