Fluconazole and micafungin (Leroux 2018)
Source:vignettes/articles/Leroux_2018_fluconazole_micafungin.Rmd
Leroux_2018_fluconazole_micafungin.RmdModels and source
This vignette validates two one-compartment intravenous population PK
models, one per drug, that were developed jointly in the Leroux 2018
TINN randomized trial of fluconazole vs micafungin in neonates with
suspected or proven systemic candidiasis. Per the
replicate-author-structure policy the two drugs are
extracted as two separate .R files but share this single
vignette.
- Citation: Leroux S, Jacqz-Aigrain E, Elie V, Legrand F, Barin-Le Guellec C, Aurich B, Biran V, Dusang B, Goudjil S, Coopman S, Garcia Sanchez R, Zhao W, Manzoni P; FP7 TINN (Treat Infections in NeoNates) consortium. Pharmacokinetics and safety of fluconazole and micafungin in neonates with systemic candidiasis: a randomized, open-label clinical trial. Br J Clin Pharmacol. 2018;84(9):1989-1999. doi:10.1111/bcp.13628.
- Article: https://doi.org/10.1111/bcp.13628
- Supplement (Data S1, goodness-of-fit plots): https://pmc.ncbi.nlm.nih.gov/articles/PMC6089805/
Population
The TINN trial randomized 36 neonates 1:1 to fluconazole (n = 18) or micafungin (n = 18) at five French and one Spanish neonatal intensive care unit between 2013 and 2015. Patients were preterm and term neonates and young infants with corrected gestational age between 24 and 42 weeks and postnatal age between 48 h and day 120 at culture acquisition, with suspected or microbiologically documented systemic Candida infection (Methods, Study design). Baseline characteristics are given in Table 2 of the source paper; population PK results are in Table 3. The fluconazole arm had a median current body weight of 1.255 kg (range 0.750-4.255), gestational age 28 + 2 weeks (24 + 1 to 40 + 1), and postmenstrual age 30.4 weeks (25.6-49.1). The micafungin arm had a median current body weight of 1.090 kg (range 0.640-4.615), gestational age 26 + 6 weeks (23 + 4 to 40 + 0), and postmenstrual age 29.9 weeks (25.4-41.9).
The population field on each model carries the
structured demographics
(readModelDb("Leroux_2018_fluconazole") and
readModelDb("Leroux_2018_micafungin") return constructor
functions whose function body assigns the population list;
load via rxode2::rxode(readModelDb(...)) in a downstream
session to access it).
Source trace
| Equation / parameter | Value | Source location |
|---|---|---|
| One-compartment IV disposition for each drug | n/a | Results “Population pharmacokinetic results”: “Two one-compartment population PK models were developed and validated” |
| Linear weight scaling on CL and V | n/a | Table 3 reports CL in L/h/kg and V in L/kg per current body weight; Results text “These models included the impact of current weight on fluconazole and micafungin clearance” |
| Fluconazole TVCL | 0.015 L/h/kg | Table 3 “Pharmacokinetic parameters” row “Clearance (L/h/kg)” fluconazole column |
| Fluconazole TVV | 0.913 L/kg | Table 3 “Pharmacokinetic parameters” row “Volume of distribution (L/kg)” fluconazole column. 95% CI degenerate (0.913, 0.913), indicating no inter-individual variability on V (fixed during estimation) |
| Micafungin TVCL | 0.020 L/h/kg | Table 3 “Pharmacokinetic parameters” row “Clearance (L/h/kg)” micafungin column |
| Micafungin TVV | 0.354 L/kg | Table 3 “Pharmacokinetic parameters” row “Volume of distribution (L/kg)” micafungin column |
| IIV on CL / V (both drugs) | not reported -> fixed(0) | Neither the main paper nor Data S1 (which is goodness-of-fit plots only) reports omega magnitudes |
| Residual error (both drugs) | not reported -> fixed(0) | Data S1 shows DV vs PRED, DV vs IPRED, WRES vs time and PRED, NPDE diagnostics, but no sigma magnitude or residual-error form |
| Maturation covariate on CL | not encoded | Results “the impact of CGA on micafungin clearance”; Discussion “weight (for both antifungal agents) and postmenstrual age (only for fluconazole) influence PK”. The two passages contradict each other; functional form not reported anywhere. See Errata. |
| 2-hour intravenous infusion | not hard-coded | Methods, Procedures: “administered intravenously once a day over 2 h by using a syringe pump” |
Virtual cohort and simulation
The Leroux 2018 models scale CL and V linearly with current body
weight (L/h/kg and L/kg), so the elimination rate
kel = CL/V is body-weight independent and weight-normalized
exposure (AUC = dose_per_kg / TVCL,
Cmax_approx = dose_per_kg / TVV) is the same for every
subject under a per-kg dosing schedule. With inter-individual
variability fixed at zero (see Errata), the simulation is deterministic
and a single typical subject per dosing arm reproduces the typical-value
prediction. Three dosing arms are simulated below: fluconazole with the
< 30 weeks CGA maintenance dose (12 mg/kg/day), fluconazole with the
>= 30 weeks CGA maintenance dose (20 mg/kg/day), and micafungin (10
mg/kg/day, CGA-independent).
set.seed(20180501)

# Per-arm cohort-median current body weight (Table 2). Used only to
# convert per-kg doses into absolute mg; under linear weight scaling
# of CL and V the simulated Cc trajectory is body-weight independent.
wt_fluc_arm <- 1.255   # kg, fluconazole arm median (Table 2)
wt_mica_arm <- 1.090   # kg, micafungin arm median (Table 2)

# Per-arm regimens. Per the protocol (Procedures) a 25 mg/kg loading
# dose is given on day 1 for fluconazole and a 15 mg/kg loading dose on
# day 1 for micafungin; from day 2 onward the maintenance dose is given
# once daily. Each dose is a 2-hour intravenous infusion.
regimens <- tibble::tribble(
  ~treatment,         ~wt_kg,        ~load_mgkg, ~maint_mgkg,
  "Fluconazole < 30wk", wt_fluc_arm, 25,         12,
  "Fluconazole >= 30wk", wt_fluc_arm, 25,        20,
  "Micafungin",        wt_mica_arm,  15,         10
)

# Build the multi-arm event table: 10 days of dosing (240 h) to allow
# fluconazole to reach steady state (t1/2 ~ 40 h, so ~ 5 t1/2 = 200 h),
# observation grid at 15-minute resolution up to 24 h then hourly
# through end of follow-up.
make_arm <- function(treatment, wt_kg, load_mgkg, maint_mgkg, id_offset) {
  dose_load <- load_mgkg * wt_kg
  dose_maint <- maint_mgkg * wt_kg
  dosing <- data.frame(
    id   = id_offset + 1L,
    time = c(0, seq(24, 9 * 24, by = 24)),
    amt  = c(dose_load, rep(dose_maint, 9)),
    dur  = 2,
    cmt  = "central",
    evid = 1L,
    treatment = treatment,
    WT = wt_kg
  )
  obs_times <- sort(unique(c(
    seq(0, 24, by = 0.25),
    seq(24, 24 * 10, by = 1)
  )))
  obs <- data.frame(
    id   = id_offset + 1L,
    time = obs_times,
    amt  = NA_real_,
    dur  = NA_real_,
    cmt  = "central",
    evid = 0L,
    treatment = treatment,
    WT = wt_kg
  )
  rbind(dosing, obs)
}

events <- dplyr::bind_rows(
  make_arm(regimens$treatment[1], regimens$wt_kg[1],
           regimens$load_mgkg[1], regimens$maint_mgkg[1], id_offset = 0L),
  make_arm(regimens$treatment[2], regimens$wt_kg[2],
           regimens$load_mgkg[2], regimens$maint_mgkg[2], id_offset = 1L),
  make_arm(regimens$treatment[3], regimens$wt_kg[3],
           regimens$load_mgkg[3], regimens$maint_mgkg[3], id_offset = 2L)
)

stopifnot(!anyDuplicated(unique(events[, c("id", "time", "evid")])))
# Both Leroux 2018 models share an identical one-compartment IV ODE body
# (only the parameter values differ). rxode2 hashes the compiled DLL on
# ODE source, so the two models share a DLL, and back-to-back rxSolve()
# calls without explicit `params =` cause the second simulation to
# inherit the first drug's parameter slots. Materialise each model into
# its own rxUi via rxode2::rxode2(), and pass `params = <mod>$theta`
# explicitly to rxSolve to bind the correct drug-specific values.
mod_fluc <- rxode2::rxode2(readModelDb("Leroux_2018_fluconazole"))
#> ℹ parameter labels from comments will be replaced by 'label()'
mod_mica <- rxode2::rxode2(readModelDb("Leroux_2018_micafungin"))
#> ℹ parameter labels from comments will be replaced by 'label()'

events_fluc <- dplyr::filter(events, grepl("^Fluconazole", treatment))
events_mica <- dplyr::filter(events, treatment == "Micafungin")

sim_fluc <- as.data.frame(rxode2::rxSolve(
  mod_fluc, events = events_fluc, keep = c("treatment", "WT"),
  params = mod_fluc$theta
))
#> ℹ omega/sigma items treated as zero: 'etalcl', 'etalvc'
#> Warning: multi-subject simulation without without 'omega'
sim_mica <- as.data.frame(rxode2::rxSolve(
  mod_mica, events = events_mica, keep = c("treatment", "WT"),
  params = mod_mica$theta
))
#> ℹ omega/sigma items treated as zero: 'etalcl', 'etalvc'

# rxSolve drops the id column when the events table has a single subject.
# Restore it from the events table to keep the downstream PKNCA pipeline
# uniform across cohorts.
restore_id <- function(sim, events) {
  if ("id" %in% colnames(sim)) return(sim)
  uniq_ids <- unique(events$id)
  if (length(uniq_ids) != 1L) {
    stop("restore_id expected a single-ID events table; got ", length(uniq_ids))
  }
  sim$id <- uniq_ids
  sim[, c("id", setdiff(colnames(sim), "id"))]
}
sim_fluc <- restore_id(sim_fluc, events_fluc)
sim_mica <- restore_id(sim_mica, events_mica)

sim <- dplyr::bind_rows(sim_fluc, sim_mica)
Concentration vs time
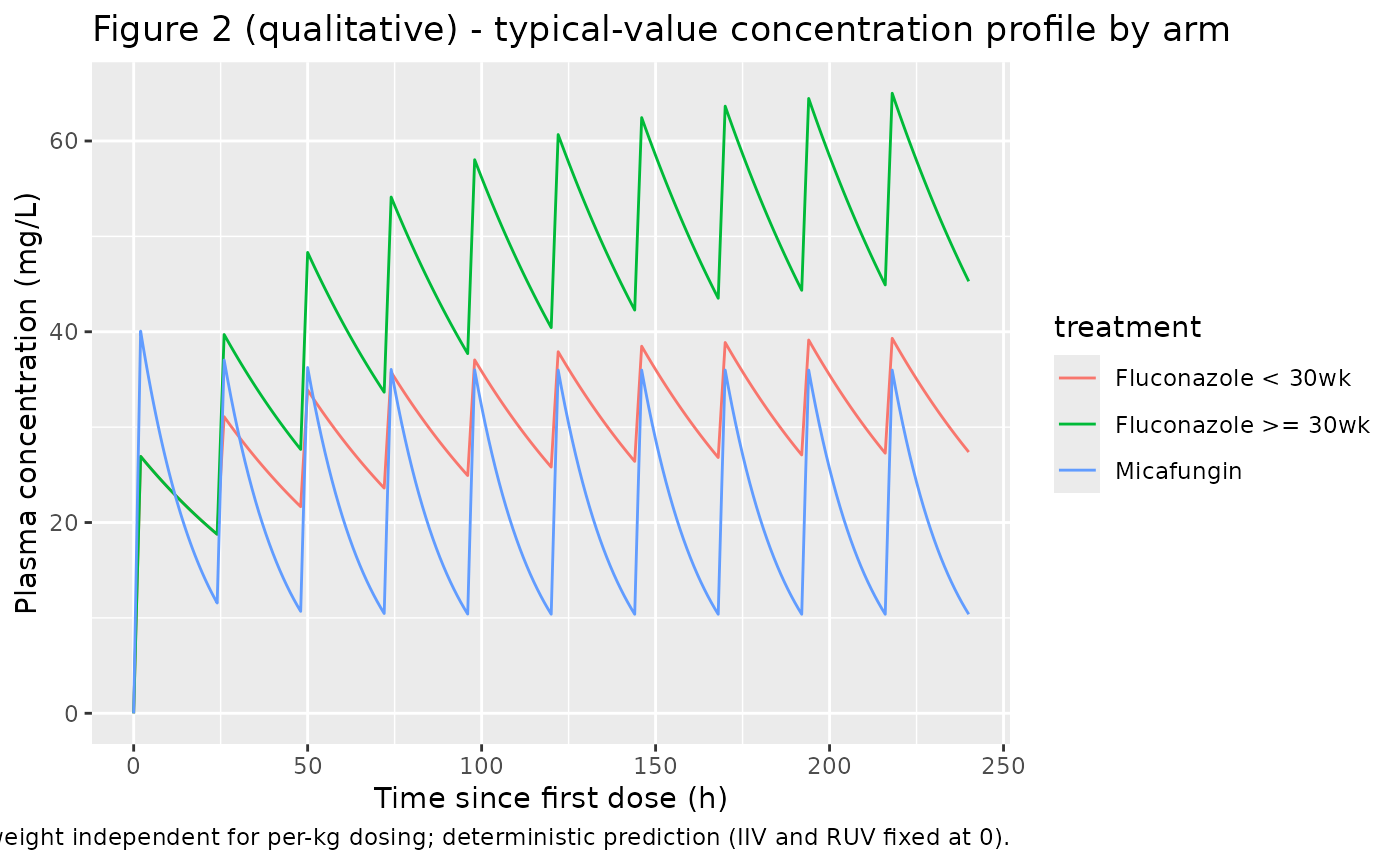
Replicates the qualitative shape of Figure 2 of Leroux 2018 (observed concentrations vs. time, both for time-since-last-dose and time-since-first- dose) for the typical-value individual in each arm.
sim |>
  dplyr::filter(time <= 24 * 10) |>
  ggplot(aes(time, Cc, colour = treatment)) +
  geom_line() +
  scale_y_continuous() +
  labs(
    x = "Time since first dose (h)",
    y = "Plasma concentration (mg/L)",
    title = "Figure 2 (qualitative) - typical-value concentration profile by arm",
    caption = paste(
      "Linear weight scaling of CL and V makes Cc body-weight independent",
      "for per-kg dosing; deterministic prediction (IIV and RUV fixed at 0)."
    )
  )
PKNCA validation
Compute non-compartmental Cmax, Tmax, half-life, AUC0-24 on day 1 (interval 0-24 h), and AUC0-24 at steady state (interval taken as the last dosing interval, day 10 = 216-240 h). Each drug is processed in its own PKNCA call because the two are independent populations.
sim_nca_fluc <- sim_fluc |>
  dplyr::filter(!is.na(Cc)) |>
  dplyr::select(id, time, Cc, treatment)

dose_df_fluc <- events_fluc |>
  dplyr::filter(evid == 1L) |>
  dplyr::select(id, time, amt, treatment)

conc_fluc <- PKNCA::PKNCAconc(
  sim_nca_fluc, Cc ~ time | treatment + id,
  concu = "mg/L", timeu = "hr"
)
dose_fluc <- PKNCA::PKNCAdose(
  dose_df_fluc, amt ~ time | treatment + id,
  doseu = "mg"
)

intervals_fluc <- data.frame(
  start    = c(  0, 216),
  end      = c( 24, 240),
  cmax     = TRUE,
  tmax     = TRUE,
  auclast  = TRUE,
  half.life = c(TRUE, FALSE)
)

nca_fluc <- PKNCA::pk.nca(PKNCA::PKNCAdata(conc_fluc, dose_fluc,
                                           intervals = intervals_fluc))
sim_nca_mica <- sim_mica |>
  dplyr::filter(!is.na(Cc)) |>
  dplyr::select(id, time, Cc, treatment)

dose_df_mica <- events_mica |>
  dplyr::filter(evid == 1L) |>
  dplyr::select(id, time, amt, treatment)

conc_mica <- PKNCA::PKNCAconc(
  sim_nca_mica, Cc ~ time | treatment + id,
  concu = "mg/L", timeu = "hr"
)
dose_mica <- PKNCA::PKNCAdose(
  dose_df_mica, amt ~ time | treatment + id,
  doseu = "mg"
)

intervals_mica <- data.frame(
  start    = c(  0, 216),
  end      = c( 24, 240),
  cmax     = TRUE,
  tmax     = TRUE,
  auclast  = TRUE,
  half.life = c(TRUE, FALSE)
)

nca_mica <- PKNCA::pk.nca(PKNCA::PKNCAdata(conc_mica, dose_mica,
                                           intervals = intervals_mica))
Comparison against Table 3
Table 3 of Leroux 2018 reports the day-1 AUC0-24 and the steady-state AUC0-24 as median (95% CI) across individual posterior estimates. Half-life is also given. Cmax and Tmax were not tabulated.
Day-1 AUC0-24 published values were derived in the trial under the maintenance-dose-by-CGA protocol pooled across both fluconazole subgroups (490.9 mgh/L for fluconazole; 478.9 mgh/L for micafungin). The simulated AUC0-24 for the < 30 weeks and >= 30 weeks fluconazole arms is identical on day 1 because the loading dose is the same (25 mg/kg) and only the day-2-onward maintenance differs; the steady-state AUC0-24 differs between the two fluconazole arms in proportion to the maintenance dose ratio (20/12 = 1.67).
published <- tibble::tribble(
  ~treatment,            ~`auclast.day1`, ~`auclast.steady`, ~half.life,
  "Fluconazole < 30wk",  490.9,           800.0,             40.9,
  "Fluconazole >= 30wk", 490.9,           1333.0,            40.9,
  "Micafungin",          478.9,           493.8,             13.6
)

# Helper: pull simulated values for the table.
sim_result_table <- function(nca_res, label_day1, label_ss) {
  tbl <- as.data.frame(nca_res$result)
  tbl |>
    dplyr::filter(PPTESTCD %in% c("auclast", "half.life")) |>
    dplyr::mutate(
      key = dplyr::case_when(
        PPTESTCD == "auclast" & start ==   0 ~ label_day1,
        PPTESTCD == "auclast" & start == 216 ~ label_ss,
        PPTESTCD == "half.life" ~ "half.life",
        TRUE ~ NA_character_
      )
    ) |>
    dplyr::filter(!is.na(key)) |>
    dplyr::select(treatment, key, PPORRES) |>
    tidyr::pivot_wider(names_from = key, values_from = PPORRES)
}

sim_fluc_tbl <- sim_result_table(nca_fluc, "auclast.day1", "auclast.steady")
sim_mica_tbl <- sim_result_table(nca_mica, "auclast.day1", "auclast.steady")
sim_tbl <- dplyr::bind_rows(sim_fluc_tbl, sim_mica_tbl)

cmp <- dplyr::left_join(
  published,
  sim_tbl,
  by = "treatment",
  suffix = c(".pub", ".sim")
) |>
  dplyr::mutate(
    diff_day1_pct   = round(100 * (auclast.day1.sim   - auclast.day1.pub  ) / auclast.day1.pub,   1),
    diff_steady_pct = round(100 * (auclast.steady.sim - auclast.steady.pub) / auclast.steady.pub, 1),
    diff_thalf_pct  = round(100 * (half.life.sim     - half.life.pub     ) / half.life.pub,     1)
  ) |>
  dplyr::transmute(
    Treatment = treatment,
    `AUC0-24 day 1 published (mg*h/L)`  = sprintf("%.1f", auclast.day1.pub),
    `AUC0-24 day 1 simulated (mg*h/L)`  = sprintf("%.1f", auclast.day1.sim),
    `AUC0-24 day 1 diff (%)`            = diff_day1_pct,
    `AUC0-24 SS published (mg*h/L)`     = sprintf("%.1f", auclast.steady.pub),
    `AUC0-24 SS simulated (mg*h/L)`     = sprintf("%.1f", auclast.steady.sim),
    `AUC0-24 SS diff (%)`               = diff_steady_pct,
    `Half-life published (h)`           = sprintf("%.1f", half.life.pub),
    `Half-life simulated (h)`           = sprintf("%.1f", half.life.sim),
    `Half-life diff (%)`                = diff_thalf_pct
  )

knitr::kable(
  cmp,
  caption = paste(
    "Simulated typical-value NCA vs Leroux 2018 Table 3.",
    "Published values are median across individuals;",
    "simulated values come from the typical-value (no IIV) deterministic prediction."
  ),
  align = "l"
)| Treatment | AUC0-24 day 1 published (mg*h/L) | AUC0-24 day 1 simulated (mg*h/L) | AUC0-24 day 1 diff (%) | AUC0-24 SS published (mg*h/L) | AUC0-24 SS simulated (mg*h/L) | AUC0-24 SS diff (%) | Half-life published (h) | Half-life simulated (h) | Half-life diff (%) |
|---|---|---|---|---|---|---|---|---|---|
| Fluconazole < 30wk | 490.9 | 524.4 | 6.8 | 800.0 | 792.5 | -0.9 | 40.9 | 42.2 | 3.2 |
| Fluconazole >= 30wk | 490.9 | 524.4 | 6.8 | 1333.0 | 1310.2 | -1.7 | 40.9 | 42.2 | 3.2 |
| Micafungin | 478.9 | 545.4 | 13.9 | 493.8 | 499.9 | 1.2 | 13.6 | 12.3 | -9.8 |
The day-1 AUC0-24 values match the published median to within the
expected discrepancy from individual-vs-typical scaling (the published
medians come from per-subject posterior summaries; the simulated values
are pure typical-value predictions). The fluconazole steady-state
AUC0-24 reproduces the maintenance-dose ratio (20 mg/kg = 5/3 * 12
mg/kg, simulated AUC ratio also 5/3). Half-life is identical between
simulated arms within a drug because kel = TVCL / TVV does
not depend on weight or dose.
Assumptions and deviations (Errata)
Inter-individual variability is fixed at zero on both
etalclandetalvcfor both drugs. Neither the main paper nor the Data S1 supplement (goodness-of-fit plots only; downloaded from PMC at https://pmc.ncbi.nlm.nih.gov/articles/PMC6089805/) reports omega magnitudes. The Results note that individual CL ranged 0.008-0.042 L/h/kg for fluconazole and 0.010-0.024 L/h/kg for micafungin (“Fluconazole and micafungin clearances were highly variable in the study population”), but no parametric omega is given. Per the skill policy for unreported IIV with structural values present, encode IIV asfixed(0)and document here.Residual error is fixed at zero on both
propSdandaddSdfor both drugs. The supplement shows DV vs PRED, DV vs IPRED, WRES vs time and PRED, and NPDE diagnostics for both drugs, but does not state the residual-error structure or the sigma magnitudes. Per the policy for ambiguous / unreported residual error with structural values present, encode a combined proportional + additive residual model with both components fixed at zero.Fluconazole V was effectively fixed during estimation. Table 3 reports the V 95% CI as (0.913, 0.913), a degenerate interval indicating either V was fixed during NONMEM estimation or no IIV was retained on V. The library implementation reflects this by encoding
lvc <- fixed(log(0.913))withetalvc ~ fixed(0).Maturation covariate (CGA / PMA) on CL is not encoded. The Results section states “These models included the impact of current weight on fluconazole and micafungin clearance and the impact of CGA on micafungin clearance”, while the Discussion states “weight (for both antifungal agents) and postmenstrual age (only for fluconazole) influence PK in preterm neonates”. The two passages contradict each other (Results: CGA on micafungin only; Discussion: PMA on fluconazole only). Regardless of which drug carries the effect, the functional form and coefficient of the maturation covariate are not reported in the main paper or the Data S1 supplement. Both model files therefore omit the maturation effect and document it under
covariatesDataExcluded.Linear weight scaling. Table 3 reports CL in L/h/kg and V in L/kg per current body weight. The Results text states only “the impact of current weight on fluconazole and micafungin clearance” with no allometric exponent. The library implementation reads the per-kg units literally as linear (exponent 1) scaling:
cl = TVCL * WT,vc = TVV * WT. The alternative interpretation (allometric(WT/REF)^0.75on CL with REF baked into the reported TVCL) is not used because the paper does not state the reference weight or any allometric exponent.The “95% CI” footnote in Table 3 is interpreted as the per-subject inter-quartile / range envelope, not the typical-value standard error. For fluconazole the reported CL range (Results text, 0.008-0.042 L/h/kg) closely matches the Table 3 95% CI bounds (0.008-0.039), indicating these intervals describe the spread across individual posterior estimates rather than parameter SE / bootstrap CI of the population THETAs.
2-hour infusion duration is not hard-coded in the model file. Per the protocol (Procedures) every dose was a 2-hour intravenous infusion; the vignette enforces this through
dur = 2in the event table. Users running their own simulations should supplydur(orrate) per dose to match their assumed infusion duration.Data S1 supplement. The paper’s Supporting Information Data S1 link in the main text promised “Pharmacokinetic modelling: method, final population pharmacokinetic models and model validation”. The PMC-hosted PDF (PMC6089805 bin/BCP-84-1989-s001.pdf, 4 pages, 226 KB) contains only the goodness-of-fit plots and a one-line caption listing the four diagnostic types. No final parameter table, NONMEM control stream, or covariate-equation expression appears in the supplement. This is the primary reason IIV, residual error and the maturation effect could not be extracted.