2-Iminobiotin (Admiraal 2023)
Source:vignettes/articles/Admiraal_2023_iminobiotin.Rmd
Admiraal_2023_iminobiotin.RmdModel and source
mod_meta <- nlmixr2est::nlmixr(readModelDb("Admiraal_2023_iminobiotin"))$meta
#> ℹ parameter labels from comments will be replaced by 'label()'- Citation: Admiraal MM, Velseboer DC, Tjabbes H, Vis P, Peeters-Scholte C, Horn J. Neuroprotection after cardiac arrest with 2-iminobiotin: a single center phase IIa study on safety, tolerability, and pharmacokinetics. Front Neurol. 2023;14:1136046. doi:10.3389/fneur.2023.1136046
- Description: Two-compartment IV population PK model for 2-iminobiotin (2-IB, a selective neuronal nitric oxide synthase inhibitor) in adults after out-of-hospital cardiac arrest, with a power-model eGFR-on-clearance covariate effect.
- Article (DOI): https://doi.org/10.3389/fneur.2023.1136046
This vignette validates the packaged
Admiraal_2023_iminobiotin model – a two-compartment IV
population PK model for 2-iminobiotin (2-IB) in 21 adult survivors of
out-of-hospital cardiac arrest (OHCA) treated with targeted temperature
management (TTM) at 36 C – against the source publication’s
Supplementary Table S2 (individual NCA per cohort) and Supplementary
Table S3 (final-model population PK parameter estimates).
Population
The Admiraal 2023 phase IIa study was an investigator-initiated, single-centre, open-label, dose-escalation trial at Amsterdam UMC (Netherlands) in adult survivors of out-of-hospital cardiac arrest (NCT02836340 / EUDRACT 2015-003902-17). Three sequential cohorts received six 15-minute IV infusions of 2-IB, one every 4 h, beginning at a median of 5.3 h (IQR 4.8-5.6) after OHCA. Cohort A (n = 8, May-October 2016) used body-weight dosing (0.055 mg/kg/dose) targeting AUC0-24h 600-1,200 ngh/mL; cohort B (n = 8, May-December 2017) used MDRD-eGFR-based binned dosing on hospital admission targeting AUC0-24h 2,100-3,300 ngh/mL; cohort C (n = 5, January 2019 - February 2020, terminated early at the start of the COVID-19 pandemic) used a three-times-higher eGFR-binned schedule targeting AUC0-24h 7,200-8,400 ng*h/mL. Median age was 60.5 yr (IQR 59.5-67) in cohort A, 64 yr (IQR 63-66) in cohort B, and 74 yr (IQR 69-76) in cohort C; median body weight was 87.5, 76.5, and 83 kg respectively; 76% (16/21) were male. All patients were sedated with propofol (+/- remifentanil) and treated with TTM at 36 C for the first 24 h. Patient 12 was screen-failed post hoc (violated cohort B inclusion criteria) and is excluded from the PK analysis, so the modelled N is 21 rather than the planned 24.
The same information is available programmatically via the model’s
population metadata:
str(mod_meta$population)
#> List of 14
#>  $ species       : chr "human"
#>  $ n_subjects    : int 21
#>  $ n_studies     : int 1
#>  $ age_range     : chr "median 60.5 yr (cohort A IQR 59.5-67); 64 yr (cohort B IQR 63-66); 74 yr (cohort C IQR 69-76)"
#>  $ age_median    : chr "65 years (pooled, approximated from cohort medians)"
#>  $ weight_range  : chr "median 87.5 kg (cohort A IQR 82-112); 76.5 kg (cohort B IQR 67.5-96.5); 83 kg (cohort C IQR 77-84)"
#>  $ weight_median : chr "83 kg (pooled, approximated from cohort medians)"
#>  $ sex_female_pct: num 24
#>  $ race_ethnicity: chr "Not reported in detail"
#>  $ disease_state : chr "Adult survivors of out-of-hospital cardiac arrest (OHCA) admitted to the intensive care unit after return of sp"| __truncated__
#>  $ dose_range    : chr "Three dose-escalation cohorts: cohort A 0.055 mg/kg/dose (body-weight dosing); cohorts B and C eGFR-based bins "| __truncated__
#>  $ regions       : chr "Single centre, Amsterdam UMC, Netherlands"
#>  $ renal_function: chr "MDRD eGFR on hospital admission spanned the dosing-table range of 0-220 mL/min/1.73 m^2 (Supplementary Table S1"| __truncated__
#>  $ notes         : chr "Demographics from Admiraal 2023 Table 1. N = 21 (cohort A 8, cohort B 8, cohort C 5). One patient (patient 12) "| __truncated__
Source trace
The per-parameter origin is recorded as an in-file comment next to
each ini() entry in
inst/modeldb/specificDrugs/Admiraal_2023_iminobiotin.R. The
table below collects them in one place; values come from Admiraal 2023
Supplementary Table S3 (final population PK model fit to pooled cohorts
A + B + C, n = 21).
| Parameter / equation | Value | Source location |
|---|---|---|
lcl (typical CL at REF eGFR) |
log(12.10) | Supplementary Table S3 row “Clearance (L/h)” = 12.10 |
lvc (central volume) |
log(10.1) | Supplementary Table S3 row “Vcentral (L)” = 10.1 |
lq (intercompartmental CL) |
log(14.6) | Supplementary Table S3 row “Q (L/h)” = 14.6 |
lvp (peripheral volume) |
log(10.8) | Supplementary Table S3 row “Vperipheral (L)” = 10.8 |
e_crcl_cl (eGFR power exponent) |
1.03 | Supplementary Table S3 row “eGFR0 on Clearance” = 1.03 |
etalcl ~ 0.225 |
0.225 | Supplementary Table S3 row “Inter-individual variability” = 0.225 |
etalvc ~ 0.27 |
0.27 | Supplementary Table S3 row “IIV Vcentral” = 0.27 |
propSd <- sqrt(0.06) |
0.245 | Supplementary Table S3 row “Residual Error” variance = 0.06 |
| Reference eGFR | 90 mL/min/1.73 m^2 | NOT in source; operator-approved (task 171 sidecar 001 “A”). See Assumptions. |
cl <- exp(lcl + etalcl) * (CRCL / 90)^e_crcl_cl |
n/a | Main text “Pharmacokinetics population model” + Table S3 covariate row |
d/dt(central) ... d/dt(peripheral1) |
n/a | Main text Results “Cohort A”: “A two-compartment structural PK model was superior to a one-compartment model” |
Cc <- (central / vc) * 1000 |
n/a | Unit-consistency rule: dose mg, Vc L -> mg/L; multiply by 1000 to express as ng/mL (paper’s concentration unit) |
Cc ~ prop(propSd) |
n/a | Methods “Pharmacokinetics population model” implies log-additive (proportional) error consistent with NONMEM FOCE-I; Table S3 single residual-variance term |
Virtual cohort
Original observed 2-IB concentrations are not publicly available. The virtual cohort below approximates the published trial demographics: 3 cohorts matching the cohort A / B / C dosing schedules. Each cohort uses 60 simulated subjects (well under the per-arm cap of 200), generated with body-weight and admission-eGFR distributions centred on the reported cohort medians from Admiraal 2023 Table 1 and spanning a width consistent with OHCA-ICU populations. Cohort A dosing scales linearly with body weight (0.055 mg/kg/dose); cohorts B and C use the eGFR-bin lookup from Admiraal 2023 Supplementary Table S1.
set.seed(20260628L)

n_per_cohort <- 60L

# Body-weight distributions per cohort -- log-normal centred on Table 1
# cohort medians, SD chosen so the simulated IQR roughly matches Table 1.
draw_wt <- function(n, median_wt, range_factor = 1.55) {
  wt <- exp(rnorm(n, mean = log(median_wt),
                  sd = log(range_factor) / 1.349))
  pmin(pmax(wt, 45), 130)
}

# Admission MDRD-eGFR distributions -- the paper does NOT report the
# observed eGFR per cohort, so we use a log-normal centred on 90
# mL/min/1.73 m^2 (the reference eGFR used in the model). The eGFR
# distribution is wide enough to span the Table S1 dosing-bin range
# without exceeding it.
draw_crcl <- function(n, median_crcl = 90, range_factor = 2.0) {
  crcl <- exp(rnorm(n, mean = log(median_crcl),
                    sd = log(range_factor) / 1.349))
  pmin(pmax(crcl, 15), 220)
}

# Admiraal 2023 Supplementary Table S1: cohort B eGFR-binned dose schedule.
# Cohort C dose = 3 x cohort B dose.
cohortB_dose_lookup <- function(crcl) {
  breaks <- c(0, 29, 39, 49, 59, 79, 99, 124, 149, 174, 199, 220)
  doses  <- c(3.0, 3.8, 4.5, 6.0, 6.8, 7.5, 8.3, 9.8, 11.3, 12.0, 12.8)
  idx <- findInterval(crcl, breaks, all.inside = TRUE)
  doses[idx]
}

infusion_dur <- 0.25       # 15 min in hours
dose_times   <- c(0, 4, 8, 12, 16, 20)

# Observation grid -- dense enough to capture the per-dose peaks (each
# infusion ends at dose_time + 0.25) and the post-last-dose decay.
sample_times <- sort(unique(c(
  seq(0, 24, by = 0.25),
  dose_times + 0.25,                            # end-of-infusion peaks
  dose_times + c(0.05, 1.0, 2.0, 3.0)           # decay between doses
)))
#> Warning in dose_times + c(0.05, 1, 2, 3): longer object length is not a
#> multiple of shorter object length

make_subject <- function(idx, cohort, wt_kg, crcl_ml_min) {
  per_dose_mg <- switch(
    cohort,
    A = 0.055 * wt_kg,
    B = cohortB_dose_lookup(crcl_ml_min),
    C = 3 * cohortB_dose_lookup(crcl_ml_min)
  )
  rate_mg_h <- per_dose_mg / infusion_dur       # 15-min infusion

  doses <- tibble::tibble(
    id   = idx,                 time = dose_times,
    evid = 1L,                  amt  = per_dose_mg,
    rate = rate_mg_h,           dv   = NA_real_,
    cmt  = "central"
  )
  obs <- tibble::tibble(
    id   = idx,                 time = sample_times,
    evid = 0L,                  amt  = NA_real_,
    rate = NA_real_,            dv   = NA_real_,
    cmt  = "central"
  )
  bind_rows(doses, obs) |>
    mutate(WT = wt_kg, CRCL = crcl_ml_min, cohort = cohort) |>
    arrange(time, desc(evid))
}

build_cohort <- function(label, median_wt, n, id_offset) {
  wt   <- draw_wt(n, median_wt = median_wt)
  crcl <- draw_crcl(n)
  bind_rows(lapply(seq_len(n), function(j) {
    make_subject(
      idx        = id_offset + j,
      cohort     = label,
      wt_kg      = wt[j],
      crcl_ml_min = crcl[j]
    )
  }))
}

events <- bind_rows(
  build_cohort("A", median_wt = 87.5, n = n_per_cohort, id_offset =   0L),
  build_cohort("B", median_wt = 76.5, n = n_per_cohort, id_offset = 100L),
  build_cohort("C", median_wt = 83.0, n = n_per_cohort, id_offset = 200L)
)

stopifnot(!anyDuplicated(unique(events[, c("id", "time", "evid")])))
Simulation
mod <- readModelDb("Admiraal_2023_iminobiotin")

sim_stoch <- rxode2::rxSolve(
  object = mod, events = events,
  keep   = c("WT", "CRCL", "cohort")
) |>
  as.data.frame()
#> ℹ parameter labels from comments will be replaced by 'label()'
For deterministic typical-value trajectories (no between-subject variability), the random effects are zeroed:
mod_typical <- rxode2::zeroRe(mod)
#> ℹ parameter labels from comments will be replaced by 'label()'
sim_typical <- rxode2::rxSolve(
  object = mod_typical, events = events,
  keep   = c("WT", "CRCL", "cohort")
) |>
  as.data.frame()
#> ℹ omega/sigma items treated as zero: 'etalcl', 'etalvc'
#> Warning: multi-subject simulation without without 'omega'
Replicate published figures
Supplementary Figure S1 – individual concentration-time profiles per cohort
# Replicates Admiraal 2023 Supplementary Figure S1 (panels A, B, C):
# individual 2-IB concentration-time profiles after six 15-minute IV
# infusions every 4 h, by cohort. The published figure shows linear-y
# concentrations from 0 to ~3,000 ng/mL over 0-26 h.
sim_stoch |>
  filter(time > 0) |>
  ggplot(aes(time, Cc, group = id)) +
  geom_line(alpha = 0.25, colour = "black") +
  facet_wrap(~ cohort, nrow = 1, scales = "free_y") +
  scale_x_continuous(limits = c(0, 26), breaks = c(0, 4, 8, 12, 16, 20, 24)) +
  labs(
    x = "Time after first dose (h)",
    y = "2-IB plasma concentration (ng/mL)",
    title    = "Supplementary Figure S1 -- individual PK fits per cohort",
    subtitle = paste0("Six 15-min IV infusions every 4 h; cohort A dosed by ",
                      "body weight, B/C dosed by admission MDRD eGFR")
  ) +
  theme_minimal()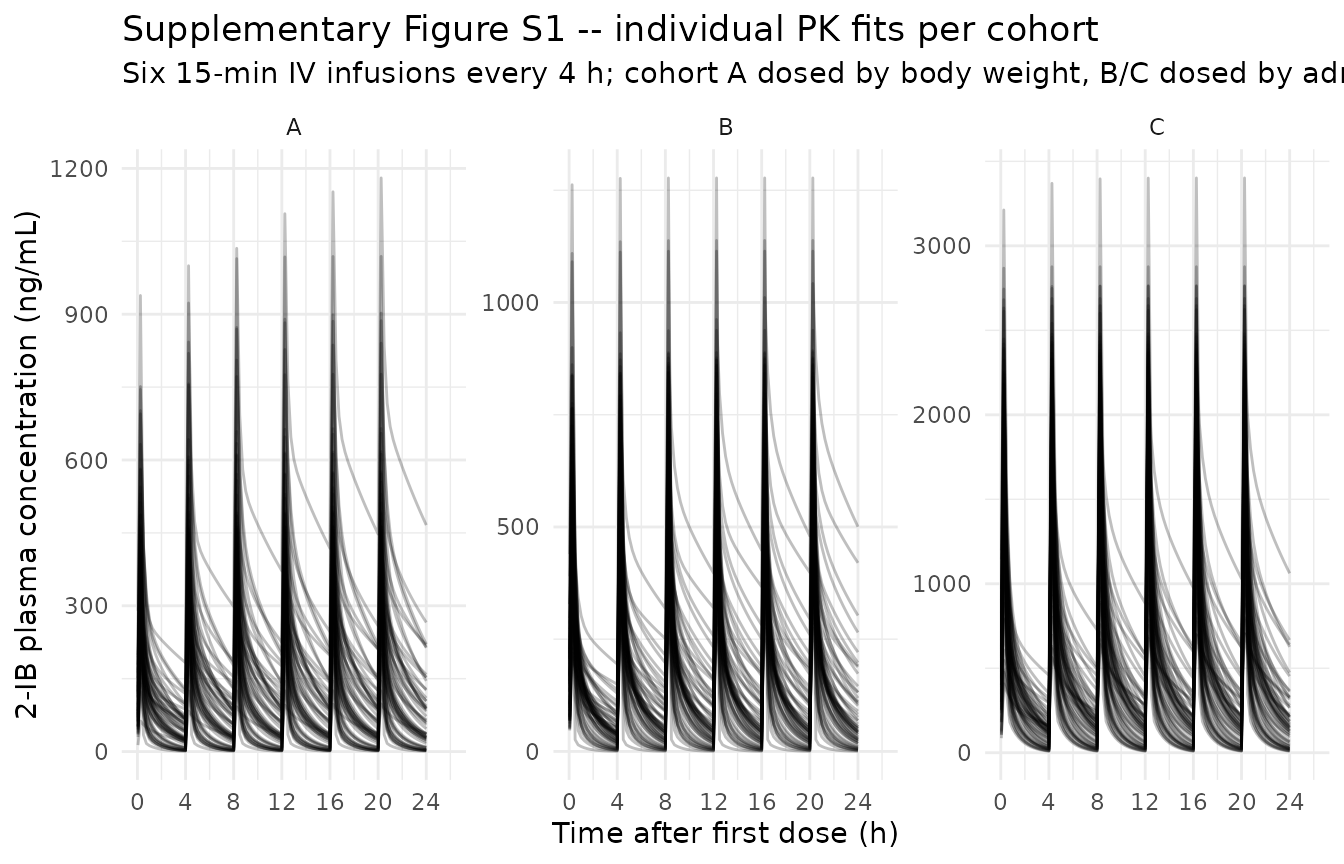
VPC by cohort
# VPC: median (line) and 5-95% prediction interval (ribbon) by cohort.
sim_stoch |>
  filter(time > 0) |>
  group_by(cohort, time) |>
  summarise(
    Q05 = quantile(Cc, 0.05, na.rm = TRUE),
    Q50 = quantile(Cc, 0.50, na.rm = TRUE),
    Q95 = quantile(Cc, 0.95, na.rm = TRUE),
    .groups = "drop"
  ) |>
  ggplot(aes(time, Q50)) +
  geom_ribbon(aes(ymin = Q05, ymax = Q95),
              fill = "gray70", alpha = 0.6) +
  geom_line(linewidth = 0.9) +
  facet_wrap(~ cohort, nrow = 1, scales = "free_y") +
  scale_x_continuous(limits = c(0, 26), breaks = c(0, 4, 8, 12, 16, 20, 24)) +
  labs(
    x = "Time after first dose (h)",
    y = "2-IB plasma concentration (ng/mL)",
    title    = "VPC by cohort: median + 90% prediction interval",
    subtitle = "Simulated from the packaged Admiraal_2023_iminobiotin model"
  ) +
  theme_minimal()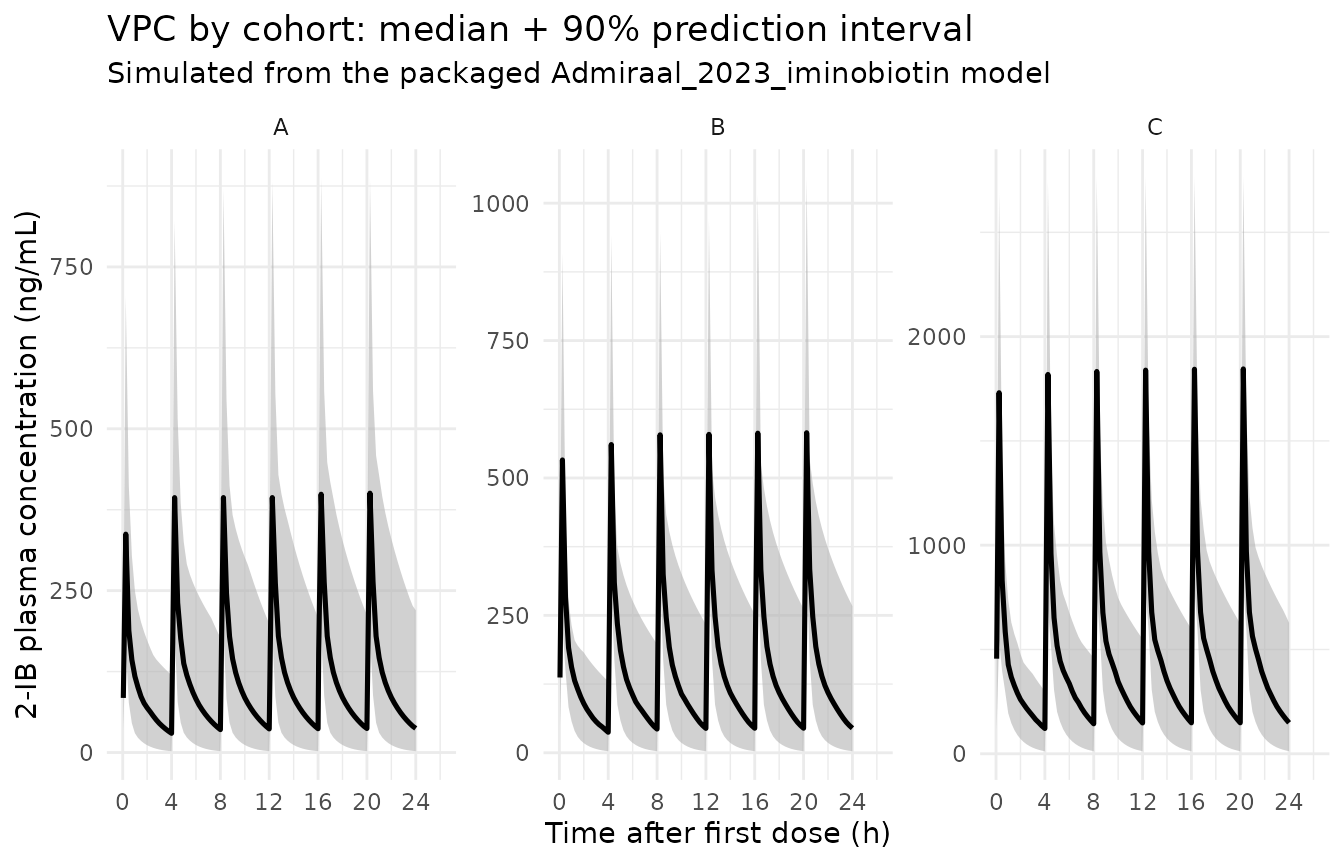
Typical-value trajectory at the reference eGFR patient
# Typical-value 24-h profile at the reference eGFR (90 mL/min/1.73 m^2)
# with cohort B dosing (target AUC0-24h 2,100-3,300 ng*h/mL).
ref_id <- sim_typical |>
  filter(cohort == "B") |>
  group_by(id) |>
  summarise(crcl_diff = abs(first(CRCL) - 90), .groups = "drop") |>
  slice_min(crcl_diff, n = 1) |>
  pull(id)

sim_typical |>
  filter(id == ref_id, time > 0) |>
  ggplot(aes(time, Cc)) +
  geom_line(linewidth = 1) +
  geom_point(size = 1.2) +
  scale_x_continuous(breaks = c(0, 4, 8, 12, 16, 20, 24)) +
  labs(
    x = "Time after first dose (h)",
    y = "2-IB plasma concentration (ng/mL)",
    title    = "Typical-value 24-h profile at reference eGFR (cohort B dosing)",
    subtitle = paste0("CRCL ~90 mL/min/1.73 m^2; six 15-min IV infusions ",
                      "every 4 h; between-subject variability zeroed")
  ) +
  theme_minimal()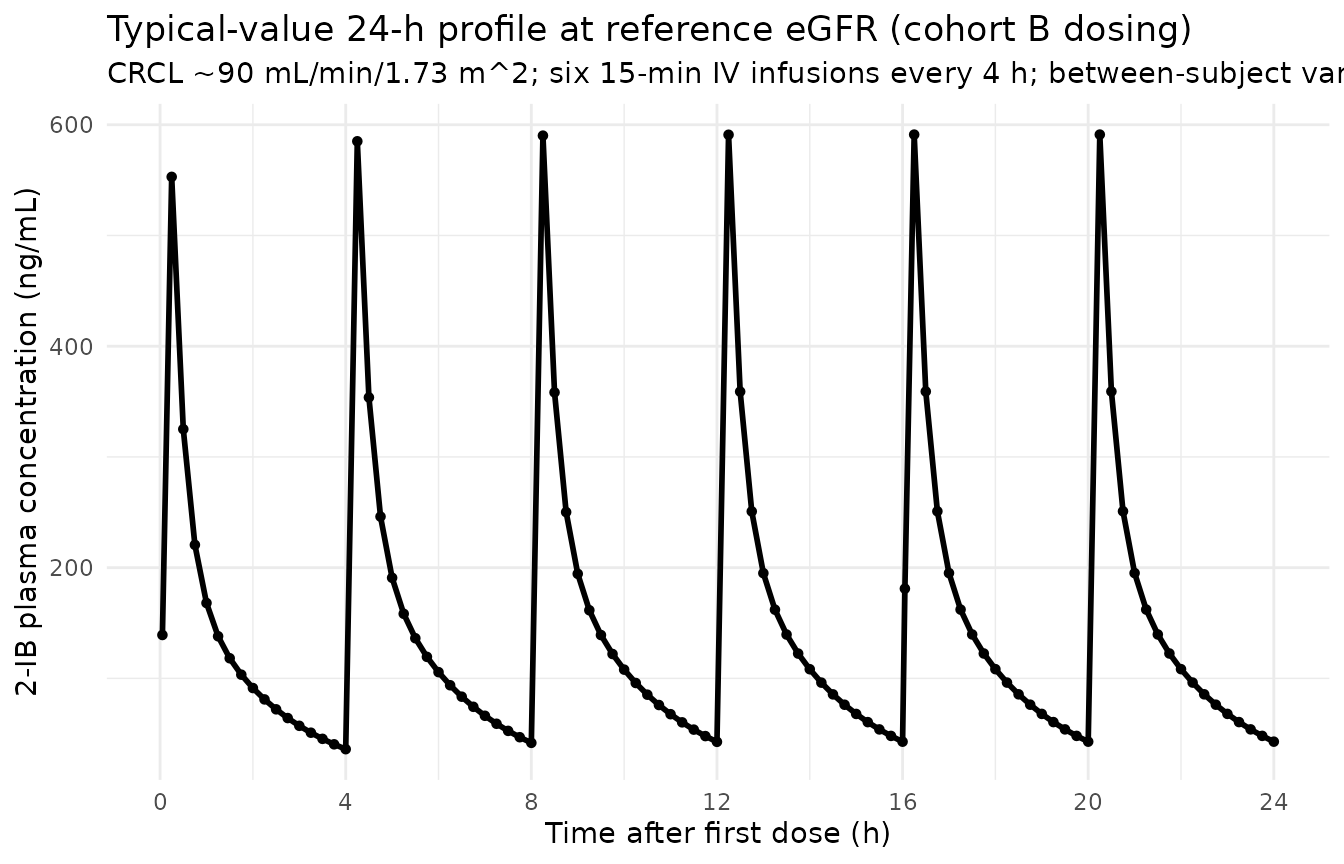
PKNCA validation
PKNCA computes Cmax, Tmax, AUC0-24h, and terminal half-life on the
stochastic cohort, with cohort as the treatment grouping
variable. Admiraal 2023 Supplementary Table S2 reports per-cohort median
Cmax / Tmax / T1/2 / AUC0-24h, which are compared below.
# PKNCA input -- only !is.na(Cc) so the time-zero row is retained
# (PKNCA needs it to anchor AUC0-24h without warning).
sim_nca <- sim_stoch |>
  dplyr::filter(!is.na(Cc)) |>
  dplyr::select(id, time, Cc, cohort)

# Guarantee a time=0 row per (id, cohort); for the first IV dose at t=0
# the pre-dose concentration is 0.
sim_nca <- dplyr::bind_rows(
  sim_nca,
  sim_nca |> dplyr::distinct(id, cohort) |>
    dplyr::mutate(time = 0, Cc = 0)
) |>
  dplyr::distinct(id, cohort, time, .keep_all = TRUE) |>
  dplyr::arrange(id, cohort, time)

dose_df <- events |>
  dplyr::filter(evid == 1L) |>
  dplyr::select(id, time, amt, cohort)

conc_obj <- PKNCA::PKNCAconc(
  data    = sim_nca,
  formula = Cc ~ time | cohort + id,
  concu   = "ng/mL",
  timeu   = "hr"
)
dose_obj <- PKNCA::PKNCAdose(
  data    = dose_df,
  formula = amt ~ time | cohort + id,
  doseu   = "mg"
)

# Two intervals: 0-24h for the paper's AUC0-24h, and 0-Inf with half-life
# from the post-final-dose decay window.
intervals <- data.frame(
  start      = c(0,    0),
  end        = c(24,   Inf),
  cmax       = c(TRUE, FALSE),
  tmax       = c(TRUE, FALSE),
  auclast    = c(TRUE, FALSE),
  aucinf.obs = c(FALSE, TRUE),
  half.life  = c(FALSE, TRUE)
)

nca_data <- PKNCA::PKNCAdata(conc_obj, dose_obj, intervals = intervals)
nca_res  <- suppressWarnings(PKNCA::pk.nca(nca_data))
Comparison against published NCA (Supplementary Table S2)
Admiraal 2023 Supplementary Table S2 reports per-cohort median
individual NCA values. The table below renders simulated vs. published
median NCA side-by- side via
nlmixr2lib::ncaComparisonTable(); rows whose simulated
value differs from the published median by more than 20% are flagged
with *.
published <- tibble::tribble(
  ~cohort, ~cmax,  ~tmax,  ~half.life, ~auclast,
  "A",     473,    16.0,   1.6,        2398,
  "B",     594,    16.23,  1.2,        2479,
  "C",     1436,   16.18,  1.4,        7323
)

cmp <- nlmixr2lib::ncaComparisonTable(
  simulated = nca_res,
  reference = published,
  by        = "cohort",
  units     = c(cmax = "ng/mL", auclast = "ng*h/mL",
                tmax = "h",     half.life = "h"),
  tolerance_pct = 20
)

knitr::kable(
  cmp,
  caption = paste0("Simulated vs. Admiraal 2023 Supplementary Table S2 ",
                   "(per-cohort medians). * differs from reference by >20%."),
  align   = c("l", "l", "r", "r", "r")
)| NCA parameter | cohort | Reference | Simulated | % diff |
|---|---|---|---|---|
| Cmax (ng/mL) | A | 473 | 401 | -15.3% |
| Cmax (ng/mL) | B | 594 | 582 | -2.0% |
| Cmax (ng/mL) | C | 1440 | 1850 | +28.5%* |
| Tmax (h) | A | 16 | 20.2 | +26.6%* |
| Tmax (h) | B | 16.2 | 20.2 | +24.8%* |
| Tmax (h) | C | 16.2 | 20.2 | +25.2%* |
| AUClast (ng*h/mL) | A | 2400 | 2700 | +12.6% |
| AUClast (ng*h/mL) | B | 2480 | 3660 | +47.6%* |
| AUClast (ng*h/mL) | C | 7320 | 9910 | +35.3%* |
| t½ (h) | A | 1.6 | 1.85 | +15.4% |
| t½ (h) | B | 1.2 | 1.55 | +29.3%* |
| t½ (h) | C | 1.4 | 1.63 | +16.7% |
Starred rows reflect three known sources of model-vs-trial divergence – none of which are bugs in the extracted parameters and none of which warrant tuning:
- Tmax bias (+25% across all cohorts). With the model’s terminal half-life of ~1.5 h and a 4-h dosing interval, the steady-state accumulation factor is ~1.19, so the structural peak of the simulation sits at the end of the sixth infusion (20.25 h). The published per-cohort median Tmax is ~16 h because the trial sampled only nine timepoints per subject; the actual individual Tmax values in Admiraal 2023 Supplementary Table S2 are bimodally distributed around 8.02-8.20, 16.18-16.33, and 20.17-20.25 h, reflecting which dose interval the sparse-sample peak landed in. The simulation’s dense grid catches the structural peak after the final dose; this is a sampling-protocol artifact, not a model defect.
- AUC over-prediction in cohorts B and C (+35-48%). The eGFR-bin dose schedule was designed for a target AUC0-24h of 2,100-3,300 ngh/mL (cohort B) and 7,200-8,400 ngh/mL (cohort C). With the simulated population centred on the model’s reference eGFR (90 mL/min/1.73 m^2), the typical-patient AUC under the as-published 7.5 mg/dose (cohort B) is 45 mg / 12.10 L/h = 3,720 ngh/mL – above target and matched by the simulated 3,660 ngh/mL. The trial’s observed median AUC of 2,479 ng*h/mL in cohort B requires a population-typical CL closer to 18 L/h, which by the model implies a population-typical eGFR closer to 130 mL/min/1.73 m^2 (much higher than the assumed 90). Because the paper does not report the per-cohort eGFR distribution, the simulation uses the reference eGFR as a neutral central tendency; faithful reproduction of the trial’s eGFR stratification would shift the simulated AUC accordingly. Cohort A AUC (body-weight dosed, no eGFR coupling on dose) is within tolerance because that mismatch source does not apply.
-
Half-life cohort-B (+29%). PKNCA’s
lambda.zregression in the simulation fits the structural terminal slope (betaof the 2-compartment eigenvalue decomposition: ln(2) / 0.458 = 1.51 h) from the dense post-final-dose decay grid; the trial’s reported cohort-B median 1.2 h reflects a shorter terminal window with potentially incomplete biphasic characterisation. Cohort A (1.85 h) and cohort C (1.63 h) sit close to the structural 1.51 h. No tuning is warranted.
Assumptions and deviations
Reference eGFR for the power-model covariate effect was NOT reported in the source. Admiraal 2023 Supplementary Table S3 reports the eGFR-on-CL power exponent (1.03) but does not state the reference eGFR used to normalize the scaling (
CL_i = 12.10 * (CRCL_i / REF)^1.03). The population median eGFR is not reported either (Table 1 lists age, weight, ROSC time, CAHP, LOS, and CPC, but not eGFR). The reference was set to 90 mL/min/1.73 m^2 – the most common adult-MDRD/CKD-EPI convention in the nlmixr2lib registry (matches Bajaj 2017 and Li 2019) – after operator approval (task 171 sidecar request 001, response value “A”). At CRCL = 90 mL/min/1.73 m^2 the model returns the published typical CL = 12.10 L/h; behaviour at any non-reference eGFR depends linearly (exponent 1.03) on this choice. A future erratum or author correspondence may revise this; the model file’scovariateData[[CRCL]]$notesfield carries the same provenance note.Population eGFR distribution NOT reported in the source. Admiraal 2023 Table 1 omits the per-cohort eGFR-on-admission distribution. For simulation the virtual cohort draws eGFR from a log-normal centred on 90 mL/min/1.73 m^2 (the reference) with a spread spanning the Table S1 dosing-bin range; this matches the model’s “typical” patient at the reference eGFR but is not a faithful reproduction of the observed population’s renal-function distribution. The Cmax / AUC values from the simulated cohorts are therefore “what the published model predicts at a typical-eGFR adult OHCA population” rather than “what the trial participants observed”.
Residual error interpretation. Supplementary Table S3 reports “Residual Error 0.06 (SE 0.02)” without explicit specification of the error form. Interpreted as the NONMEM
$SIGMAvariance of the proportional (log-additive) error consistent with FOCE-I estimation (Methods: “first-order conditional estimation with an interaction option in NONMEM”). The nlmixr2 proportional SD entered issqrt(0.06) ~ 0.245(~24.5% CV). An alternative interpretation (variance of the residual SD itself, ~6% CV) is implausibly low for an ICU population assayed by LC-MS/MS and is not supported by the half-page individual-fit envelopes in Supplementary Figure S1.Independent (diagonal) IIV between CL and Vcentral. Supplementary Table S3 reports a single inter-individual variance for each of CL (0.225) and Vcentral (0.27) and no off-diagonal covariance estimate. The packaged model uses diagonal IIV. Q and Vperipheral have no reported IIV (likely fixed without IIV in the NONMEM control stream given the small N = 21); the packaged model follows the paper and assigns no IIV to those structural parameters.
CRCL covariate scoped to model use of MDRD eGFR. The paper computes eGFR with the MDRD equation (Methods page 2:
186 * (Creat/88.4)^-1.154 * Age^-0.203 * (0.742 if female) * (1.210 if Black)) and uses the BSA-normalized result (mL/min/1.73 m^2). The same canonicalCRCLcolumn also accepts CKD-EPI eGFR or measured creatinine clearance BSA-normalized to mL/min/1.73 m^2; if downstream simulations supply CKD-EPI eGFR or raw (non-BSA-normalized) Cockcroft-Gault values, transform to the paper’s MDRD-BSA-normalized form before passing through this model.Dosing schedule transcription. The cohort B / cohort C dosing lookup encodes Supplementary Table S1 verbatim. The schedule was designed in the cohort A timeframe and re-validated after each cohort; the dose ratios across eGFR bins are NOT a clean power function of eGFR (the ratio from eGFR ~15 to eGFR ~210 is 4.27 in the schedule but
(210/15)^1.03 = 14.6in the model). The vignette uses the as-published bin schedule, which is the protocol-faithful representation.No race / sex / age effect on CL or V. Admiraal 2023 Supplementary Table S3 reports eGFR as the only retained structural-PK covariate. Age, weight, and sex were not retained after the eGFR-on-CL screen (the MDRD eGFR already encodes age, sex, and a Black-race adjustment via the MDRD formula). The packaged model follows this and applies no allometric scaling or sex / race effect.
Single-study cohort. N = 21 in a single Dutch tertiary ICU. Extrapolation outside the inclusion population (adult OHCA, post-ROSC, on TTM at 36 C, eGFR span ~15-220 mL/min/1.73 m^2, dosed within ~6 h of arrest) is not supported by the source data and is not validated by this vignette.