Venlafaxine and fluoxetine HAMD dose-response MBMA (Maringwa 2025)
Source:vignettes/articles/Maringwa_2025_venlafaxine_fluoxetine_mbma.Rmd
Maringwa_2025_venlafaxine_fluoxetine_mbma.RmdModel and source
- Citation: Maringwa J, Diderichsen PM, Valiathan C. Partial Residual Plots as an Integrated Model Diagnostic Tool in Model-Based Meta-Analysis. Clin Pharmacol Ther. 2025;117(1):153-161. doi:10.1002/cpt.3418. Model structure is Equations 1 and 2 (Methods, Model formulation) and the gnls fitting script in Table S1 of the supplement; parameter estimates are in Table 2; the 43-arm study-level dataset is in Table S1.
- Article: https://doi.org/10.1002/cpt.3418 (PMC11652818, open access)
Maringwa 2025 is primarily a methodology paper: it proposes partial residual plots (PRPs) as an integrated model diagnostic for model-based meta-analysis. To demonstrate them the authors built a complete, original MBMA of antidepressant dose-response, and it is that worked example – fully specified, fully parameterised, with its arm-level dataset and its fitting script published in the supplement – that is extracted here.
The model describes the study-arm mean change from baseline in the Hamilton Depression Rating (HAMD) scale. Venlafaxine follows an relationship in total daily dose. Fluoxetine, studied over only 20-60 mg/day, showed no identifiable dose-response and instead carries a single constant shift versus placebo. Both drug effects are scaled by a shared multiplicative term in the arm’s mean baseline HAMD score, so a more severely depressed arm is predicted to show a larger drug effect.
Population
Sixteen placebo-controlled trials published 1987-2014, 43 study arms, 3,432 patients: 1,289 on venlafaxine (ten trials), 982 on fluoxetine (eight trials) and 1,161 on placebo. Two of the 16 trials investigated both drugs. Venlafaxine doses spanned 25-375 mg/day and fluoxetine doses 20, 40 and 60 mg/day. The trials were drawn from a proprietary antidepressant literature database assembled following the Cochrane Handbook and PRISMA reporting items; the paper states that its purpose “was to illustrate methodology rather than compare the selected drugs.”
Each modelled observation is a study-arm mean, not an individual patient value. The simulation scope of this model is therefore the arm-mean HAMD change; it is not suitable for individual-subject simulation, and it has no PK layer and no time course. Because there is no concentration-time profile, the PKNCA validation used in this package’s PK vignettes does not apply; the validation below is instead a direct replication of the paper’s own published predictions and figures.
The same information is available programmatically via
rxode2::rxode(readModelDb("Maringwa_2025_venlafaxine_fluoxetine_mbma"))$population.
Source trace
The structural model is Equations 1 and 2 (Methods, Model formulation):
is the mean change from baseline in HAMD in arm of trial ; is an unstructured trial-specific placebo response (one fixed effect per trial); is the arm’s mean baseline HAMD score. For fluoxetine the dose-response collapses to its limit, for , which is the indicator form the paper’s displayed final equation uses.
| Equation / parameter | Value | Source location |
|---|---|---|
| Structural model (Eqs 1-2) | n/a | Methods, Model formulation, p. 154 |
Fitting function ModelFuncx()
|
n/a | Supplement Table S1, chunk modeldevelopment
|
e0 (typical placebo response) |
-8 HAMD points | Table 2 caption; Results (trial-specific mean -8.0, range -12.0 to -3.0) |
emax_venlafaxine |
-4.41 | Table 2, value printed on the row labelled “Constant shift fluoxetine” (SE 0.648, 15% RSE) – see Errata |
led50_venlafaxine |
3.37 (log mg/day; 29.1 mg/day) | Table 2, “Log ED50 venlafaxine” (SE 0.915, 27% RSE); untransformed value in Results |
shift_fluoxetine |
-1.75 | Table 2, value printed on the row labelled “Emax venlafaxine” (SE 0.588, 34% RSE) – see Errata |
e_score_hamd_drug |
0.0986 per HAMD point | Table 2, “Multiplicative effect of baseline HAMD score on Emax/Constant shift” (SE 0.0366, 37% RSE); LRT P = 0.0122 |
| Baseline centring constant | 25 | Supplement Table S1 script:
eff.bas = (1 + bbas * (baseline - 25)) – see Errata |
| Between-trial random effect | none | Absorbed by the 16 unstructured per-trial placebo fixed effects |
addSd (residual) |
1, held constant | Methods: per-arm reported SEs used as fixed weights, “technically
setting the residual standard deviation (sigma) to 1”; supplement
weights = varFixed(~change.var),
control = list(sigma = 1)
|
Errata
Two errors in the published presentation of this model are corrected here. Both were established from the available sources only – the paper, its figures, and its supplement – and both are load-bearing: encoding the paper exactly as printed reproduces none of its own published predictions and reverses its headline conclusion.
1. Table 2’s two drug-effect rows carry transposed labels
Re-running the supplement’s own gnls script, verbatim
and unmodified, against the supplement’s own 43-arm Table S1 dataset
returns:
| Script parameter | Meaning | Estimate (SE) | %RSE |
|---|---|---|---|
emven |
venlafaxine | -4.4057 (0.6477) | 15 |
emflu |
fluoxetine constant shift | -1.7535 (0.5884) | 34 |
edven |
log ED50 venlafaxine | 3.3699 (0.9149) | 27 |
bbas |
baseline HAMD slope | 0.0986 (0.0366) | 37 |
Table 2 of the paper prints exactly these four values and exactly these four standard errors and %RSEs – but attaches -4.41 / 0.648 / 15% to the row labelled “Constant shift fluoxetine” and -1.75 / 0.588 / 34% to the row labelled “Emax venlafaxine”. It is the estimate-with-its-own-standard-error pairing that identifies this as a label transposition rather than a value error: the numbers are right, the two row headings are swapped. The “Log ED50 venlafaxine” and baseline-slope rows are correctly labelled.
2. The displayed final equation prints the centring as (B - 23); the fit used (B - 25)
The paper’s displayed final equation writes the baseline term as
.
The supplement’s ModelFuncx() hard-codes
(baseline - 25). The two constants are different quantities
that were conflated when the equation was typeset:
- 25 is the centring constant of the fitted covariate model.
-
23 is
round(mean(baseline))over the 43 arms (23.33), the reference baseline at which the paper displays every prediction – it is the value named in the Table 2 caption and in the Figure 1-4 captions.
Why this matters, and how the correction is verified
The paper reports (Results, p. 156) predicted differences from placebo at a typical baseline HAMD of 23 of -1.41 for fluoxetine at 60 mg/day and -3.28 for venlafaxine at 375 mg/day, and concludes that venlafaxine outperforms fluoxetine. The three candidate parameterisations give:
ed50 <- exp(3.37)
bbas <- 0.0986

diff_from_placebo <- function(emven, emflu, centre) {
  f <- 1 + bbas * (23 - centre)
  c(fluoxetine_60 = emflu * f,
    venlafaxine_375 = emven * 375 / (ed50 + 375) * f)
}

rbind(
  `Table 2 as printed, equation's (B - 23)` = diff_from_placebo(-1.75, -4.41, 23),
  `Table 2 as printed, script's (B - 25)`   = diff_from_placebo(-1.75, -4.41, 25),
  `labels transposed, script's (B - 25)`    = diff_from_placebo(-4.41, -1.75, 25),
  `paper's published values`                = c(-1.41, -3.28)
) |> round(3)
#>                                         fluoxetine_60 venlafaxine_375
#> Table 2 as printed, equation's (B - 23)        -4.410          -1.624
#> Table 2 as printed, script's (B - 25)          -3.540          -1.304
#> labels transposed, script's (B - 25)           -1.405          -3.286
#> paper's published values                       -1.410          -3.280
Only the third row – the parameterisation encoded in this model file – reproduces the paper’s own published numbers, and it does so to three significant figures for both drugs simultaneously. Taken as printed, Table 2 would make fluoxetine roughly 2.7 times more effective than venlafaxine, the opposite of what the paper concludes and the opposite of what its own raw data show (Table 1: mean drug-minus-placebo change -1.26 for fluoxetine, -2.88 for venlafaxine).
The published study-level dataset
Supplement Table S1 tabulates all 43 arms. It is reproduced here so that every replication below runs against the paper’s own data. Trial labels containing a space have had it replaced by an underscore.
tableS1 <- read.table(header = TRUE, stringsAsFactors = FALSE, text = "
trial          drug        dose   base    n   change
11492A         placebo        0  29.70  105 -12.2300
11492A         venlafaxine  225  29.40  114 -17.3200
211            fluoxetine    60  26.00  103 -11.5403
211            placebo        0  25.00   98 -10.9115
211            venlafaxine  225  25.00  100 -13.2170
600A-203       placebo        0  25.30   92  -6.7000
600A-203       venlafaxine   75  26.00   89 -11.1000
600A-203       venlafaxine  225  26.00   89 -11.9000
600A-203       venlafaxine  375  24.90   88 -10.5000
600A-206       placebo        0  28.60   47  -4.8000
600A-206       venlafaxine  375  28.20   46 -14.2000
600A-301       placebo        0  24.60   78  -9.4500
600A-301       venlafaxine  182  25.40   76 -13.9200
600A-302       placebo        0  24.41   76  -8.8800
600A-302       venlafaxine  225  25.02   74 -11.9200
600A-313       placebo        0  25.39   79  -9.4900
600A-313       venlafaxine   25  25.92   80 -10.3100
600A-313       venlafaxine   75  25.43   76 -10.9200
600A-313       venlafaxine  200  25.57   82 -11.8300
600B-208       placebo        0  24.90   92  -8.7100
600B-208       venlafaxine  150  24.50   90 -15.1100
600B-208       venlafaxine  150  24.00   88 -12.2500
600B-209       placebo        0  24.10  102  -7.2400
600B-209       venlafaxine  225  24.10   95 -11.7000
62A            fluoxetine    20  16.99  107  -6.2300
62A            fluoxetine    40  16.83  105  -6.0400
62A            fluoxetine    60  17.20  104  -5.3900
62A            placebo        0  17.41   56  -5.8200
62B            fluoxetine    20  24.72  100  -9.7800
62B            fluoxetine    40  24.19  103  -9.5800
62B            fluoxetine    60  24.20  105  -7.2000
62B            placebo        0  24.25   48  -5.6900
Devanand_2005  fluoxetine    60  15.00   44  -4.1000
Devanand_2005  placebo        0  14.10   46  -1.3000
EPIC014        fluoxetine    60  23.70  104  -9.8456
EPIC014        placebo        0  23.70  102  -9.1531
EPIC014        venlafaxine  225  23.50  102 -11.3540
Fava_2005      fluoxetine    20  19.60   47  -6.3000
Fava_2005      placebo        0  19.90   43  -7.3000
HMAQ-A         fluoxetine    20  17.90   33  -7.7500
HMAQ-A         placebo        0  19.20   70  -6.6100
Strik_2000     fluoxetine    60  22.00   27  -8.3400
Strik_2000     placebo        0  21.20   27  -5.8400
")

tableS1 <- tableS1 |>
  dplyr::mutate(
    CONMED_VENLAFAXINE_DOSE = ifelse(drug == "venlafaxine", dose, 0),
    CONMED_FLUOXETINE_DOSE  = ifelse(drug == "fluoxetine",  dose, 0),
    SCORE_HAMD              = base
  )

# Reproduces the paper's Methods counts exactly.
stopifnot(
  nrow(tableS1) == 43L,
  length(unique(tableS1$trial)) == 16L,
  sum(tableS1$n) == 3432L,
  sum(tableS1$n[tableS1$drug == "venlafaxine"]) == 1289L,
  sum(tableS1$n[tableS1$drug == "fluoxetine"]) == 982L,
  sum(tableS1$n[tableS1$drug == "placebo"]) == 1161L,
  round(mean(tableS1$base)) == 23
)
c(arms = nrow(tableS1), trials = length(unique(tableS1$trial)),
  patients = sum(tableS1$n), mean_baseline = round(mean(tableS1$base), 2))
#>          arms        trials      patients mean_baseline
#>         43.00         16.00       3432.00         23.33
Virtual cohort and solver helper
The model is algebraic: it consumes no dose events and has no time course, so each study arm is a single time-0 observation record carrying that arm’s covariate columns.
mod <- readModelDb("Maringwa_2025_venlafaxine_fluoxetine_mbma")

arm_template <- list(
  CONMED_VENLAFAXINE_DOSE = 0,
  CONMED_FLUOXETINE_DOSE  = 0,
  SCORE_HAMD              = 23
)

solve_arms <- function(arms, keep = character()) {
  ev <- arms[names(arm_template)]
  ev$id <- seq_len(nrow(ev))
  ev$time <- 0
  ev$amt <- 0
  ev$evid <- 0L
  out <- as.data.frame(rxode2::rxSolve(mod, events = ev))
  stopifnot(nrow(out) == nrow(arms), !anyNA(out$Cc))
  cbind(arms[keep], hamd_change = out$Cc)
}
Cc is the nlmixr2lib single-output observation name;
here it carries the arm-mean change from baseline in
HAMD, not a drug concentration, so Cc = -11.3 is
an 11.3-point improvement.
Replication: the published predicted differences from placebo
This is the tightest available check. Both sides are deterministic – there is no random effect anywhere in this model – so the only difference is the paper’s rounding of Table 2 to three significant figures. A transposed digit, a dropped minus sign or the wrong centring constant moves these cells by whole HAMD points, so a tight bound still fails loudly.
probe <- data.frame(
  label = c("placebo", "fluoxetine 60 mg/day", "venlafaxine 375 mg/day"),
  CONMED_VENLAFAXINE_DOSE = c(0, 0, 375),
  CONMED_FLUOXETINE_DOSE  = c(0, 60, 0),
  SCORE_HAMD = 23
)

pred <- solve_arms(probe, keep = "label")
#> Warning: multi-subject simulation without without 'omega'
pred$difference_from_placebo <- pred$hamd_change - pred$hamd_change[1]
pred$published <- c(NA, -1.41, -3.28)

pred |>
  dplyr::rename(
    "Arm" = label,
    "Model: HAMD change" = hamd_change,
    "Model: difference from placebo" = difference_from_placebo,
    "Maringwa 2025 Results" = published
  ) |>
knitr::kable(digits = 3)| Arm | Model: HAMD change | Model: difference from placebo | Maringwa 2025 Results |
|---|---|---|---|
| placebo | -8.000 | 0.000 | NA |
| fluoxetine 60 mg/day | -9.405 | -1.405 | -1.41 |
| venlafaxine 375 mg/day | -11.286 | -3.286 | -3.28 |
stopifnot(
  # Placebo arms must return the typical placebo response exactly: the
  # baseline-severity term multiplies the DRUG effect only, so it cancels.
  abs(pred$hamd_change[1] - (-8)) < 1e-10,
  # Deterministic reproduction of both published values.
  abs(pred$difference_from_placebo[2] - (-1.41)) < 0.02,
  abs(pred$difference_from_placebo[3] - (-3.28)) < 0.02
)
Replication: dose-response against the arm-level data (Figure 2)
Figure 2 of the paper plots the model prediction against dose for each drug, overlaid on the observed study-arm means. The prediction line is drawn at a typical placebo response of -8 and a mean baseline HAMD of 23.
grid <- dplyr::bind_rows(
  data.frame(drug = "venlafaxine", dose = seq(0, 375, by = 1)),
  data.frame(drug = "fluoxetine",  dose = seq(0, 60, by = 1))
) |>
  dplyr::mutate(
    CONMED_VENLAFAXINE_DOSE = ifelse(drug == "venlafaxine", dose, 0),
    CONMED_FLUOXETINE_DOSE  = ifelse(drug == "fluoxetine",  dose, 0),
    SCORE_HAMD = 23
  )

pline <- solve_arms(grid, keep = c("drug", "dose"))
#> Warning: multi-subject simulation without without 'omega'

obs <- tableS1 |>
  dplyr::filter(drug != "placebo") |>
  dplyr::bind_rows(
    # A placebo arm appears in the panel of whichever drug its trial studied.
    tableS1 |>
      dplyr::filter(drug == "placebo") |>
      dplyr::inner_join(
        tableS1 |>
          dplyr::filter(drug != "placebo") |>
          dplyr::distinct(trial, panel = drug),
        by = "trial", relationship = "many-to-many"
      ) |>
      dplyr::mutate(drug = panel) |>
      dplyr::select(-panel)
  )

ggplot2::ggplot(pline, ggplot2::aes(dose, hamd_change)) +
  ggplot2::geom_point(data = obs, ggplot2::aes(dose, change, size = n),
                      shape = 21, fill = NA) +
  ggplot2::geom_line(linewidth = 1) +
  ggplot2::facet_wrap(~drug, scales = "free_x") +
  ggplot2::scale_size_area(max_size = 6) +
  ggplot2::labs(x = "Total daily dose (mg/day)",
                y = "Mean HAMD score: change from baseline",
                size = "Arm size") +
  ggplot2::theme_bw()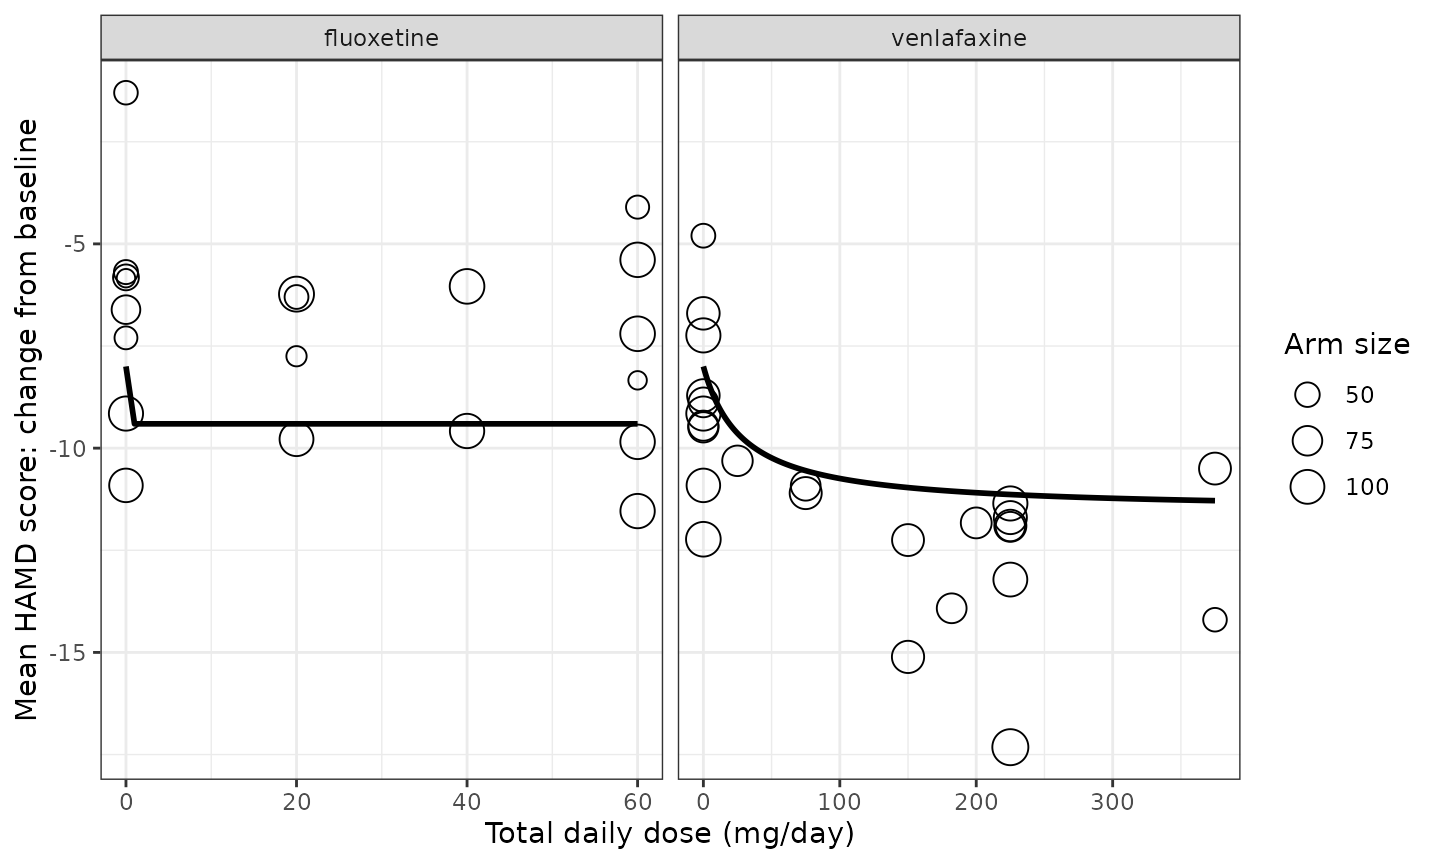
Replicates Figure 2 of Maringwa 2025 (the ‘Observed’ panels): model prediction versus total daily dose at a typical placebo response of -8 and a mean baseline HAMD of 23, overlaid on the observed study-arm means. Point area is proportional to arm size. Venlafaxine shows a clear Emax dose-response; fluoxetine is flat above zero dose by construction.
The two features the paper draws attention to are both reproduced. Venlafaxine’s ED50 of 29.1 mg/day sits below every studied dose except the 25 mg/day arm, so the curve is already near its plateau across most of the studied range. For fluoxetine, most observed points sit above the prediction line – the discrepancy that motivates the whole PRP argument, and which the paper attributes to those arms’ mean baseline HAMD and placebo response differing from the reference values used to draw the line, rather than to a bad model.
vals <- pline |>
  dplyr::filter((drug == "venlafaxine" & dose %in% c(0, 25, 225, 375)) |
                (drug == "fluoxetine"  & dose %in% c(0, 20, 60)))

stopifnot(
  # Fluoxetine is a constant shift: every positive dose gives the same value.
  length(unique(round(pline$hamd_change[pline$drug == "fluoxetine" &
                                          pline$dose > 0], 10))) == 1L,
  # Both drugs return the typical placebo response at zero dose.
  all(abs(vals$hamd_change[vals$dose == 0] - (-8)) < 1e-10),
  # Venlafaxine is monotonically increasing in effect and bounded by its Emax.
  all(diff(pline$hamd_change[pline$drug == "venlafaxine"]) <= 0),
  min(pline$hamd_change[pline$drug == "venlafaxine"]) >
    -8 + (-4.41) * (1 + 0.0986 * (23 - 25))
)

vals |> dplyr::rename("Drug" = drug, "Dose (mg/day)" = dose,
                      "Predicted HAMD change" = hamd_change) |>
knitr::kable(digits = 3, row.names = FALSE)| Drug | Dose (mg/day) | Predicted HAMD change |
|---|---|---|
| venlafaxine | 0 | -8.000 |
| venlafaxine | 25 | -9.637 |
| venlafaxine | 225 | -11.135 |
| venlafaxine | 375 | -11.286 |
| fluoxetine | 0 | -8.000 |
| fluoxetine | 20 | -9.405 |
| fluoxetine | 60 | -9.405 |
Replication: response versus mean baseline HAMD (Figure 4)
Figure 4 shows the model prediction against the arm’s mean baseline HAMD score at a typical placebo response of -8 and fixed doses of 60 mg/day (fluoxetine) and 225 mg/day (venlafaxine), the most frequently reported dose for each drug. The paper’s point is that the negative slope confirms the direction of the tabulated baseline effect: “the larger the baseline, the larger the negative changes (improvement in HAMD scores).”
fixed_dose <- c(fluoxetine = 60, venlafaxine = 225)

bgrid <- dplyr::bind_rows(lapply(names(fixed_dose), function(g) {
  data.frame(drug = g, base = seq(13, 30, by = 0.25),
             dose = unname(fixed_dose[[g]]))
})) |>
  dplyr::mutate(
    CONMED_VENLAFAXINE_DOSE = ifelse(drug == "venlafaxine", dose, 0),
    CONMED_FLUOXETINE_DOSE  = ifelse(drug == "fluoxetine",  dose, 0),
    SCORE_HAMD = base
  )

bline <- solve_arms(bgrid, keep = c("drug", "base"))
#> Warning: multi-subject simulation without without 'omega'

ggplot2::ggplot(bline, ggplot2::aes(base, hamd_change)) +
  ggplot2::geom_point(data = dplyr::filter(tableS1, drug != "placebo"),
                      ggplot2::aes(base, change, size = n),
                      shape = 21, fill = NA) +
  ggplot2::geom_line(linetype = "dashed", linewidth = 1) +
  ggplot2::facet_wrap(~drug) +
  ggplot2::scale_size_area(max_size = 6) +
  ggplot2::labs(x = "Mean baseline HAMD score",
                y = "Mean HAMD score: change from baseline",
                size = "Arm size") +
  ggplot2::theme_bw()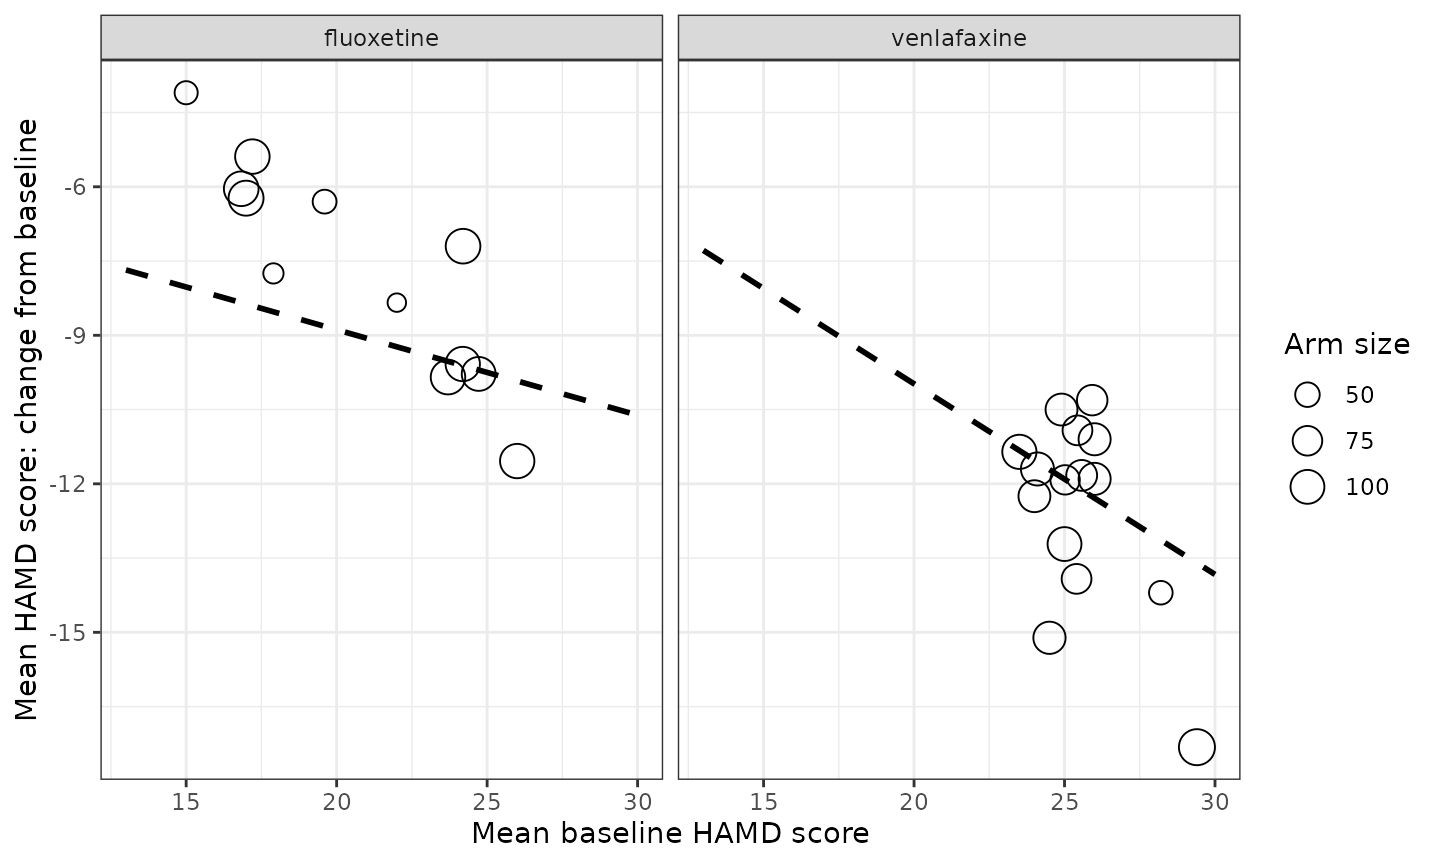
Replicates Figure 4 of Maringwa 2025 (the ‘Observed’ panels): model prediction versus mean baseline HAMD at a typical placebo response of -8 and fixed doses of 60 mg/day (fluoxetine) and 225 mg/day (venlafaxine), overlaid on the observed study-arm means for that drug. The negative slope is the multiplicative baseline effect acting on the drug effect.
slopes <- bline |>
  dplyr::group_by(drug) |>
  dplyr::summarise(slope = stats::coef(stats::lm(hamd_change ~ base))[["base"]],
                   .groups = "drop")

# The model is exactly linear in SCORE_HAMD at a fixed dose, with slope
# (drug effect at the centring baseline) * 0.0986.
expected <- c(
  fluoxetine  = -1.75 * 0.0986,
  venlafaxine = -4.41 * (225 / (exp(3.37) + 225)) * 0.0986
)

stopifnot(
  all(slopes$slope < 0),
  max(abs(slopes$slope - expected[slopes$drug])) < 1e-8
)

slopes |>
  dplyr::mutate(expected = unname(expected[drug])) |>
  dplyr::rename("Drug" = drug, "Fitted slope (per HAMD point)" = slope,
                "Closed form" = expected) |>
knitr::kable(digits = 4)| Drug | Fitted slope (per HAMD point) | Closed form |
|---|---|---|
| fluoxetine | -0.1726 | -0.1725 |
| venlafaxine | -0.3851 | -0.3851 |
Directional check against the paper’s RMSE
The paper reports root-mean-square errors between the reference prediction line and the observed arm means of 2.97 (fluoxetine) and 2.01 (venlafaxine). The paper does not state which arms enter each panel’s RMSE, so this is a directional check rather than an exact reproduction – but it does discriminate sharply between the candidate parameterisations.
rmse_for <- function(emven, emflu, centre) {
  vapply(c("fluoxetine", "venlafaxine"), function(g) {
    tr <- unique(tableS1$trial[tableS1$drug == g])
    k <- tableS1$drug == g | (tableS1$drug == "placebo" & tableS1$trial %in% tr)
    dd <- tableS1[k, ]
    eff <- ifelse(dd$drug == "venlafaxine",
                  emven * dd$dose / (exp(3.37) + dd$dose),
                  ifelse(dd$drug == "fluoxetine", emflu, 0))
    yhat <- -8 + eff * (1 + 0.0986 * (23 - centre))
    sqrt(mean((dd$change - yhat)^2))
  }, numeric(1))
}

rbind(
  `this model file (labels transposed, centre 25)` = rmse_for(-4.41, -1.75, 25),
  `Table 2 as printed, centre 25`                  = rmse_for(-1.75, -4.41, 25),
  `Table 2 as printed, equation's centre 23`       = rmse_for(-1.75, -4.41, 23),
  `Maringwa 2025 published RMSE`                   = c(2.97, 2.01)
) |> round(2)
#>                                                fluoxetine venlafaxine
#> this model file (labels transposed, centre 25)       2.84        2.26
#> Table 2 as printed, centre 25                        3.90        3.23
#> Table 2 as printed, equation's centre 23             4.44        3.05
#> Maringwa 2025 published RMSE                         2.97        2.01
The encoded parameterisation gives the smallest RMSE of the three candidates for both drugs and lands nearest the published pair; the as-printed variants are worse by a full HAMD point for fluoxetine.
Assumptions and deviations
- Table 2’s two drug-effect row labels are transposed and the displayed final equation’s centring constant is wrong. Both are corrected here, with the evidence set out in the Errata section above. This is the single most important thing to know about this extraction: the model file does not match the paper’s Table 2 read literally, and it is not supposed to.
-
The placebo response is unstructured, and only its typical
value is encoded. The paper estimated a separate fixed effect
for each of the 16 trials and reports only the summary “mean -8.0 (range
-12.0, -3.0)”; the individual trial estimates are not tabulated.
e0is therefore the typical value of -8 that the paper used for every published prediction. (The paper’s own script forms it asround(mean(eo)); the unrounded value from re-running the fit is -7.7.) A user simulating a specific trial should overridee0. - There is no between-trial random effect and no between-subject variability, because between-trial heterogeneity in placebo response is absorbed by those 16 per-trial fixed effects rather than by a variance component. The model predicts an arm mean deterministically.
-
addSdis held at 1, the estimation-scale sigma. The paper used each arm’s reported standard error of the change as a fixed weight rather than estimating a residual variance, so the per-arm residual SD issqrt(change.var)from Table S1 (0.55 to 1.60 HAMD points across the 43 arms). Applying that per-arm weighting is left to downstream simulation code, the same convention asMercier_2014_tramadol_tapentadol_mbmaandVargo_2014_statins_ezetimibe_mbma. -
Fluoxetine’s dose column enters only as
dose > 0. The paper found no fluoxetine dose-response over 20-60 mg/day and applies a constant shift to every active arm.CONMED_FLUOXETINE_DOSEretains the numeric dose for provenance, but changing it between 20 and 60 mg/day does not change the prediction. This is the limit of the paper’s Equation 2. -
CONMED_VENLAFAXINE_DOSEis a target, not an achieved, daily dose. Where a trial randomised patients to a titrated range (for example “venlafaxine 75-225 mg/day”), Table S1 records the top of the range as the arm’s dose. -
Extrapolation below a mean baseline HAMD of about 15 is
unsafe. The multiplicative term
1 + 0.0986 * (SCORE_HAMD - 25)has a root atSCORE_HAMD = 14.9, below which the modelled drug effect reverses sign. The lowest arm in the dataset (14.1) sits just below that root, so the behaviour there is an artefact of the linear covariate form rather than a finding. -
The intentionally misspecified model is not
extracted. Figures S1 and S2 present a variant in which
venlafaxine’s
Emaxdose-response is replaced by a constant shift, built deliberately as a straw man to show that PRPs reveal misspecification. Per the package’s replicate-the-author’s-structure policy, only the final model is extracted. - The paper’s RMSE values are reproduced only directionally, because the arm set behind each published RMSE is not specified.
-
The 43-arm dataset embedded in this vignette is transcribed
from supplement Table S1 (
CPT-117-153-s002.docx), published with the open-access article (PMC11652818). Its per-arm counts are asserted against the paper’s Methods text in the chunk above.