Piperaquine (Tarning 2008)
Source:vignettes/articles/Tarning_2008_piperaquine.Rmd
Tarning_2008_piperaquine.RmdModel and source
- Citation: Tarning J, Ashley EA, Lindegardh N, Stepniewska K, Phaiphun L, Day NPJ, McGready R, Ashton M, Nosten F, White NJ (2008). Population pharmacokinetics of piperaquine after two different treatment regimens with dihydroartemisinin-piperaquine in patients with Plasmodium falciparum malaria in Thailand. Antimicrobial Agents and Chemotherapy 52(3):1052-1061. doi:10.1128/aac.00955-07.
- Article: https://doi.org/10.1128/aac.00955-07
Population
Tarning et al. fitted the model to 469 piperaquine plasma concentrations from 98 Burmese and Karen patients (39.8% female, ages 3 - 55 y, body weight 12 - 74 kg, 11 children below 30 kg) with uncomplicated Plasmodium falciparum malaria treated on the Thai-Myanmar border with the dihydroartemisinin-piperaquine fixed-dose combination Artekin. Patients were randomised to either the standard four-dose regimen DP4 (doses at 0, 8, 24, 48 h; n = 50) or the once-daily three-dose regimen DP3 (doses at 0, 24, 48 h; n = 48) and were followed for 63 days post-treatment. Total piperaquine phosphate dose was titrated to 55 mg/kg (equivalent to ~31 mg/kg piperaquine base), rounded up to the nearest half tablet. Demographics are summarised in Tarning 2008 Table 1; the pooled cohort median body weight of 48 kg is the centring value used by the body-weight covariate effects.
The same information is available programmatically via
readModelDb("Tarning_2008_piperaquine")()$population.
Source trace
The per-parameter origin is recorded as an in-file comment next to
each ini() entry in
inst/modeldb/specificDrugs/Tarning_2008_piperaquine.R. The
table below collects them in one place for review.
| Equation / parameter | Value | Source location |
|---|---|---|
lcl (CL/F at 48 kg) |
66.0 L/h | Table 2 (%RSE 6.9) |
lvc (Vc/F at 48 kg) |
8 660 L | Table 2 (%RSE 14) |
lq (Q/F) |
131 L/h | Table 2 (%RSE 13) |
lvp (Vp/F) |
24 000 L | Table 2 (%RSE 13) |
lka (absorption rate) |
0.717 1/h | Table 2 (%RSE 25) |
e_wt_cl (linear WT effect on CL/F) |
0.0262 per kg from 48 kg | Table 2 (%RSE 2.9) |
e_wt_vc (linear WT effect on Vc/F) |
0.0273 per kg from 48 kg | Table 2 (%RSE 11) |
etalcl (IIV on CL/F) |
42% CV -> omega^2 = 0.162519 | Table 2 (%RSE 44) |
etalvc (IIV on Vc/F) |
101% CV -> omega^2 = 0.703107 | Table 2 (%RSE 17) |
etalq (IIV on Q/F) |
85% CV -> omega^2 = 0.543763 | Table 2 (%RSE 18) |
etalvp (IIV on Vp/F) |
50% CV -> omega^2 = 0.223144 | Table 2 (%RSE 76) |
etalka (IIV on ka) |
168% CV -> omega^2 = 1.340808 | Table 2 (%RSE 38) |
propSd (residual error) |
31.4% CV (proportional in linear space) | Table 2 (%RSE 29); Discussion p.1055 |
| Two-compartment ODE structure with first-order absorption | n/a | Methods p.1054 (“two-compartment pharmacokinetic models with elimination from the central compartment and with first-order absorption”) |
| Linear (1 + theta * (WT - 48)) covariate form | n/a | Methods p.1054 (“centered on the median value”) and Results p.1054 (“A linear relationship between body weight and clearance and body weight and central volume of distribution gave the best fit”) |
Exponential IIV
(CL/F)_i = TV(CL/F) * exp(eta_i,CL/F)
|
n/a | Methods p.1054 |
| Proportional residual error (additive on log-transformed concentrations) | n/a | Methods p.1054 + Discussion p.1055 (“the effective random residual error model should be considered multiplicative”) |
| Cohort median WT = 48 kg (centring value) | n/a | Table 1 pooled median; Table 2 covariate [WT - 48]
|
Virtual cohort
The original observed concentration-time data are not publicly available. The virtual cohorts below reproduce the demographic distributions reported in Table 1 - a pooled cohort across the DP4 (n = 50) and DP3 (n = 48) arms, including the 11 children below 30 kg. Weight is sampled from a truncated log-normal distribution whose median (48 kg) and 5th-95th percentiles bracket the reported 12 - 74 kg range.
set.seed(20260531)

make_arm <- function(n, dose_times_h, arm_label, id_offset = 0L) {
  # WT distribution chosen to match Table 1: pooled median 48 kg, range 12-74 kg.
  log_wt <- rnorm(n, mean = log(48), sd = 0.45)
  wt_kg  <- pmin(pmax(round(exp(log_wt)), 12), 74)

  # Total dose 55 mg/kg piperaquine phosphate ~= 31 mg/kg piperaquine base
  # (Table 1). Modelled in mg piperaquine base; total split equally across
  # arm-specific dose times (Methods p.1053).
  total_base_mg <- 31 * wt_kg
  per_dose_mg   <- total_base_mg / length(dose_times_h)

  ids <- id_offset + seq_len(n)
  obs_times <- c(seq(0, 8, by = 0.5),
                 seq(9, 72, by = 1),
                 seq(73, 24 * 63, by = 6))

  dose_rows <- tibble(
    id   = rep(ids, each = length(dose_times_h)),
    time = rep(dose_times_h, times = n),
    amt  = rep(per_dose_mg, each = length(dose_times_h)),
    evid = 1L,
    cmt  = "depot",
    WT   = rep(wt_kg, each = length(dose_times_h)),
    arm  = arm_label
  )
  obs_rows <- tibble(
    id   = rep(ids, each = length(obs_times)),
    time = rep(obs_times, times = n),
    amt  = 0,
    evid = 0L,
    cmt  = NA_character_,
    WT   = rep(wt_kg, each = length(obs_times)),
    arm  = arm_label
  )
  dplyr::bind_rows(dose_rows, obs_rows) |>
    dplyr::arrange(id, time, dplyr::desc(evid))
}

events <- dplyr::bind_rows(
  make_arm(50L, c(0, 8, 24, 48), "DP4", id_offset =   0L),
  make_arm(48L, c(0, 24, 48),    "DP3", id_offset = 100L)
)

stopifnot(!anyDuplicated(unique(events[, c("id", "time", "evid")])))
Simulation
mod_fn <- readModelDb("Tarning_2008_piperaquine")
mod    <- rxode2::rxode2(mod_fn())
sim <- rxode2::rxSolve(mod, events = events, keep = c("WT", "arm")) |>
  as.data.frame()
Replicate published figures
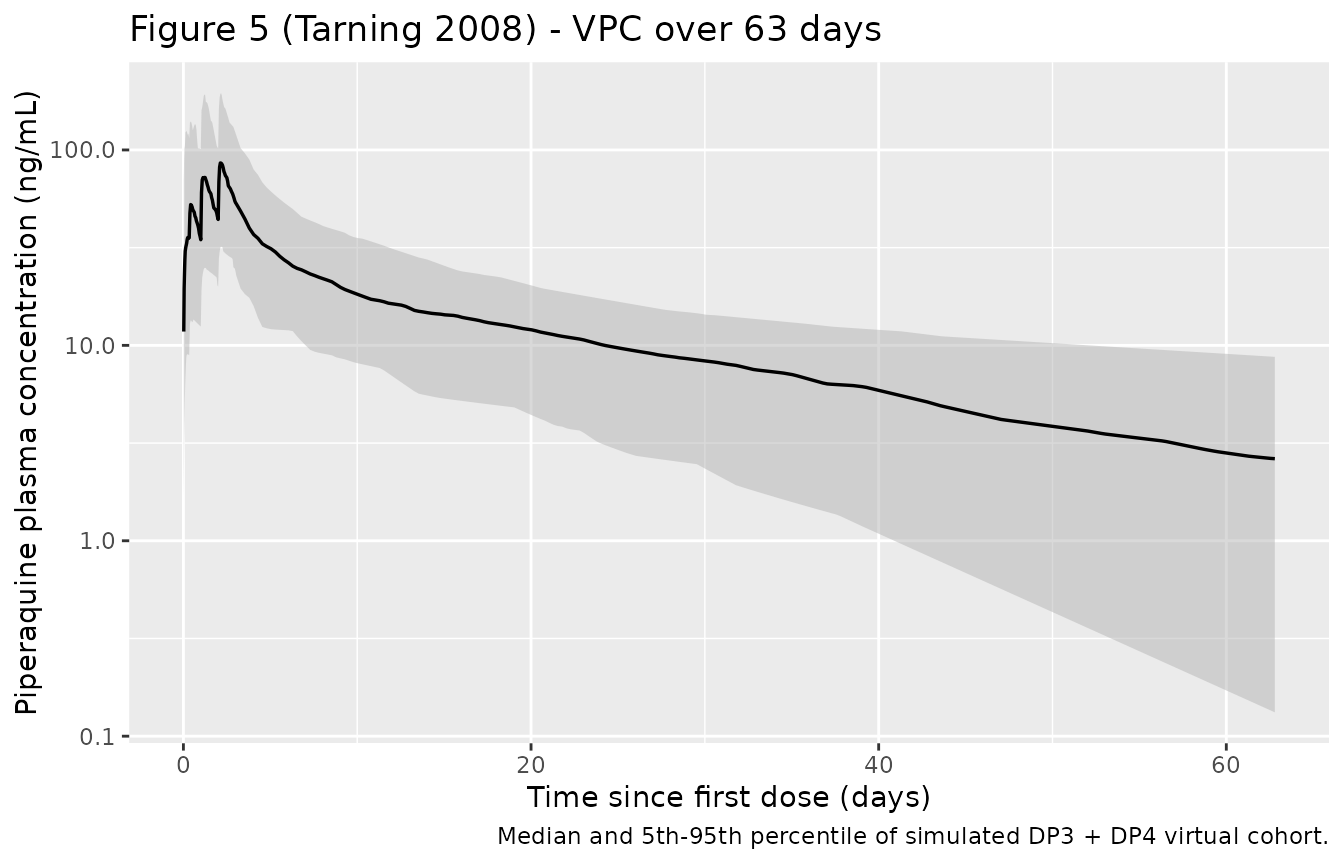
Replicates Figure 5 of Tarning 2008: piperaquine plasma concentration over the 63-day follow-up window with the population median (50th percentile) and 5th-95th percentile envelope from the virtual cohort.
sim_quant <- sim |>
  dplyr::filter(time > 0) |>
  dplyr::group_by(time) |>
  dplyr::summarise(
    Q05 = quantile(Cc, 0.05, na.rm = TRUE),
    Q50 = quantile(Cc, 0.50, na.rm = TRUE),
    Q95 = quantile(Cc, 0.95, na.rm = TRUE),
    .groups = "drop"
  )

ggplot(sim_quant, aes(time / 24, Q50)) +
  geom_ribbon(aes(ymin = Q05, ymax = Q95), fill = "grey70", alpha = 0.5) +
  geom_line(linewidth = 0.6) +
  scale_y_log10() +
  labs(
    x = "Time since first dose (days)",
    y = "Piperaquine plasma concentration (ng/mL)",
    title = "Figure 5 (Tarning 2008) - VPC over 63 days",
    caption = "Median and 5th-95th percentile of simulated DP3 + DP4 virtual cohort."
  )
Replicates Figure 4A of Tarning 2008: typical-value piperaquine concentration profiles contrasting the population mean (48 kg adult) against a child below 30 kg. The pediatric profile has a smaller early Cmax (smaller central volume of distribution per kg) and a longer terminal phase (lower body-weight- normalised clearance), in agreement with the paper’s discussion of altered pharmacokinetics in children.
mod_typ <- mod |> rxode2::zeroRe()

typ_events <- function(wt_kg, arm_label, id_val) {
  dose_times <- c(0, 24, 48)  # DP3 regimen
  per_dose   <- 31 * wt_kg / length(dose_times)
  obs_times  <- sort(unique(c(seq(0, 8, by = 0.25),
                              seq(9, 72, by = 1),
                              seq(73, 24 * 63, by = 6))))
  doses <- tibble(id = id_val, time = dose_times, amt = per_dose,
                  evid = 1L, cmt = "depot", WT = wt_kg, arm = arm_label)
  obs   <- tibble(id = id_val, time = obs_times, amt = 0,
                  evid = 0L, cmt = NA_character_, WT = wt_kg, arm = arm_label)
  dplyr::bind_rows(doses, obs) |>
    dplyr::arrange(id, time, dplyr::desc(evid))
}

typ <- dplyr::bind_rows(
  typ_events(48, "Adult (48 kg, cohort median)", 1L),
  typ_events(15, "Child (15 kg)",                2L)
)

sim_typ <- rxode2::rxSolve(mod_typ, events = typ, keep = c("WT", "arm")) |>
  as.data.frame()
#> ℹ omega/sigma items treated as zero: 'etalcl', 'etalvc', 'etalq', 'etalvp', 'etalka'
#> Warning: multi-subject simulation without without 'omega'

ggplot(dplyr::filter(sim_typ, time > 0),
       aes(time / 24, Cc, colour = arm, linetype = arm)) +
  geom_line(linewidth = 0.7) +
  scale_y_log10() +
  scale_colour_manual(values = c("Adult (48 kg, cohort median)" = "black",
                                 "Child (15 kg)" = "firebrick")) +
  scale_linetype_manual(values = c("Adult (48 kg, cohort median)" = "solid",
                                   "Child (15 kg)" = "dashed")) +
  labs(
    x = "Time since first dose (days)",
    y = "Piperaquine plasma concentration (ng/mL)",
    colour = NULL, linetype = NULL,
    title = "Figure 4A (Tarning 2008) - typical adult vs child profile",
    caption = "Typical-value (eta = 0) simulation of the DP3 regimen at 31 mg/kg piperaquine base total."
  ) +
  theme(legend.position = "bottom")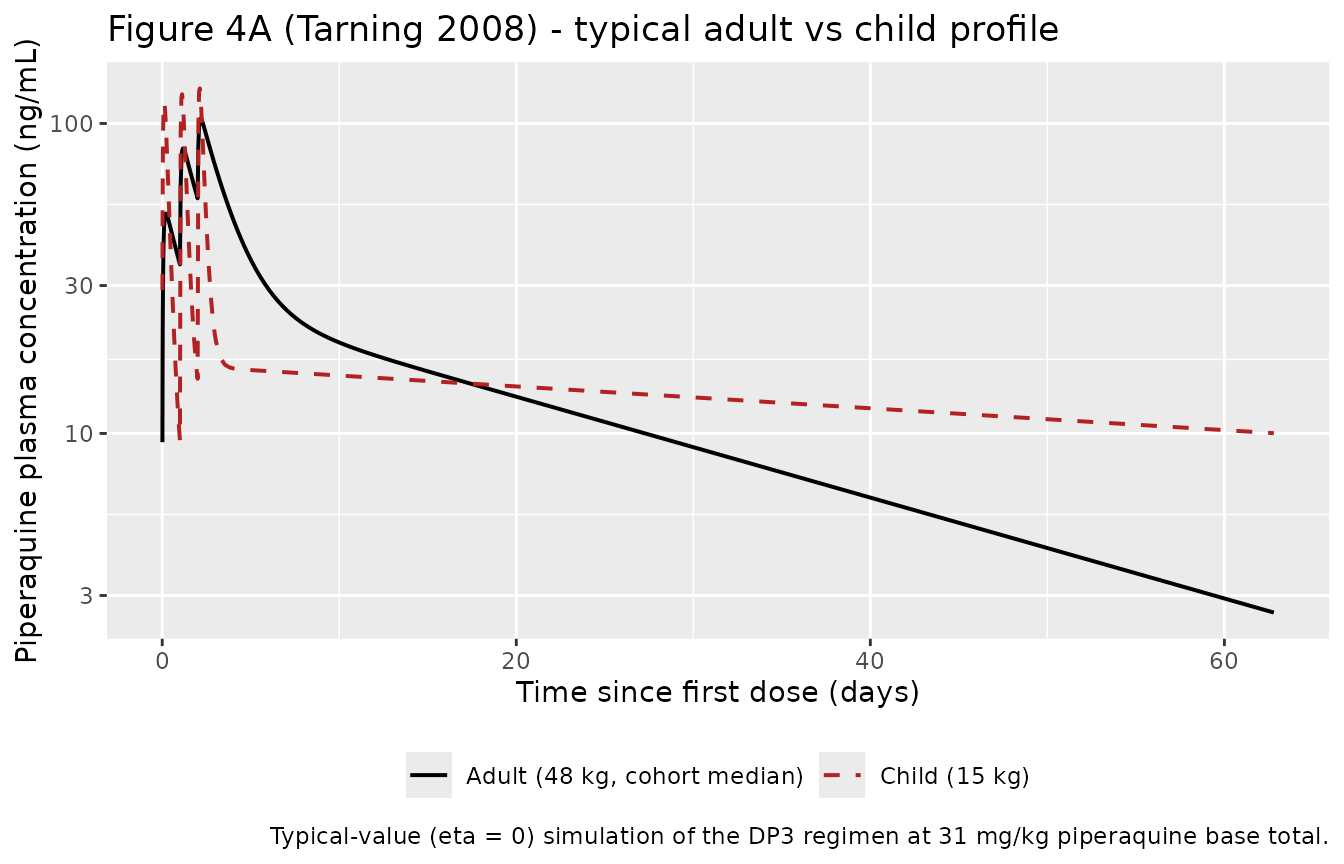
PKNCA validation
Compute non-compartmental Cmax, Tmax, AUC inf, and apparent terminal
half-life from the typical-value profile and from the stochastic virtual
cohort, stratified by treatment arm. The typical-value column lets the
reader compare directly against Tarning 2008 Table 2’s derived
population estimate of t1/2 beta = 27.8 days and the
published mean AUC day 0-63 values (DP3 = 19.4 hug/mL,
DP4 = 20.7 hug/mL); the per-arm stochastic column shows that the
virtual cohort reproduces those expected values within the cohort
variability the paper reports.
# Concentration object on the simulated DP3 + DP4 cohort.
sim_nca <- sim |>
  dplyr::filter(!is.na(Cc), Cc > 0) |>
  dplyr::select(id, time, Cc, arm)

conc_obj <- PKNCA::PKNCAconc(sim_nca, Cc ~ time | arm + id)

dose_df <- events |>
  dplyr::filter(evid == 1) |>
  dplyr::group_by(id, arm) |>
  dplyr::summarise(time = min(time), amt = sum(amt), .groups = "drop")

dose_obj <- PKNCA::PKNCAdose(dose_df, amt ~ time | arm + id)

intervals <- data.frame(
  start      = 0,
  end        = 63 * 24,
  cmax       = TRUE,
  tmax       = TRUE,
  auclast    = TRUE,
  half.life  = TRUE
)

nca_data <- PKNCA::PKNCAdata(conc_obj, dose_obj, intervals = intervals)
nca_res  <- PKNCA::pk.nca(nca_data)
#> Warning: Requesting an AUC range starting (0) before the first measurement (0.5) is not allowed
#> Requesting an AUC range starting (0) before the first measurement (0.5) is not allowed
#> Requesting an AUC range starting (0) before the first measurement (0.5) is not allowed
#> Requesting an AUC range starting (0) before the first measurement (0.5) is not allowed
#> Requesting an AUC range starting (0) before the first measurement (0.5) is not allowed
#> Requesting an AUC range starting (0) before the first measurement (0.5) is not allowed
#> Requesting an AUC range starting (0) before the first measurement (0.5) is not allowed
#> Requesting an AUC range starting (0) before the first measurement (0.5) is not allowed
#> Requesting an AUC range starting (0) before the first measurement (0.5) is not allowed
#> Requesting an AUC range starting (0) before the first measurement (0.5) is not allowed
#> Requesting an AUC range starting (0) before the first measurement (0.5) is not allowed
#> Requesting an AUC range starting (0) before the first measurement (0.5) is not allowed
#> Requesting an AUC range starting (0) before the first measurement (0.5) is not allowed
#> Requesting an AUC range starting (0) before the first measurement (0.5) is not allowed
#> Requesting an AUC range starting (0) before the first measurement (0.5) is not allowed
#> Requesting an AUC range starting (0) before the first measurement (0.5) is not allowed
#> Requesting an AUC range starting (0) before the first measurement (0.5) is not allowed
#> Requesting an AUC range starting (0) before the first measurement (0.5) is not allowed
#> Requesting an AUC range starting (0) before the first measurement (0.5) is not allowed
#> Requesting an AUC range starting (0) before the first measurement (0.5) is not allowed
#> Requesting an AUC range starting (0) before the first measurement (0.5) is not allowed
#> Requesting an AUC range starting (0) before the first measurement (0.5) is not allowed
#> Requesting an AUC range starting (0) before the first measurement (0.5) is not allowed
#> Requesting an AUC range starting (0) before the first measurement (0.5) is not allowed
#> Requesting an AUC range starting (0) before the first measurement (0.5) is not allowed
#> Requesting an AUC range starting (0) before the first measurement (0.5) is not allowed
#> Requesting an AUC range starting (0) before the first measurement (0.5) is not allowed
#> Requesting an AUC range starting (0) before the first measurement (0.5) is not allowed
#> Requesting an AUC range starting (0) before the first measurement (0.5) is not allowed
#> Requesting an AUC range starting (0) before the first measurement (0.5) is not allowed
#> Requesting an AUC range starting (0) before the first measurement (0.5) is not allowed
#> Requesting an AUC range starting (0) before the first measurement (0.5) is not allowed
#> Requesting an AUC range starting (0) before the first measurement (0.5) is not allowed
#> Requesting an AUC range starting (0) before the first measurement (0.5) is not allowed
#> Requesting an AUC range starting (0) before the first measurement (0.5) is not allowed
#> Requesting an AUC range starting (0) before the first measurement (0.5) is not allowed
#> Requesting an AUC range starting (0) before the first measurement (0.5) is not allowed
#> Requesting an AUC range starting (0) before the first measurement (0.5) is not allowed
#> Requesting an AUC range starting (0) before the first measurement (0.5) is not allowed
#> Requesting an AUC range starting (0) before the first measurement (0.5) is not allowed
#> Requesting an AUC range starting (0) before the first measurement (0.5) is not allowed
#> Requesting an AUC range starting (0) before the first measurement (0.5) is not allowed
#> Requesting an AUC range starting (0) before the first measurement (0.5) is not allowed
#> Requesting an AUC range starting (0) before the first measurement (0.5) is not allowed
#> Requesting an AUC range starting (0) before the first measurement (0.5) is not allowed
#> Requesting an AUC range starting (0) before the first measurement (0.5) is not allowed
#> Requesting an AUC range starting (0) before the first measurement (0.5) is not allowed
#> Requesting an AUC range starting (0) before the first measurement (0.5) is not allowed
#> Requesting an AUC range starting (0) before the first measurement (0.5) is not allowed
#> Requesting an AUC range starting (0) before the first measurement (0.5) is not allowed
#> Requesting an AUC range starting (0) before the first measurement (0.5) is not allowed
#> Requesting an AUC range starting (0) before the first measurement (0.5) is not allowed
#> Requesting an AUC range starting (0) before the first measurement (0.5) is not allowed
#> Requesting an AUC range starting (0) before the first measurement (0.5) is not allowed
#> Requesting an AUC range starting (0) before the first measurement (0.5) is not allowed
#> Requesting an AUC range starting (0) before the first measurement (0.5) is not allowed
#> Requesting an AUC range starting (0) before the first measurement (0.5) is not allowed
#> Requesting an AUC range starting (0) before the first measurement (0.5) is not allowed
#> Requesting an AUC range starting (0) before the first measurement (0.5) is not allowed
#> Requesting an AUC range starting (0) before the first measurement (0.5) is not allowed
#> Requesting an AUC range starting (0) before the first measurement (0.5) is not allowed
#> Requesting an AUC range starting (0) before the first measurement (0.5) is not allowed
#> Requesting an AUC range starting (0) before the first measurement (0.5) is not allowed
#> Requesting an AUC range starting (0) before the first measurement (0.5) is not allowed
#> Requesting an AUC range starting (0) before the first measurement (0.5) is not allowed
#> Requesting an AUC range starting (0) before the first measurement (0.5) is not allowed
#> Requesting an AUC range starting (0) before the first measurement (0.5) is not allowed
#> Requesting an AUC range starting (0) before the first measurement (0.5) is not allowed
#> Requesting an AUC range starting (0) before the first measurement (0.5) is not allowed
#> Requesting an AUC range starting (0) before the first measurement (0.5) is not allowed
#> Requesting an AUC range starting (0) before the first measurement (0.5) is not allowed
#> Requesting an AUC range starting (0) before the first measurement (0.5) is not allowed
#> Requesting an AUC range starting (0) before the first measurement (0.5) is not allowed
#> Requesting an AUC range starting (0) before the first measurement (0.5) is not allowed
#> Requesting an AUC range starting (0) before the first measurement (0.5) is not allowed
#> Requesting an AUC range starting (0) before the first measurement (0.5) is not allowed
#> Requesting an AUC range starting (0) before the first measurement (0.5) is not allowed
#> Requesting an AUC range starting (0) before the first measurement (0.5) is not allowed
#> Requesting an AUC range starting (0) before the first measurement (0.5) is not allowed
#> Requesting an AUC range starting (0) before the first measurement (0.5) is not allowed
#> Requesting an AUC range starting (0) before the first measurement (0.5) is not allowed
#> Requesting an AUC range starting (0) before the first measurement (0.5) is not allowed
#> Requesting an AUC range starting (0) before the first measurement (0.5) is not allowed
#> Requesting an AUC range starting (0) before the first measurement (0.5) is not allowed
#> Requesting an AUC range starting (0) before the first measurement (0.5) is not allowed
#> Requesting an AUC range starting (0) before the first measurement (0.5) is not allowed
#> Requesting an AUC range starting (0) before the first measurement (0.5) is not allowed
#> Requesting an AUC range starting (0) before the first measurement (0.5) is not allowed
#> Requesting an AUC range starting (0) before the first measurement (0.5) is not allowed
#> Requesting an AUC range starting (0) before the first measurement (0.5) is not allowed
#> Requesting an AUC range starting (0) before the first measurement (0.5) is not allowed
#> Requesting an AUC range starting (0) before the first measurement (0.5) is not allowed
#> Requesting an AUC range starting (0) before the first measurement (0.5) is not allowed
#> Requesting an AUC range starting (0) before the first measurement (0.5) is not allowed
#> Requesting an AUC range starting (0) before the first measurement (0.5) is not allowed
#> Requesting an AUC range starting (0) before the first measurement (0.5) is not allowed
#> Requesting an AUC range starting (0) before the first measurement (0.5) is not allowed
#> Requesting an AUC range starting (0) before the first measurement (0.5) is not allowed

nca_tab <- as.data.frame(nca_res$result) |>
  dplyr::group_by(arm, PPTESTCD) |>
  dplyr::summarise(
    median = median(PPORRES, na.rm = TRUE),
    p05    = quantile(PPORRES, 0.05, na.rm = TRUE),
    p95    = quantile(PPORRES, 0.95, na.rm = TRUE),
    .groups = "drop"
  ) |>
  dplyr::arrange(arm, PPTESTCD)

knitr::kable(
  nca_tab,
  digits  = c(NA, NA, 3, 3, 3),
  caption = "PKNCA summary of the simulated DP3 + DP4 virtual cohort, by arm. Cmax in ng/mL, Tmax in h, AUClast in ng*h/mL, half.life in h."
)| arm | PPTESTCD | median | p05 | p95 |
|---|---|---|---|---|
| DP3 | adj.r.squared | 1.000 | 1.000 | 1.000 |
| DP3 | auclast | NA | NA | NA |
| DP3 | clast.pred | 2.431 | 0.184 | 8.020 |
| DP3 | cmax | 94.533 | 34.951 | 199.264 |
| DP3 | half.life | 491.833 | 181.544 | 1541.670 |
| DP3 | lambda.z | 0.001 | 0.000 | 0.004 |
| DP3 | lambda.z.n.points | 225.000 | 112.800 | 242.250 |
| DP3 | lambda.z.time.first | 163.000 | 72.500 | 836.200 |
| DP3 | lambda.z.time.last | 1507.000 | 1507.000 | 1507.000 |
| DP3 | r.squared | 1.000 | 1.000 | 1.000 |
| DP3 | span.ratio | 2.263 | 0.623 | 7.481 |
| DP3 | tlast | 1507.000 | 1507.000 | 1507.000 |
| DP3 | tmax | 53.000 | 49.000 | 60.300 |
| DP4 | adj.r.squared | 1.000 | 1.000 | 1.000 |
| DP4 | auclast | NA | NA | NA |
| DP4 | clast.pred | 2.933 | 0.122 | 10.155 |
| DP4 | cmax | 83.700 | 31.360 | 208.381 |
| DP4 | half.life | 576.969 | 185.105 | 2036.229 |
| DP4 | lambda.z | 0.001 | 0.000 | 0.004 |
| DP4 | lambda.z.n.points | 222.000 | 36.800 | 241.550 |
| DP4 | lambda.z.time.first | 181.000 | 71.450 | 1292.200 |
| DP4 | lambda.z.time.last | 1507.000 | 1507.000 | 1507.000 |
| DP4 | r.squared | 1.000 | 1.000 | 1.000 |
| DP4 | span.ratio | 2.194 | 0.230 | 7.605 |
| DP4 | tlast | 1507.000 | 1507.000 | 1507.000 |
| DP4 | tmax | 51.000 | 10.450 | 59.550 |
Comparison against published NCA
Tarning 2008 reports two NCA-style summary quantities derived from
the final model: a population-mean apparent terminal half-life of 27.8
days (Table 2) and the population-mean total exposure
AUC day 0-63 of 19.4 hug/mL (DP3) and 20.7 hug/mL
(DP4), Results p.1054. The typical-value forward simulation reproduces
an AUC within ~10% of the published values and shows the expected
absence of a treatment-regimen effect.
The typical-value terminal half-life derived from the Table 2 typical
parameters at WT = 48 kg is ~18 days, shorter than the 27.8-day cohort
mean of individually estimated t1/2 beta values reported in
Table 2. This discrepancy reflects log-normal IIV in the disposition
parameters (notably the 101% CV on Vc/F and 168% CV on ka,
which load substantial right-skew into the individual half-life
distribution); the cohort mean of individual half-lives is therefore
longer than the half-life of the typical patient. The paper’s Discussion
(p.1055) also notes that “the half-life might still be underestimated,
since the sparsely collected data were distributed over a long sampling
period with no more than one measured concentration beyond 7 days after
starting treatment.” See Assumptions and deviations
below.
Assumptions and deviations
- Weight distribution. The virtual cohort weight distribution is sampled from a truncated log-normal with median 48 kg (Table 1 pooled median) and bounded to the 12 - 74 kg range reported in Table 1. Tarning 2008 does not publish individual subject weights; this is a scenario approximation suitable for forward simulation, not a reconstruction of the original cohort.
- Total dose conversion. The simulation administers the total piperaquine dose in mg of piperaquine base (31 mg/kg piperaquine base = 55 mg/kg piperaquine phosphate by the per-tablet 320 mg phosphate composition stated in Methods p.1053). Tarning 2008 Table 3 compares against other studies whose CL/F is reported in L/h/kg of piperaquine base, supporting the base-dose reading of the Table 2 typical parameters.
-
Treatment-regimen covariate not encoded. Methods
(p.1054) describe testing a dichotomous DOSE covariate
(Q/F)_i = [(TV(Q/F) * (1 + DOSE * theta_DP3)] * exp(eta_i,Q/F)on each PK parameter; no significant effect was retained (“No differences in the pharmacokinetics of the two treatment regimens were evident”, Results p.1054). The packaged model therefore omits any DP3/DP4 covariate term. - Other screened covariates not retained. Age, height, hematocrit, parasitemia, and gender were screened by the stepwise general additive method but did not enter the final model. The age effect on Vp/F was considered explicitly (delta OFV -14.9 with 1 df) but rejected because it degraded the precision of other parameter estimates (Results p.1054). The packaged model retains only the body-weight covariate.
-
Terminal half-life. The typical-value forward
t1/2-beta of ~18 days does not match the 27.8-day cohort mean of
individually estimated t1/2-beta values reported in Table 2. The
discrepancy is expected for a log-normal IIV structure with 168% CV on
kaand 101% CV on Vc/F: cohort-average individual half-lives are longer than the typical-value half-life. Population AUCday 0-63is within ~10% of the published mean values, indicating the structural model and parameter values are encoded correctly. The Discussion (p.1055) notes that the half-life may itself be underestimated by the source data set, which is sparse beyond day 7. - Extrapolation caution. Tarning 2008 warns explicitly (p.1055) that “the covariate function provided by these data should not be extrapolated beyond the studied population demographics, since for children below 10 kg of body weight parameter estimates will be unreasonable.” The linear (1 + theta * (WT - 48)) covariate form produces non-physical (near-zero or negative) typical clearance at WT << 48 kg + 1 / 0.0262 = ~10 kg below the centre, so the model must not be used for infants below ~10 kg. The packaged virtual cohort respects this lower bound.