Cotadutide (Bosch 2024)
Source:vignettes/articles/Bosch_2024_cotadutide_qsp.Rmd
Bosch_2024_cotadutide_qsp.RmdModel and source
- Citation: Bosch R, Petrone M, Arends R, Vicini P, Sijbrands EJG, Hoefman S, Snelder N (2024). Characterisation of cotadutide’s dual GLP-1/glucagon receptor agonistic effects on glycaemic control using an in vivo human glucose regulation quantitative systems pharmacology model. British Journal of Pharmacology 181(12):1874-1885. doi:10.1111/bph.16336. PMID: 38403793. Cotadutide PK structure fixed from Guan H et al. (2022), population pharmacokinetics of cotadutide (cited in Bosch 2024 Methods Section 2.3); 4GI system parameters fixed from Bosch R et al. (2022), the original 4GI model (cited in Bosch 2024 Methods Section 2.3).
- Description: QSP. 4GI quantitative systems pharmacology model (glucose, insulin, GLP-1, glucagon, GIP) coupled to a one-compartment first-order- absorption cotadutide PK model in adults with type 2 diabetes mellitus (Bosch 2024). Cotadutide is a dual GLP-1/glucagon receptor agonist; in vivo EC50s for cotadutide on each receptor are derived from the in vitro EC50 ratio vs the endogenous ligand (Eq 1). The drug’s free-fraction-corrected central concentration drives four saturable Emax effects on the system: (1) stimulation of glucose- dependent insulin secretion via GLP-1R, (2) inhibition of meal- glucose absorption via GLP-1R, (3) inhibition of glucagon production via GLP-1R, and (4) stimulation of glucose production via GCGR. A fifth Emax inhibits endogenous active GLP-1 production (Eq 3). The placebo arm’s lifestyle-change effect on fasting plasma glucose is modelled as an inverse Bateman attenuation of endogenous glucose production (Eq 2). Cotadutide PK structure and typical values are fixed from the upstream popPK analysis of Guan et al. 2022 (KA=0.343 1/h, CL=1.04 L/h, V=18.7 L). All 4GI system- specific disposition and effect parameters are fixed from the upstream 4GI model of Bosch et al. 2022; meal-effect, baseline, lifestyle and EMAX_5/EC50_5S parameters were re-estimated against the cotadutide MAD/Ph2a dataset (NCT02548585; n=51, T2DM). Five outputs: plasma glucose (mmol/L), insulin (pmol/L), GLP-1 (pmol/L), glucagon (pmol/L) and GIP (pmol/L), each with proportional residual error. Individual fasting plasma glucose enters via the FPG covariate; meal glucose enters as dosing events on the glucose-gut compartment. Defaults are T2DM; healthy-volunteer parameter set from Bosch 2022 is given in source-trace comments. No IIV is encoded (sequential model fit with individual PK / glucose- baseline inputs from Guan 2022 and the observed dataset).
- Article: https://doi.org/10.1111/bph.16336
- Supplement (model code, parameter tables, figures): published with
the article and on disk at
papers/PMID_38403793/supplements/
This model couples a one-compartment first-order-absorption cotadutide PK model (structure and typical values fixed from the upstream popPK of Guan et al. 2022) with the 4GI quantitative systems pharmacology model of glucose-insulin-GLP-1- glucagon-GIP dynamics (Bosch et al. 2022). Cotadutide is a dual GLP-1 / glucagon receptor agonist; its free-fraction-corrected central concentration drives four saturable Emax effects on the system (GLP-1R on insulin secretion, GLP-1R on meal-glucose absorption, GLP-1R on glucagon production, GCGR on glucose production) and a fifth Emax inhibits endogenous active GLP-1 production. A placebo-arm lifestyle-change effect attenuates endogenous glucose production via an inverse-Bateman time course (Eq 2 of the paper). All 4GI system-specific parameters are fixed at the Bosch 2022 values; re-estimated parameters in this paper are food-effect terms, glucose bioavailability / absorption for the MMTT meal, baseline insulin / GLP-1 / glucagon / GIP, the lifestyle-change amplitude and reduction rate, and the cotadutide / endogenous-GLP-1 in-vitro EC50 scaling factor.
Population
The Bosch 2024 PD analysis was fit to N = 45 overweight or obese T2DM adults who completed the cotadutide MAD/Ph2a study NCT02548585 (Ambery et al. 2018); 51 were randomised (25 cotadutide, 26 placebo) and 6 were excluded as outliers per Methods Section 2.4. The MAD part used five cohorts (A-E) with up-titrated SC daily doses to top doses of 100, 150, 200, 300 and 300 ug; the Ph2a part used a 200 ug top dose with 4-day 100 ug + 4-day 150 ug up-titration followed by 33 days at 200 ug (Bosch 2024 Table 1). Detailed demographics (age, weight, sex, race) for the analysis cohort are not reproduced in Bosch 2024 and are deferred to Ambery 2018; only the cohort sizes and dose / titration scheme are tabulated in Bosch 2024 Table 1.
Programmatic access to the population metadata:
str(mod_meta$population, max.level = 1)
#> List of 11
#>  $ species       : chr "human"
#>  $ n_subjects    : int 45
#>  $ n_studies     : int 1
#>  $ age_range     : chr NA
#>  $ weight_range  : chr NA
#>  $ sex_female_pct: num NA
#>  $ race_ethnicity: chr NA
#>  $ disease_state : chr "Overweight or obese adults with type 2 diabetes mellitus (NCT02548585; the MAD/Ph2a cotadutide study reported i"| __truncated__
#>  $ dose_range    : chr "Cotadutide 100-300 ug subcutaneous once daily before breakfast, with up-titration over 7-41 days depending on c"| __truncated__
#>  $ regions       : chr NA
#>  $ notes         : chr "Cohort sizes from Bosch 2024 Table 1; the paper does not tabulate detailed demographics (age / weight / sex / r"| __truncated__
Source trace
The per-parameter source-location comment is recorded in
inst/modeldb/specificDrugs/Bosch_2024_cotadutide_qsp.R. The
table below collects the key entries.
| Element | Value | Source location |
|---|---|---|
| Cotadutide ka | 0.343 1/h | Bosch 2024 supplement S12 $PK block default (Guan 2022
typical) |
| Cotadutide CL | 1.04 L/h | Bosch 2024 supplement S12 $PK block default (Guan 2022
typical) |
| Cotadutide V | 18.7 L | Bosch 2024 supplement S12 $PK block default (Guan 2022
typical) |
| Cotadutide fu | 0.0023 | Bosch 2024 Section 2.2; supplement fumedi = 0.0023
|
| CLglc T2DM | 1.72 L/h | Bosch 2024 supplement Table S1; THETA(1) |
| CLglci T2DM | 0.0256 (L/h)/(pmol/L) | Bosch 2024 supplement Table S1; THETA(2) |
| Qglc | 26.5 L/h | Bosch 2024 supplement Table S1; THETA(3) |
| VCglc | 9.33 L | Bosch 2024 supplement Table S1; THETA(4) |
| VPglc | 8.56 L | Bosch 2024 supplement Table S1; THETA(5) |
| Kaglc MMTT | 3.58 1/h | Bosch 2024 Table 3 (RSE 7.58%) |
| Fglc MMTT | 0.334 | Bosch 2024 Table 3 (RSE 8.89%) |
| Keglc | 0.281 1/h | Bosch 2024 supplement Table S1; THETA(8) |
| Kelglc | 1.93 1/h | Bosch 2024 supplement Table S1; THETA(9) |
| CLins | 73.2 L/h | Bosch 2024 supplement Table S1; THETA(10) |
| VCins | 6.09 L | Bosch 2024 supplement Table S1; THETA(11) |
| KE0ins | 0.853 1/h | Bosch 2024 supplement THETA(12); exp(-0.159) |
| VCglp | 16.0 L | Bosch 2024 supplement Table S1; THETA(13) |
| VM (GLP-1) | 2893 pmol/(L*h) | Bosch 2024 supplement THETA(14); exp(7.97) |
| KM (GLP-1) | 135 pmol/L | Bosch 2024 supplement THETA(15); exp(4.91) |
| CLglg | 453 L/h | Bosch 2024 supplement Table S1; THETA(16) |
| VCglg | 64.6 L | Bosch 2024 supplement Table S1; THETA(17) |
| CLgip | 86.8 L/h | Bosch 2024 supplement Table S1; THETA(18) |
| VCgip | 9.21 L | Bosch 2024 supplement Table S1; THETA(19) |
| Qgip | 49.4 L/h | Bosch 2024 supplement Table S1; THETA(20) |
| VPgip | 22.8 L | Bosch 2024 supplement Table S1; THETA(21) |
| FDGLP | 0.0150 1/mmol | Bosch 2024 Table 3 (RSE 23.2%) |
| FDGLP_2 | 0.113 1/mmol | Bosch 2024 Table 3 (RSE 25.7%) |
| FDGIP | 0.107 1/mmol | Bosch 2024 Table 3 (RSE 39.2%) |
| FDGLG | 0.0201 1/mmol | Bosch 2024 Table 3 (RSE 64.4%) |
| GLCINS_S | 2.46 1/mM | Bosch 2024 supplement Table S2 |
| GLCGLG_POWH | 0.925 | Bosch 2024 supplement Table S2 (T2DM high-glc branch) |
| EMAX_1 | 10.7 | Bosch 2024 supplement Table S2 |
| EC50_1 | 26.6 pmol/L | Bosch 2024 supplement Table S2 |
| HILL_1 | 1.79 | Bosch 2024 supplement Table S2 |
| EMAX_2 | 1 (FIXED) | Bosch 2024 supplement Table S2 |
| EC50_2 | 144 pmol/L | Bosch 2024 supplement Table S2 |
| HILL_2 | 1 (FIXED) | Bosch 2024 supplement Table S2 |
| EMAX_3 | 1 (FIXED) | Bosch 2024 supplement Table S2 |
| EC50_3 | 99.5 pmol/L | Bosch 2024 supplement Table S2 |
| HILL_3 | 1 (FIXED) | Bosch 2024 supplement Table S2 |
| EMAX_4 | 6.73 | Bosch 2024 supplement Table S2 |
| EC50_4 | 98.5 pmol/L | Bosch 2024 supplement Table S2 |
| HILL_4 | 1 (FIXED) | Bosch 2024 supplement Table S2 |
| EMAX_5 | 0.321 | Bosch 2024 Table 3 (RSE 25.7%) |
| EC50_5S | 10.9 | Bosch 2024 Table 3 (RSE 37.9%) |
| HILL_5 | 5 (FIXED) | Bosch 2024 Section 3.1 |
| POW_4 | 0.109 | Bosch 2024 supplement Table S2 |
| ECmGLP | 0.076 pmol/L | Bosch 2024 Table 2 (free cotadutide on GLP-1R) |
| ECmGLG | 0.088 pmol/L | Bosch 2024 Table 2 (free cotadutide on GCGR) |
| ECGLP (endogenous) | 1.92 pmol/L | Bosch 2024 Table 2 (endogenous GLP-1) |
| ECGLG (endogenous) | 1.54 pmol/L | Bosch 2024 Table 2 (endogenous glucagon) |
| LSCI | 0.566 | Bosch 2024 Table 3 (RSE 13.1%) |
| Klsc | 10 1/day (FIXED) | Bosch 2024 Section 3.1 |
| Kred | 0.0164 1/day | Bosch 2024 Table 3 (RSE 55.0%); Section 3.1 confirms 1/day units |
| BSLins | 138 pmol/L | Bosch 2024 Table 3 (RSE 8.44%) |
| BSLglp | 18.0 pmol/L | Bosch 2024 Table 3 (RSE 6.53%) |
| BSLglg | 49.1 pmol/L | Bosch 2024 Table 3 (RSE 11.5%) |
| BSLgip | 19.8 pmol/L | Bosch 2024 Table 3 (RSE 18.7%) |
| Eq 1 in-vivo EC50 derivation | ECdrug = ECdrug_invitro / ECendog_invitro * ECendog_invivo | Bosch 2024 Methods Section 2.3 Eq 1 |
| Eq 2 lifestyle attenuation | LSCeff = 1 - LSCI * Klsc * (exp(-Klsc * t_d) - exp(-Kred * t_d)) / (Kred - Klsc) | Bosch 2024 Methods Section 2.5 Eq 2 |
| Eq 3 cotadutide on endog. GLP-1 | EMAX_5 * (Cmedif/EC50_5)^HILL_5 / (1 + (Cmedif/EC50_5)^HILL_5) | Bosch 2024 Methods Section 2.5 Eq 3 |
| ODE system | 15-state QSP | Bosch 2024 supplement S12 $DES block |
| sigma^2 glucose | 0.0393 | Bosch 2024 Table 3 (RSE 8.72%) |
| sigma^2 insulin | 0.647 | Bosch 2024 Table 3 (RSE 14.1%) |
| sigma^2 GLP-1 | 0.358 | Bosch 2024 Table 3 (RSE 27.5%) |
| sigma^2 glucagon | 0.401 | Bosch 2024 Table 3 (RSE 27.7%) |
| sigma^2 GIP | 0.658 | Bosch 2024 Table 3 (RSE 10.5%) |
Cotadutide molecular weight (4549 g/mol, the peptide MEDI0382) is used in the simulation chunks below to convert microgram doses to picomole doses (the internal unit of the depot compartment).
Simulation set-up
This is an endogenous/mechanistic QSP model with five outputs and no
parent- drug observation in this paper. PKNCA-style cmax / AUC
validation is therefore not applied (see
references/endogenous-validation.md in the skill). Instead
the vignette uses the four endogenous-model validation patterns plus a
replication of Bosch 2024 Figure 4 (cotadutide dose-response on average
glucose) and a representative MMTT excursion at 200 ug cotadutide (the
Ph2a top dose).
The model takes one covariate, FPG (per-subject baseline
glucose in mmol/L). Cotadutide doses go to the depot
compartment in pmol; MMTT meal doses go to the glucose_gut
compartment in mmol of glucose. The supplement does not report the
carbohydrate content of the Ensure Plus(R) MMTT meal in grams, so the
simulations use 50 g (= 278 mmol) of glucose – a representative value
for a single 8 fl oz bottle of Ensure Plus(R) – and document the
assumption in the Assumptions and deviations section.
mod <- readModelDb("Bosch_2024_cotadutide_qsp")
MW_cota_g_per_mol <- 4549                                              # cotadutide MEDI0382 MW
MW_glucose_g_per_mol <- 180.16                                         # glucose MW
amt_pmol_per_ug   <- 1e6 / MW_cota_g_per_mol                           # ~ 219.83 pmol per ug cotadutide
amt_mmol_per_g    <- 1000 / MW_glucose_g_per_mol                       # ~ 5.55 mmol per g glucose
typical_FPG_mmol  <- 7.67                                              # supplement THETA(64) typical baseline
mmtt_amt_mmol     <- 50 * amt_mmol_per_g                               # 50 g glucose -> ~ 278 mmol
Validation 1: initial conditions match the published baselines
With no cotadutide on board, no MMTT meal, the endogenous species should start at their published baseline values. (The placebo-arm lifestyle effect attenuates endogenous glucose production for t > 0, so a 24-hour steady-state hold is not appropriate – see Validation 2 for the placebo lifestyle dynamics.)
ev_ic <- rxode2::et(time = c(0, 0.001), cmt = "Cglc")   # essentially t = 0
ev_ic$FPG <- typical_FPG_mmol

sim_ic <- rxode2::rxSolve(rxode2::zeroRe(mod), events = ev_ic) |>
  as.data.frame()
#> Warning: No omega parameters in the model

knitr::kable(
  sim_ic[1, c("time", "Cglc", "Cins", "Cglp", "Cglg", "Cgip")],
  digits = 3,
  caption = "Initial conditions at t = 0 match the published baselines (Cglc = FPG covariate; Cins / Cglp / Cglg / Cgip = Bosch 2024 Table 3 typical values)."
)| time | Cglc | Cins | Cglp | Cglg | Cgip |
|---|---|---|---|---|---|
| 0 | 7.67 | 138 | 18 | 49.1 | 19.8 |
Validation 2: placebo arm with lifestyle effect
With LSCI restored, the placebo arm (no cotadutide) should show the rapid drop in fasting plasma glucose followed by slow recovery towards baseline that Bosch 2024 describes in Section 3.1 and Figure S9.
ev_pl <- rxode2::et(time = seq(0, 24 * 60, by = 6), cmt = "Cglc")  # 60 days, every 6 h
ev_pl$FPG <- typical_FPG_mmol

sim_pl <- rxode2::rxSolve(mod %>% rxode2::zeroRe(), events = ev_pl) |>
  as.data.frame()
#> Warning: No omega parameters in the model

ggplot(sim_pl, aes(time / 24, Cglc)) +
  geom_line(colour = "steelblue") +
  labs(x = "Time (days)", y = "Fasting plasma glucose (mmol/L)",
       title = "Placebo arm lifestyle effect on FPG",
       caption = "Reproduces qualitative behaviour of Bosch 2024 Figure S9 placebo panels.")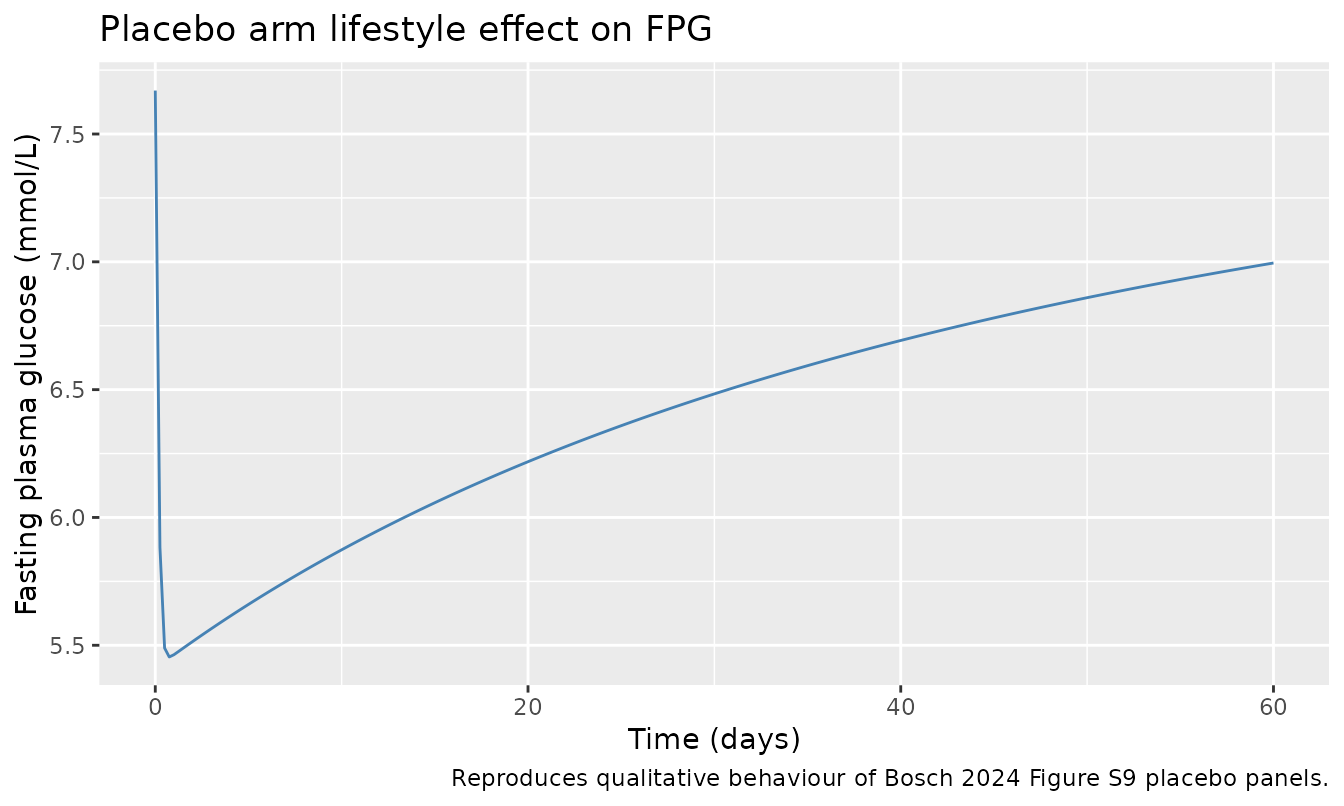
min_fpg <- min(sim_pl$Cglc)
end_fpg <- tail(sim_pl$Cglc, 1)
cat(sprintf("Placebo FPG nadir: %.2f mmol/L (%.0f%% of baseline)\n",
            min_fpg, 100 * min_fpg / typical_FPG_mmol))
#> Placebo FPG nadir: 5.45 mmol/L (71% of baseline)
cat(sprintf("Placebo FPG at day 60: %.2f mmol/L (%.0f%% of baseline)\n",
            end_fpg, 100 * end_fpg / typical_FPG_mmol))
#> Placebo FPG at day 60: 7.00 mmol/L (91% of baseline)
Bosch 2024 Section 3.1 reports the lifestyle effect’s amplitude (LSCI = 0.566) implies the endogenous glucose production drops to (1 - 0.566) = 43.4% of baseline at the peak attenuation, and the reduction rate (Kred = 0.0164 1/day) implies a 45-day half-life of recovery. The simulated FPG nadir and recovery trajectory should be in qualitative agreement with that description.
Validation 3: MMTT excursion – 200 ug cotadutide (Ph2a top dose)
This figure block replicates the qualitative shape of Bosch 2024 Figure 2 for the 200 ug cotadutide arm: pre-MMTT glucose at baseline, post-MMTT glucose excursion truncated relative to placebo by GLP-1-driven slowing of glucose absorption and stimulation of insulin secretion, post-MMTT GLP-1 suppressed relative to placebo by the cotadutide self-inhibition effect (EMAX_5), and post-MMTT glucagon reduced relative to placebo by the GLP-1R inhibition of glucagon production.
The MAD/Ph2a Ph2a arm dosed cotadutide once daily for ~41 days; this simulation pre-doses to day 41 and shows the day-41 MMTT excursion, taken 2 h after the day-41 cotadutide dose per the study design.
# Pre-treat for 14 days so cotadutide reaches steady-state plasma levels
# (kel = CL / V = 0.0556 / h gives t1/2 ~= 12.5 h and ~5-day approach to SS);
# the Ph2a study used a 41-day MMTT day but the post-MMTT excursion shape at
# steady-state cotadutide does not require simulating that full window.
n_days_pretreat   <- 14
dose_pmol_200ug   <- 200 * amt_pmol_per_ug
mmtt_time_h       <- n_days_pretreat * 24 + 2          # MMTT 2 h after the day-14 SC dose
obs_times_h       <- mmtt_time_h + seq(-1, 4, by = 0.1)

ev_cota <- rxode2::et(time = 24 * seq(0, n_days_pretreat),
                      amt = dose_pmol_200ug, cmt = "depot") |>
  rxode2::et(time = mmtt_time_h, amt = mmtt_amt_mmol, cmt = "glucose_gut") |>
  rxode2::et(time = obs_times_h, cmt = "Cglc")
ev_cota$FPG <- typical_FPG_mmol

ev_pl_mmtt <- rxode2::et(time = mmtt_time_h, amt = mmtt_amt_mmol,
                         cmt = "glucose_gut") |>
  rxode2::et(time = obs_times_h, cmt = "Cglc")
ev_pl_mmtt$FPG <- typical_FPG_mmol

sim_cota <- rxode2::rxSolve(mod %>% rxode2::zeroRe(), events = ev_cota) |>
  as.data.frame() |>
  dplyr::mutate(arm = "Cotadutide 200 ug")
#> Warning: No omega parameters in the model

sim_pl_mmtt <- rxode2::rxSolve(mod %>% rxode2::zeroRe(), events = ev_pl_mmtt) |>
  as.data.frame() |>
  dplyr::mutate(arm = "Placebo")
#> Warning: No omega parameters in the model

cmp <- dplyr::bind_rows(sim_cota, sim_pl_mmtt) |>
  dplyr::mutate(t_post_mmtt_h = time - mmtt_time_h) |>
  dplyr::filter(t_post_mmtt_h >= 0, t_post_mmtt_h <= 4)

cmp_long <- cmp |>
  dplyr::select(arm, t_post_mmtt_h, Cglc, Cins, Cglp, Cglg, Cgip) |>
  tidyr::pivot_longer(c(Cglc, Cins, Cglp, Cglg, Cgip),
                      names_to = "analyte", values_to = "conc")

cmp_long$analyte <- factor(
  cmp_long$analyte,
  levels = c("Cglc", "Cins", "Cglp", "Cglg", "Cgip"),
  labels = c("Glucose (mmol/L)", "Insulin (pmol/L)", "GLP-1 (pmol/L)",
             "Glucagon (pmol/L)", "GIP (pmol/L)")
)

ggplot(cmp_long, aes(t_post_mmtt_h, conc, colour = arm)) +
  geom_line() +
  facet_wrap(~ analyte, scales = "free_y") +
  labs(x = "Time post-MMTT (h)", y = NULL,
       title = "MMTT excursion -- 200 ug cotadutide vs placebo",
       caption = "Reproduces the qualitative shape of Bosch 2024 Figure 2 / Figure S2.") +
  theme(legend.position = "bottom")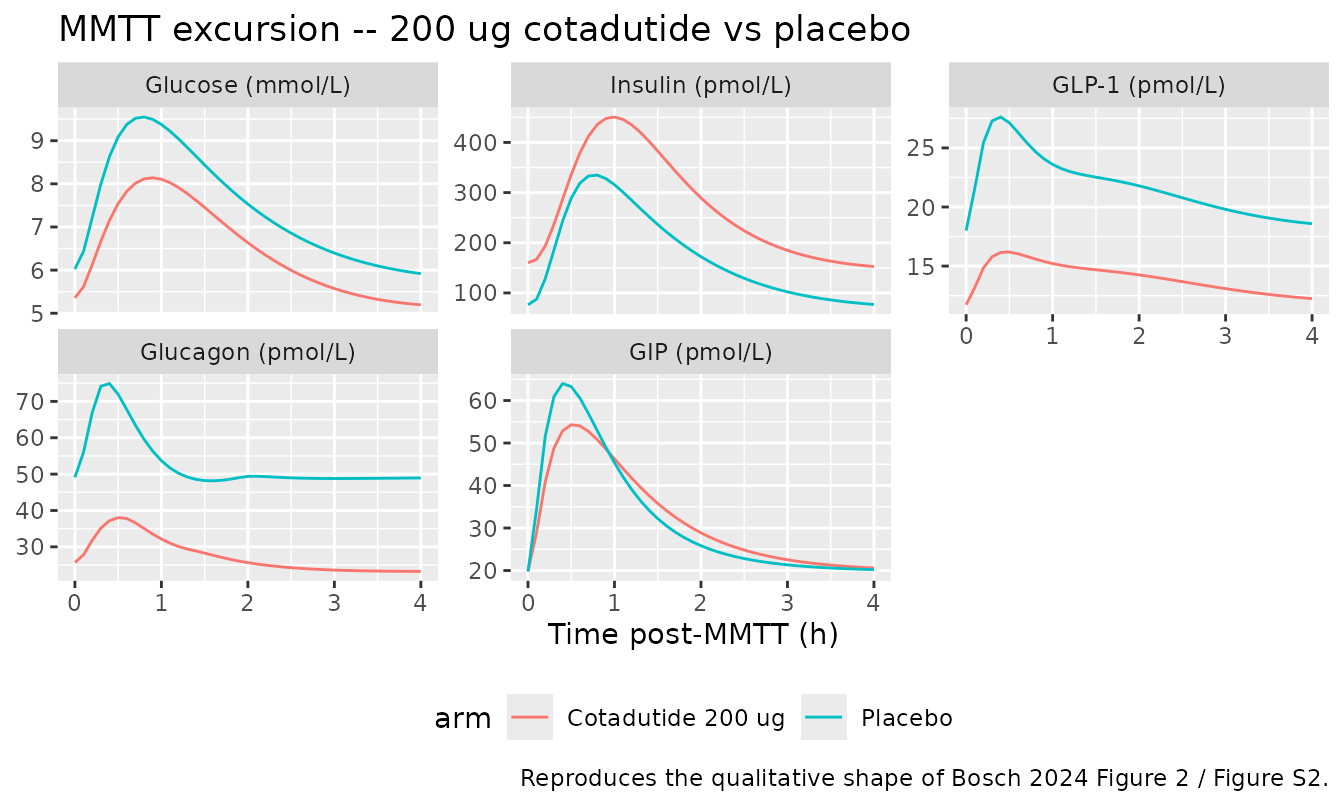
Validation 4: Figure 4 dose-response on weekly average glucose
Bosch 2024 Figure 4a shows the percent change in average glucose at week 6 of dosing as a function of cotadutide dose level, simulated under both “dual GLP-1 / glucagon” (full model) and “GLP-1 only” (knock out the GCGR arm) assumptions. The full model plateaus at ~ 200 ug whereas the GLP-1-only counterfactual continues to decrease, because the glucagon-on-glucose- production arm counteracts the GLP-1 effect at higher doses.
This block replicates the percent-glucose-change-vs-dose curve from
the full model. The GLP-1-only counterfactual can be obtained by zeroing
the cotadutide contribution at the GCGR (set ecmglg
extremely large so Cmedif / ecglg1 approaches zero).
# Simulate steady-state average daily glucose for a panel of cotadutide doses
# under (a) the full dual GLP-1 / glucagon agonism model and (b) a GLP-1-only
# counterfactual (cotadutide effect at the GCGR knocked out by setting the in
# vitro GCGR EC50 ECmGLG very large so the in-vivo cotadutide EC50 there
# becomes effectively infinite). To keep the render time bounded the lifestyle
# effect is disabled (LSCI -> ~ 0) so the simulation reaches a clean
# pharmacological steady state in ~ 14 days regardless of dose; see
# Validation 2 for the lifestyle dynamics themselves.
dose_levels_ug <- c(0, 50, 100, 150, 200, 300)
mod_no_lsc     <- suppressMessages(rxode2::ini(mod, llsci = log(1e-12)))
mod_no_lsc_glp <- suppressMessages(rxode2::ini(mod_no_lsc, lecmglg = log(1e8)))

simulate_avg_glucose <- function(model, dose_ug) {
  n_days <- 14
  dose_pmol <- dose_ug * amt_pmol_per_ug
  ev <- if (dose_pmol > 0) {
    rxode2::et(time = 24 * seq(0, n_days),
               amt = dose_pmol, cmt = "depot")
  } else {
    rxode2::et(time = 0, amt = 0, cmt = "depot")
  }
  meal_amt_mmol  <- 50 * amt_mmol_per_g
  meal_h_per_day <- c(8, 13, 18)
  meal_times     <- as.numeric(outer(meal_h_per_day,
                                     24 * seq(0, n_days - 1), "+"))
  ev <- rxode2::et(ev, time = meal_times,
                   amt = meal_amt_mmol, cmt = "glucose_gut")
  ev <- rxode2::et(ev, time = seq(24 * (n_days - 1), 24 * n_days, by = 1),
                   cmt = "Cglc")
  ev$FPG <- typical_FPG_mmol
  s <- rxode2::rxSolve(rxode2::zeroRe(model), events = ev) |>
    as.data.frame()
  s <- s[s$time >= 24 * (n_days - 1), ]
  mean(s$Cglc, na.rm = TRUE)
}

baseline_glc <- simulate_avg_glucose(mod_no_lsc, 0)
#> Warning: No omega parameters in the model
dr <- dplyr::tibble(
  dose_ug = dose_levels_ug,
  avg_glc_full = vapply(dose_levels_ug, simulate_avg_glucose,
                        numeric(1), model = mod_no_lsc),
  avg_glc_glponly = vapply(dose_levels_ug, simulate_avg_glucose,
                           numeric(1), model = mod_no_lsc_glp)
) |>
  dplyr::mutate(
    pct_full    = 100 * (avg_glc_full    - baseline_glc) / baseline_glc,
    pct_glponly = 100 * (avg_glc_glponly - baseline_glc) / baseline_glc
  )
#> Warning: No omega parameters in the model
#> No omega parameters in the model
#> No omega parameters in the model
#> No omega parameters in the model
#> No omega parameters in the model
#> No omega parameters in the model
#> No omega parameters in the model
#> No omega parameters in the model
#> No omega parameters in the model
#> No omega parameters in the model
#> No omega parameters in the model
#> No omega parameters in the model

knitr::kable(
  dr |> dplyr::select(dose_ug, avg_glc_full, pct_full,
                      avg_glc_glponly, pct_glponly),
  digits = 2,
  col.names = c("Dose (ug)", "Avg glucose (mmol/L) -- full model",
                "% change vs baseline -- full",
                "Avg glucose (mmol/L) -- GLP-1 only",
                "% change vs baseline -- GLP-1 only"),
  caption = "Replicates Bosch 2024 Figure 4a (weekly average glucose vs cotadutide dose, dual GLP-1/glucagon agonism vs GLP-1-only counterfactual)."
)| Dose (ug) | Avg glucose (mmol/L) – full model | % change vs baseline – full | Avg glucose (mmol/L) – GLP-1 only | % change vs baseline – GLP-1 only |
|---|---|---|---|---|
| 0 | 7.83 | 0.00 | 7.83 | 0.00 |
| 50 | 7.28 | -7.05 | 6.96 | -11.19 |
| 100 | 6.89 | -11.98 | 6.32 | -19.28 |
| 150 | 6.80 | -13.13 | 6.01 | -23.25 |
| 200 | 6.82 | -12.91 | 5.83 | -25.51 |
| 300 | 6.93 | -11.50 | 5.62 | -28.20 |
dr_long <- dr |>
  dplyr::select(dose_ug, pct_full, pct_glponly) |>
  tidyr::pivot_longer(c(pct_full, pct_glponly),
                      names_to = "agonism", values_to = "pct_change") |>
  dplyr::mutate(agonism = dplyr::recode(agonism,
                                        pct_full    = "Dual GLP-1 / glucagon",
                                        pct_glponly = "GLP-1 only"))

ggplot(dr_long, aes(dose_ug, pct_change, colour = agonism)) +
  geom_line() +
  geom_point() +
  labs(x = "Cotadutide dose (ug)", y = "% change average glucose vs baseline",
       title = "Figure 4a -- cotadutide dose-response on average glucose",
       caption = "Replicates Bosch 2024 Figure 4a.") +
  theme(legend.position = "bottom")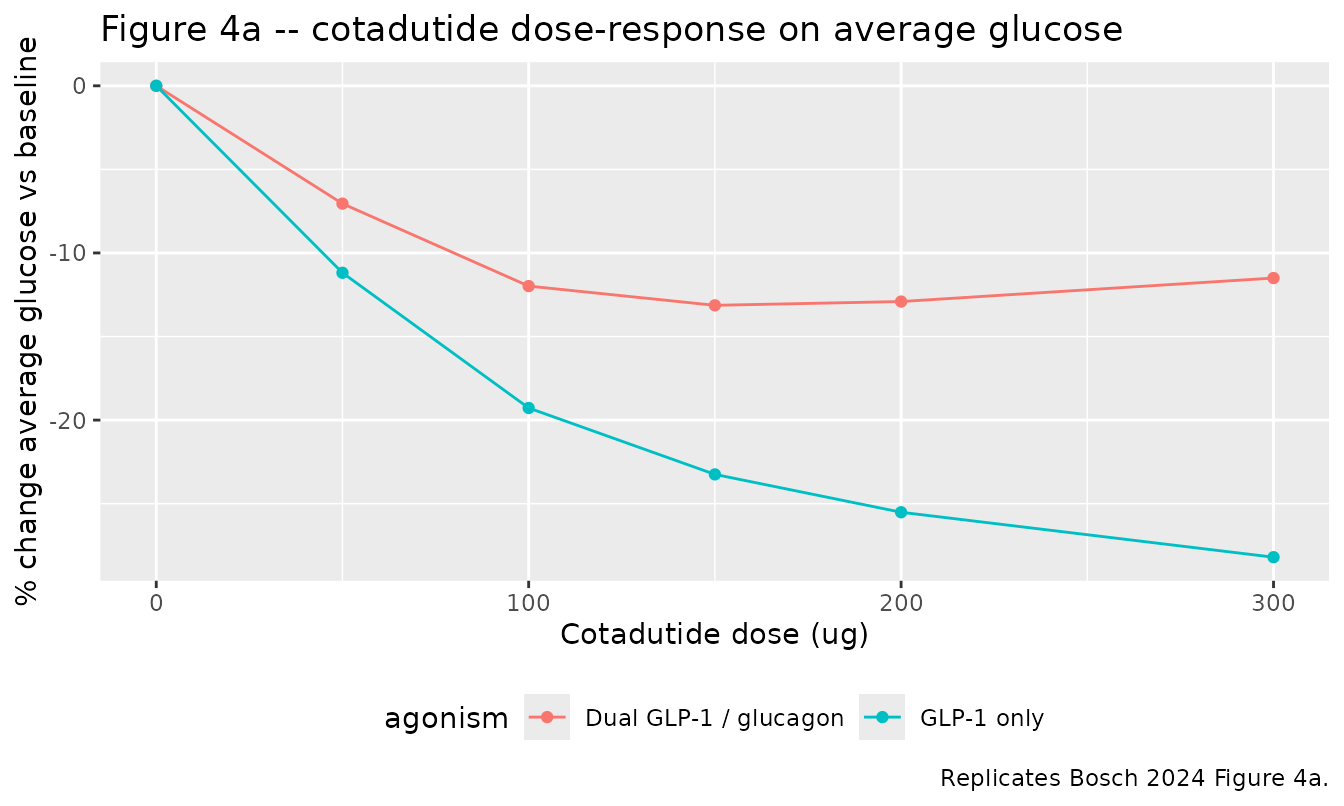
The dual-agonism curve should plateau around ~200 ug cotadutide whereas the GLP-1-only counterfactual should continue to decrease. The exact percent change values are sensitive to the assumed meal pattern (number, timing and carbohydrate content of standard meals per day), and Bosch 2024 does not specify the carbohydrate content of the standard meals used in the Figure 4 simulation; the table above uses 50 g per meal three times daily and documents this assumption in the Assumptions and deviations section.
Assumptions and deviations
- MMTT carbohydrate content (50 g per meal). Bosch 2024 Methods Section 2.5 states “the carbohydrate content of the MMTT meal was extracted from the ingredients list and imputed as the meal-dose amount” but does not give the numeric value. The simulations above use 50 g glucose per MMTT bottle (Ensure Plus(R) 8 fl oz typical carbohydrate label value) and 50 g glucose per standard meal in Validation 4. The qualitative dose-response shape (plateau at ~200 ug for dual agonism, continued decrease for GLP-1- only) is robust to the meal-size assumption; absolute percent-change values are not.
- Cotadutide molecular weight (4549 g/mol). Used to convert microgram doses to picomole doses for the depot compartment. The MEDI0382 sequence is published in Henderson 2016 (cited in Bosch 2024); the MW is not reproduced in Bosch 2024 itself.
- No IIV encoded. Bosch 2024 fits the model as a sequential PD analysis where individual cotadutide PK profiles are pre-computed from the empirical Bayes estimates (CL, VC, KA) of the upstream Guan 2022 popPK model, and individual glucose baselines are taken from the observed data. The published Bosch 2024 Table 3 reports only fixed-effect typical values and proportional residual errors; no random-effect variance components are tabulated. The supplement S12 mrgSolve code contains a single active eta on insulin-dependent glucose clearance CLglci, but the omega value is not reported in the on-disk paper or supplement, so it is not encoded here.
-
Healthy-volunteer parameter set not encoded. The
supplement S12 code includes a
PAT == 1branch with healthy-volunteer values for CLglc (5.36 L/h), CLglci (0.072 (L/h)/(pmol/L)), POW_2L (0.327), POW_3 (0.286) and GIPINS (1) used in the Bosch 2022 development cohort. The Bosch 2024 MAD/Ph2a cohort is entirely T2DM so this packaged model uses the T2DM defaults; the HV alternatives appear in source-trace comments in the model file so a user simulating a healthy-volunteer counterfactual can modify the relevantini()lines. -
T2DM hypoglycaemic-glucagon counter-regulation
absent. Bosch 2022 Table S2 and the supplement S12 code switch
the glucose-on-glucagon feedback exponent to 0 when plasma glucose falls
below baseline in T2DM patients (no hypoglycaemic glucagon
counter-regulation); this is implemented in
model()asglcglg_pow_eff <- glcglg_powh * (Cglc >= bslglc). -
GIP-on-insulin effect absent in T2DM. The
supplement S12 code fixes GIPINS (the GIP-on-insulin scaler) and POW_3
(the corresponding power exponent) at 0 for T2DM patients; the model
file hard-codes
gipins_s <- 0/gipins_s0 <- 0accordingly. The HV alternative (GIPINS = 1, POW_3 = 0.286) is documented in the model file’s ini() comment forlpow_4. -
Eq 2 lifestyle effect denominator sign. The
published Eq 2 in Bosch 2024 Methods Section 2.5 has
(Kred - Klsc)in the denominator; with Kred = 0.0164 and Klsc = 10 the denominator is large negative. The formula reproduces the expected behaviour (FPG drops then slowly recovers); see Validation 2. -
Lifestyle-rate units. Bosch 2024 Table 3 lists Klsc
and Kred with the column header
(h-1)but the paper text in Section 3.1 reports Kred = 0.0164 d^-1 with half-life 45 days; the supplement S12 code converts simulation time to days inside the lifestyle-effect formula (TIMEd = T / 24). The model file uses 1/day for Klsc and Kred and converts internally, matching the supplement code. -
Upstream PK and 4GI sources not on disk. The
cotadutide PK structure and individual EBE inputs are fixed from Guan et
al. 2022 (cited in Bosch 2024 Methods Section 2.3) which is not on disk
in this worktree; the typical values (KA = 0.343 1/h, CL = 1.04 L/h, V =
18.7 L) are taken from the on-disk supplement S12
$PKblock defaults. The 4GI system parameters are fixed from Bosch et al. 2022 (also cited in Bosch 2024 Methods Section 2.3) which is not on disk in this worktree; the numeric values are taken from the on-disk supplement Tables S1 and S2 and the supplement S12$THETAblock.