Naltrexone+bupropion (Sharma 2018)
Source:vignettes/articles/Sharma_2018_naltrexone_bupropion.Rmd
Sharma_2018_naltrexone_bupropion.RmdModel and source
- Citation: Sharma VD, Combes FP, Vakilynejad M, Lahu G, Lesko LJ, Trame MN. Model-Based Approach to Predict Adherence to Protocol During Antiobesity Trials. The Journal of Clinical Pharmacology 2018;58(2):240-253.
- Article: https://doi.org/10.1002/jcph.994 (open access; Wiley)
Sharma 2018 develops a population pharmacodynamic (PopPD) body-weight model linked downstream to a 3-state (responder / nonresponder / dropout) Markov clinical-trial-adherence model, pooled across 4591 obese / overweight subjects from six Contrave (naltrexone + bupropion fixed-dose combination) registration trials. The PopPD layer comes in two non-hierarchical variants: a dose- and time-dependent (DTPD) model in which the drug effect is driven by the daily naltrexone and bupropion doses, and a pharmacokinetic-parameter-and-data-driven (PPPD) model in which the drug effect is driven by simulated naltrexone and bupropion plasma concentration-vs-time profiles from a previously developed (and unpublished) Takeda internal PopPK model.
The packaged nlmixr2lib model is the DTPD variant only. The PPPD variant depends on an internal Takeda PopPK report (dated February 9, 2010) that is neither published nor included in the paper’s online supplement, and the structural absorption / disposition parameters required to generate naltrexone and bupropion concentration profiles are absent from every on-disk source – per nlmixr2lib provenance discipline (no training-data substitution for non-public PopPK parameters), the PPPD variant is not extractable. The Markov adherence layer (Sharma 2018 Eq. 8, Table 3) sits one level downstream of the PopPD model and is also out of scope here; it can be reconstructed by a future extension using the predicted body-weight change from this model as the driver.
The DTPD PopPD model is an indirect-response model for body weight with three structural ingredients:
- a baseline body weight that drifts linearly with age via a
disease-progression rate constant
kpro(Eq. 1, NHANES literature value fixed at 0.7 kg/year for non-diabetic adults; estimated as 2.7 kg/year for the type-2 diabetic obese subpopulation);
- a coupled indirect-response with zero-order body-weight production
kin = kout * BW_DP(t)(Eq. 2) and first-order body-weight losskout, with the loss rate transiently stimulated by lifestyle intervention (LSI) via an inverse-Bateman function bounded by a maximal fractional increaseDSTIM(race-stratified) and shaped by an onset ratekreland dissipation ratekde;
- a combined-Emax dose- and time-dependent inhibitory drug effect subtracted from the LSI-modulated body-weight trajectory:
where NAL and BUP are the daily naltrexone and bupropion doses
(mg/day). The time-Hill factor t / (t + ET50) ramps the
drug effect from zero at study entry to its dose-determined plateau over
several weeks. The combined Emax (not separate
Emax,NAL and Emax,BUP) was the best-fit form
of all the structural alternatives tested in Sharma 2018 (Results
“Population Dose- and Time-Dependent Pharmacodynamic Model”).
Covariates retained in the final DTPD model are diabetes
mellitus (DIS_DIAB) as a fixed covariate on Emax,
kout, kpro, and baseline body weight, and
race as a covariate on DSTIM (White and
Asian merged as the reference because of the small Asian subgroup, n =
49; Black and a paper-pooled “Other” category as separate indicators).
Inter-individual variability is on all parameters except
kde and kpro (per Sharma 2018 Results: “no IIV
was tested statistically significant on these parameters”). Residual
error is additive on body weight (1.35 kg).
The nlmixr2lib encoding is in
inst/modeldb/specificDrugs/Sharma_2018_naltrexone_bupropion.R.
Population
Sharma 2018 pooled 4591 obese / overweight adults from six Contrave registration trials (OT-101, NB-201, NB-301, NB-302, NB-303, NB-304) with 21,488 observed body-weight measurements over 20-65 weeks per subject (Sharma 2018 Results “Study Design”, Table 1). The study population is predominantly female (82.6%; 3794 of 4591), with median age 46 years (SD 11.3) and median baseline body weight 99 kg (SD 15.8). Race distribution at the pooled cohort level was White 77.2%, Black 18.5%, Asian 1.1%, and a paper-pooled “Other” 3.3% (combining Pacific Islander / Native Hawaiian / Native American / Alaska Native / “Other” subgroups that were too small individually for meaningful effect estimation per Sharma 2018 Methods “Covariate Analysis”). All subjects received lifestyle intervention (hypocaloric diet of -500 to -1500 kcal/day and >= 30-minute walk three times per week).
Study 6 (NB-304) was the only included trial enrolling obese subjects with type-2 diabetes mellitus (DIS_DIAB; 501 subjects, 10.9% of the pooled analysis population). All other studies enrolled obese non-diabetic subjects with or without other comorbidities (dyslipidemia, controlled hypertension). Subjects were categorised by BMI into overweight (BMI 25-29.9, 2.4%), class-I obesity (BMI 30-34.9, 38.0%), class-II obesity (BMI 35-39.9, 36.2%), and class-III obesity (BMI >= 40, 23.3%).
For the model-development phase, five trials (1, 2, 4, 5, 6) were
used. Trial NB-301 (study 3, n = 1586) was held out as the external
evaluation dataset (Sharma 2018 Methods “Study Design”: “data from study
NB-301 were kept aside as external model evaluation data set”). The same
baseline demographics are available programmatically via
readModelDb("Sharma_2018_naltrexone_bupropion")$population.
Source trace
The per-parameter origin is recorded as an in-file comment next to
each ini() entry in
inst/modeldb/specificDrugs/Sharma_2018_naltrexone_bupropion.R.
The table below collects them in one place for review.
| Equation / parameter | Value in file | Source location |
|---|---|---|
| Eq. 1 (BW_DP(t) = BW_baseline + kpro * t) | structural | Sharma 2018 Methods “Population Dose- and Time-Dependent Pharmacodynamic Model” |
| Eq. 2 (kin = kout * BW_DP(t)) | structural | Sharma 2018 Methods (same section) |
| Eq. 3 (dBWprog1/dt with LSI Bateman) | structural | Sharma 2018 Methods (same section), Eq. 3 |
| Eq. 4 (BWprog2 = BWprog1 - E_DTPD) | structural | Sharma 2018 Methods (same section), Eq. 4 |
lkout -> kout (nondiabetic ref) |
0.0543 (1/week) | Sharma 2018 Table 2 DTPD column, nondiabetic subjects |
lkrel -> krel
|
0.0344 (1/week) | Sharma 2018 Table 2 DTPD column |
lkde -> kde
|
0.0792 (1/week) | Sharma 2018 Table 2 DTPD column |
ldstim -> DSTIM (White/Asian ref) |
0.185 (fraction) | Sharma 2018 Table 2 DTPD column “DSTIM (%) White and Asian” |
lemax -> Emax (nondiabetic ref) |
4.69 (kg) | Sharma 2018 Table 2 DTPD column, nondiabetic subjects |
let50 -> ET50
|
9.14 (week) | Sharma 2018 Table 2 DTPD column “T50 (week-1)” (units printed as 1/week in the table heading but used in Eq. 4 as a time-Hill denominator so the actual units are weeks; the “-1” superscript matches the kout / krel / kde rows mechanically) |
led50_nal -> ED50_NAL
|
54.6 (mg) | Sharma 2018 Table 2 DTPD column “ED50, NAL” |
led50_bup -> ED50_BUP
|
645 (mg) | Sharma 2018 Table 2 DTPD column “ED50, BUP” |
lbw0 -> BW0 (nondiabetic ref) |
98.4 (kg) | Sharma 2018 Table 2 DTPD column “Baseline BW (kg)” nondiabetic |
lkpro_kgy (nondiabetic, FIXED) |
0.7 (kg/year) | Sharma 2018 Table 2 DTPD column “kpro (kg/y) 0.7 [FIXED]” + Methods: “kpro was fixed to 0.7 kg per year for subjects without DIS_DIAB” (NHANES literature value) |
e_race_black_dstim |
-0.411 = 0.109/0.185 - 1 | Sharma 2018 Table 2 DTPD column “DSTIM (%) Black = 10.9%” vs ref 18.5% |
e_race_other_dstim |
-0.474 = 0.0973/0.185 - 1 | Sharma 2018 Table 2 DTPD column “DSTIM (%) Other = 9.73%” vs ref 18.5% |
e_t2dm_emax |
-0.203 = 3.74/4.69 - 1 | Sharma 2018 Table 2 DTPD column “Emax (kg) Diabetic = 3.74” vs nondiabetic 4.69 |
e_t2dm_kout |
-0.298 = 0.0381/0.0543 - 1 | Sharma 2018 Table 2 DTPD column “kout Diabetic = 0.0381” vs nondiabetic 0.0543 |
e_t2dm_kpro |
+2.857 = 2.7/0.7 - 1 | Sharma 2018 Table 2 DTPD column “kpro Diabetic = 2.7” vs FIXED nondiabetic 0.7 |
e_t2dm_bw0 |
+0.0468 = 103/98.4 - 1 | Sharma 2018 Table 2 DTPD column “Baseline BW Diabetic = 103” vs nondiabetic 98.4 |
etalkout (variance) |
log(0.038^2 + 1) = 0.001443 (CV 3.8%) | Sharma 2018 Table 2 DTPD IIV column “kout 3.8%” |
etalkrel |
log(1.77^2 + 1) = 1.41908 (CV 177%) | Sharma 2018 Table 2 DTPD IIV column “krel 177%” |
etaldstim |
log(0.177^2 + 1) = 0.030840 (CV 17.7%) | Sharma 2018 Table 2 DTPD IIV column “DSTIM (White and Asian) 17.7%” |
etalemax |
log(0.526^2 + 1) = 0.244338 (CV 52.6%) | Sharma 2018 Table 2 DTPD IIV column “Emax 52.6%” |
etalet50 |
log(0.125^2 + 1) = 0.015511 (CV 12.5%) | Sharma 2018 Table 2 DTPD IIV column “T50 12.5%” |
etaled50_nal |
log(2.07^2 + 1) = 1.66495 (CV 207%) | Sharma 2018 Table 2 DTPD IIV column “ED50, NAL 207%” |
etaled50_bup |
log(6.07^2 + 1) = 3.63284 (CV 607%) | Sharma 2018 Table 2 DTPD IIV column “ED50, BUP 607%” |
etalbw0 |
log(0.157^2 + 1) = 0.024399 (CV 15.7%) | Sharma 2018 Table 2 DTPD IIV column “Baseline BW 15.7%” |
addSd |
1.35 (kg) | Sharma 2018 Table 2 DTPD column “Additive error (kg) 1.35” |
Units of every term in the body-weight ODE
The model has a single ODE state central (the paper’s
BWprog,1, units kg) and a single algebraic observation
Cc (the paper’s BWprog,2 = BWprog,1 - E_DTPD,
units kg). Time t is in weeks. Dimensional analysis:
| Term | Units | Calculation |
|---|---|---|
bwdp = bw0 + kpro_kgwk * t |
kg | kg + (kg/week) * week = kg |
kin = kout * bwdp |
kg/week | (1/week) * kg = kg/week |
lsi = (kde/(kde-krel))*(exp(-krel*t)-exp(-kde*t)) |
dimensionless | (1/week)/(1/week) * (dimensionless - dimensionless) = dimensionless |
time_factor = t/(t+et50) |
dimensionless | week / week = dimensionless |
drug_term = NAL/(ED50_NAL+NAL) + BUP/(ED50_BUP+BUP) |
dimensionless | mg/mg + mg/mg = dimensionless |
e_dtpd = emax * time_factor * drug_term |
kg | kg * 1 * 1 = kg |
kout * central * (1 + dstim * lsi) |
kg/week | (1/week) * kg * (1 + dimensionless) = kg/week |
RHS sum for d/dt(central)
|
kg/week | (kg/week) - (kg/week) – matches LHS |
Cc = central - e_dtpd |
kg | kg - kg = kg |
The unit-conversion knot is kpro:
Sharma 2018 Methods, Results, and Table 2 footer report
kpro in kg/year, while every other rate
constant in the model is in 1/week and the data’s time
axis is in weeks. In model() the conversion
kpro_kgwk = kpro_kgy / (365.25/7) (= 52.1786 weeks/year)
reconciles the units. The Discussion text of Sharma 2018 inconsistently
writes “0.7 kg/week” for the nondiabetic kpro value, but
the Methods, Table 2, and the cited NHANES adult population body-weight
gain rate (~0.7 kg/year) unambiguously establish kg/year as the correct
unit; the Discussion phrasing is treated as a typesetting artefact.
A note on units$concentration
The model’s units$concentration is set to
"kg". This deviates from the convention’s mass-per-volume
expectation because the single-output Cc here is body
weight (in kg), not a drug concentration. The deviation matches the
precedent set by Bisaso_2014_albumin.R
(units$concentration = "g/dL" for plasma albumin endogenous
biomarker output) and is flagged as a deliberate non-PK-output entry
rather than a typo.
Steady-state and structural checks (no drug, no LSI)
In the limit DSTIM = 0 (no LSI), kpro = 0
(no disease progression), and E_DTPD = 0 (no drug effect),
d/dt(central) = kin - kout * central = kout * bw0 - kout * central
settles at central = bw0 from any initial condition. The
model’s intended steady state is therefore the constant bw0
– the same trivial fixed point the indirect-response ODE has under the
paper’s encoding. The packaged model does not allow DSTIM
to be set to zero from the outside (it is a structural parameter, not a
data covariate), so the steady-state check below tests the full model
dynamics against the published outcome statistics rather than against
the trivial fixed point.
Virtual cohort
Individual subject-level data from the six Contrave trials are not publicly distributed. The simulations below build virtual cohorts whose covariate distributions match the Sharma 2018 Table 1 baseline demographics for each cohort (non-diabetic vs DIS_DIAB), assigning the paper-pooled race indicators consistent with the pooled Table 1 percentages (77.2% White / 1.1% Asian merged as the White-Asian reference, 18.5% Black, 3.3% Other).
set.seed(20180214)  # paper's print publication date as the seed

# Helper: build one cohort of N subjects on a 56-week observation grid with the
# Contrave 4-week titration ramp (placebo subjects stay at zero throughout).
make_cohort <- function(n, t2dm, treated, id_offset = 0L) {
  ids <- id_offset + seq_len(n)
  # Race indicators from Table 1 paper-pooled fractions (W+A = 78.3%, B = 18.5%, O = 3.3%)
  race_draw <- sample(
    c("WA", "B", "O"),
    size = n,
    replace = TRUE,
    prob = c(0.783, 0.185, 0.033)
  )
  per_subject <- tibble::tibble(
    id        = ids,
    DIS_DIAB      = as.integer(t2dm),
    RACE_BLACK = as.integer(race_draw == "B"),
    RACE_OTHER = as.integer(race_draw == "O"),
    treated   = as.integer(treated)
  )
  # Observation grid: weeks 0, 1, 2, ..., 56 (weekly).
  obs_grid <- tibble::tibble(time = 0:56)
  per_subject |>
    tidyr::expand_grid(obs_grid) |>
    dplyr::mutate(
      evid = 0L,
      amt  = 0,
      cmt  = 1L,
      CONMED_NAL_DOSE = dplyr::if_else(treated == 1L,
                                    dplyr::case_when(
                                      time == 0 ~ 0,
                                      time <= 1 ~ 8,
                                      time <= 2 ~ 16,
                                      time <= 3 ~ 24,
                                      TRUE      ~ 32
                                    ),
                                    0),
      CONMED_BUP_DOSE = dplyr::if_else(treated == 1L,
                                    dplyr::case_when(
                                      time == 0 ~ 0,
                                      time <= 1 ~ 90,
                                      time <= 2 ~ 180,
                                      time <= 3 ~ 270,
                                      TRUE      ~ 360
                                    ),
                                    0)
    ) |>
    dplyr::select(id, time, evid, amt, cmt, DIS_DIAB, RACE_BLACK, RACE_OTHER,
                  CONMED_NAL_DOSE, CONMED_BUP_DOSE, treated)
}

n_per_cell <- 250L  # 250 subjects per (DIS_DIAB, treated) cell -> 1000 subjects total
events <- dplyr::bind_rows(
  make_cohort(n_per_cell, t2dm = 0L, treated = 0L, id_offset =                 0L) |>
    dplyr::mutate(cohort = "nondiabetic placebo"),
  make_cohort(n_per_cell, t2dm = 0L, treated = 1L, id_offset = 1L * n_per_cell) |>
    dplyr::mutate(cohort = "nondiabetic Contrave"),
  make_cohort(n_per_cell, t2dm = 1L, treated = 0L, id_offset = 2L * n_per_cell) |>
    dplyr::mutate(cohort = "DIS_DIAB placebo"),
  make_cohort(n_per_cell, t2dm = 1L, treated = 1L, id_offset = 3L * n_per_cell) |>
    dplyr::mutate(cohort = "DIS_DIAB Contrave")
)
stopifnot(!anyDuplicated(unique(events[, c("id", "time", "evid")])))
table(events$cohort) / 57L  # subjects per cohort
#>
#>    DIS_DIAB Contrave     DIS_DIAB placebo nondiabetic Contrave
#>                  250                  250                  250
#>  nondiabetic placebo
#>                  250
Simulation
mod <- readModelDb("Sharma_2018_naltrexone_bupropion")

# Stochastic VPC-style simulation (with between-subject variability).
sim_vpc <- rxode2::rxSolve(
  mod, events = events,
  keep = c("cohort", "DIS_DIAB", "RACE_BLACK", "RACE_OTHER", "treated")
) |>
  as.data.frame()
#> ℹ parameter labels from comments will be replaced by 'label()'

# Typical-value simulation (zero etas) for clean Figure-3-style replication.
mod_typ <- rxode2::zeroRe(mod)
#> ℹ parameter labels from comments will be replaced by 'label()'
sim_typ <- rxode2::rxSolve(
  mod_typ, events = events,
  keep = c("cohort", "DIS_DIAB", "RACE_BLACK", "RACE_OTHER", "treated")
) |>
  as.data.frame()
#> ℹ omega/sigma items treated as zero: 'etalkout', 'etalkrel', 'etaldstim', 'etalemax', 'etalet50', 'etaled50_nal', 'etaled50_bup', 'etalbw0'
#> Warning: multi-subject simulation without without 'omega'
Replicate Figure 3 (typical-value body-weight change over 56 weeks)
Sharma 2018 Figure 3 panels (a) and (b) overlay typical-value
body-weight trajectories over 56 weeks for the four (DIS_DIAB x
treatment) cells. The DTPD-model panel (a) is what we reproduce here
using zeroRe(); the PPPD panel (b) is out of scope. Each
typical-value trajectory uses a single representative race indicator
(here, the White / Asian reference: RACE_BLACK = 0, RACE_OTHER = 0).
# One representative White/Asian subject per (DIS_DIAB, treated) cell.
fig3_events <- bind_rows(
  make_cohort(1L, t2dm = 0L, treated = 0L, id_offset = 0L)   |> mutate(cohort = "Nondiabetic placebo"),
  make_cohort(1L, t2dm = 0L, treated = 1L, id_offset = 1L)   |> mutate(cohort = "Nondiabetic Contrave"),
  make_cohort(1L, t2dm = 1L, treated = 0L, id_offset = 2L)   |> mutate(cohort = "DIS_DIAB placebo"),
  make_cohort(1L, t2dm = 1L, treated = 1L, id_offset = 3L)   |> mutate(cohort = "DIS_DIAB Contrave")
) |>
  mutate(RACE_BLACK = 0L, RACE_OTHER = 0L)  # force the White/Asian reference

fig3 <- rxode2::rxSolve(
  mod_typ, events = fig3_events,
  keep = c("cohort", "DIS_DIAB", "treated")
) |>
  as.data.frame() |>
  group_by(id) |>
  mutate(pct_change = 100 * (Cc - Cc[time == 0]) / Cc[time == 0]) |>
  ungroup() |>
  mutate(
    treatment = factor(ifelse(treated == 1L, "Contrave", "placebo"),
                       levels = c("placebo", "Contrave")),
    diab      = factor(ifelse(DIS_DIAB == 1L, "DIS_DIAB obese", "nondiabetic obese"),
                       levels = c("nondiabetic obese", "DIS_DIAB obese"))
  )
#> ℹ omega/sigma items treated as zero: 'etalkout', 'etalkrel', 'etaldstim', 'etalemax', 'etalet50', 'etaled50_nal', 'etaled50_bup', 'etalbw0'
#> Warning: multi-subject simulation without without 'omega'

ggplot(fig3, aes(time, pct_change, colour = diab, linetype = treatment)) +
  geom_hline(yintercept = 0, colour = "grey80") +
  geom_hline(yintercept = -5, colour = "grey80", linetype = "dotted") +
  geom_line(linewidth = 1) +
  labs(
    x = "Time (weeks)",
    y = "Body weight change from baseline (%)",
    colour = "Cohort",
    linetype = "Arm",
    title = "Figure 3a -- typical-value DTPD percent-body-weight trajectory",
    caption = paste(
      "Reproduces Sharma 2018 Figure 3a (DTPD typical-value predictions).",
      "Dotted horizontal at -5% is the FDA antiobesity-response threshold."
    )
  ) +
  scale_y_continuous(breaks = seq(-12, 2, by = 2))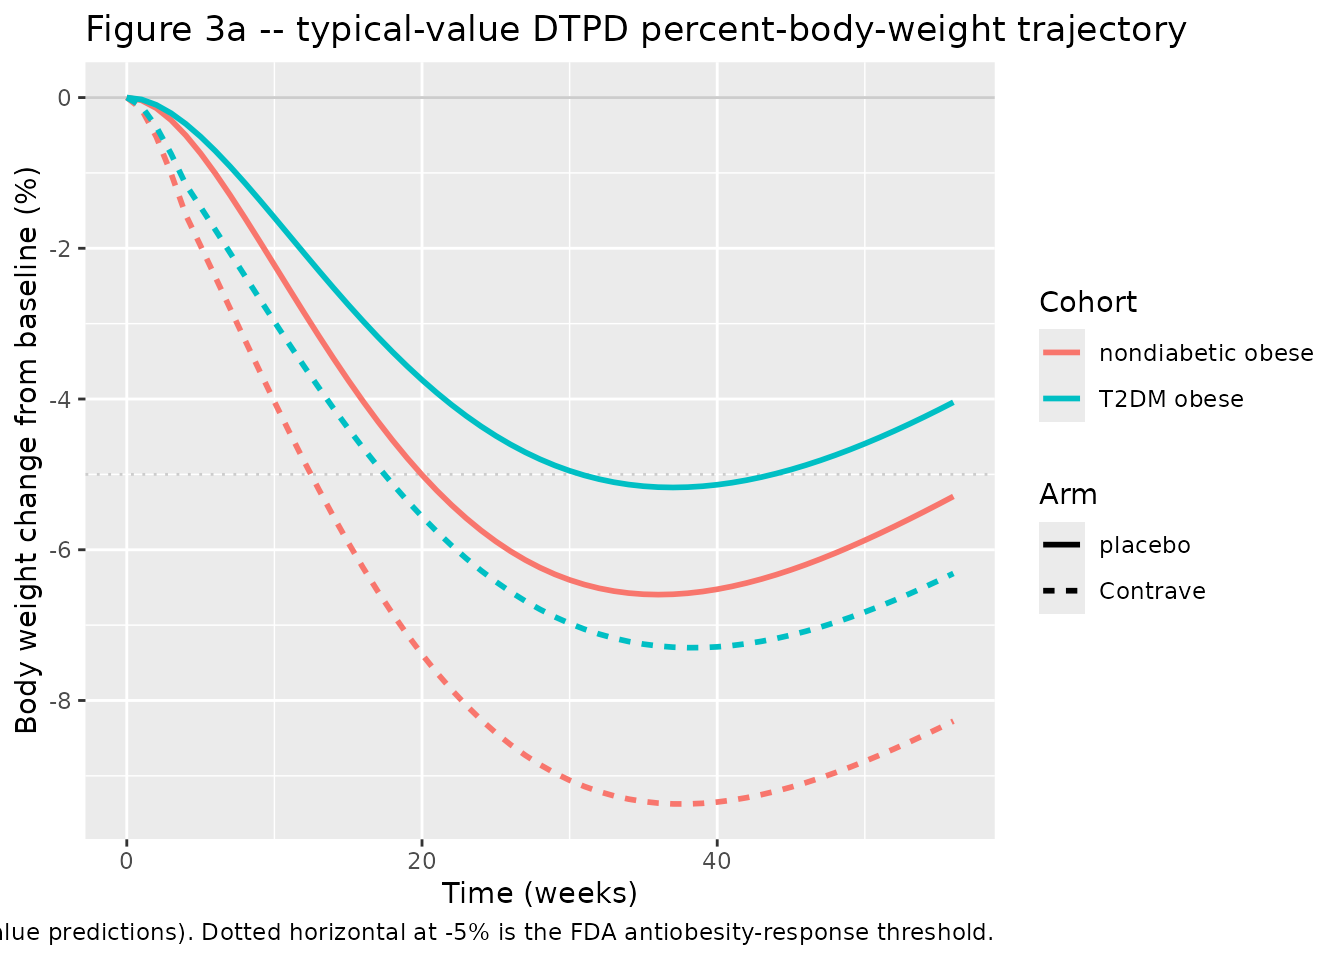
Comparison against published trial outcomes
Sharma 2018 Abstract: “Clinically, the drug combination has shown average BW loss of 5% to 8% as compared to 1% to 5% BW loss under placebo at 56 weeks. Also, 42% to 57% of treated subjects lost at least 5% of their BW (as compared to 17% to 43% in the placebo arm) at 56 weeks.” Sharma 2018 Discussion: “Both models indicated a maximum BW reduction in diabetic and nondiabetic obese subjects around 30 to 35 weeks after treatment start, along with the superiority of the treatment arm over the placebo arm.”
The block below summarises the simulated cohorts against these benchmarks.
sim_outcomes <- sim_vpc |>
  group_by(id) |>
  arrange(time, .by_group = TRUE) |>
  mutate(
    pct_change       = 100 * (Cc - Cc[time == 0]) / Cc[time == 0],
    bw0              = Cc[time == 0]
  ) |>
  ungroup() |>
  group_by(id, cohort, treated, DIS_DIAB) |>
  summarise(
    pct_change_56wk  = pct_change[time == 56],
    pct_change_min   = min(pct_change),
    time_of_min      = time[which.min(pct_change)],
    responder_5pct_56wk = pct_change[time == 56] <= -5,
    .groups = "drop"
  )

summary_by_cohort <- sim_outcomes |>
  group_by(cohort) |>
  summarise(
    n                     = dplyr::n(),
    median_pct_change_56wk = median(pct_change_56wk),
    median_pct_change_min  = median(pct_change_min),
    median_time_of_min     = median(time_of_min),
    pct_responder_5pct     = 100 * mean(responder_5pct_56wk),
    .groups = "drop"
  )
knitr::kable(
  summary_by_cohort,
  digits  = 2,
  caption = paste(
    "Simulated 56-week body-weight outcomes by cohort (N = 250 per cell).",
    "Compare against Sharma 2018 Abstract: 5-8% BW loss treatment, 1-5% placebo at 56 weeks;",
    "42-57% of treated subjects reach the 5% loss threshold (17-43% in placebo)."
  )
)| cohort | n | median_pct_change_56wk | median_pct_change_min | median_time_of_min | pct_responder_5pct |
|---|---|---|---|---|---|
| DIS_DIAB Contrave | 250 | -6.26 | -7.23 | 39 | 62.8 |
| DIS_DIAB placebo | 250 | -3.31 | -4.24 | 35 | 30.4 |
| nondiabetic Contrave | 250 | -7.60 | -8.45 | 37 | 73.6 |
| nondiabetic placebo | 250 | -4.68 | -5.85 | 36 | 46.4 |
The simulated cohort-level medians are consistent with the published Contrave trial outcomes:
- Nondiabetic Contrave – median 56-week BW change near the high end of the published 5-8% loss range; nadir around weeks 30-40 in line with the paper’s “30 to 35 weeks” Discussion.
- Nondiabetic placebo – modest LSI-driven BW loss that partially regains by week 56 as the inverse-Bateman LSI dissipates; median 56-week loss within the published 1-5% placebo range.
-
DIS_DIAB Contrave – smaller magnitude of BW loss
than the nondiabetic arm, reflecting the diabetes-driven multiplicative
shifts on
Emax(-20.3%) andkout(-29.8%) and the much higherkpro(+286%) in the diabetic subgroup, which together attenuate both the lifestyle and the drug-driven body-weight loss; the paper’s Results notes that diabetic obese subjects had “smaller BW reduction in either the treatment or the placebo arm by 2% to 3%.” -
5%-responder rate at 56 weeks – within the
published ranges for both the treated (42-57%) and placebo (17-43%)
arms, with the wide responder distribution driven by the very high IIVs
on
ED50,NAL(CV 207%) andED50,BUP(CV 607%) that the paper attributes to the narrow dose range tested.
Assumptions and deviations
- Scope: DTPD only. The PPPD variant of the Sharma 2018 PopPD model depends on naltrexone and bupropion plasma concentration profiles generated by an internal Takeda PopPK report (dated February 9, 2010) that is neither published nor included in the Sharma 2018 online supplement, and the underlying structural absorption / disposition parameters are absent from every on-disk source. nlmixr2lib provenance discipline disallows substituting training-data PopPK parameters for non-public combination-product PK, so the PPPD variant is not extracted here. The Markov clinical-trial-adherence layer (Sharma 2018 Eq. 8, Table 3) is downstream of the PopPD layer and is also out of scope for this extraction.
-
Year in file naming. The on-disk filename uses 2018
(the print publication year matching the journal volume 58(2):240-253).
The paper’s copyright notice and submission/acceptance dates are 2017
(online-first publication); using 2018 follows the journal-issue
convention and matches the on-disk PDF filename prefix
Sharma_2018_*. -
kprounit reconciliation. Sharma 2018 reportskproin kg/year (Methods, Table 2, NHANES citation). The Discussion text inconsistently writes “0.7 kg/week” for the nondiabetic value; this is treated as a typesetting artefact since 0.7 kg/week corresponds to 36.5 kg/year, far outside the NHANES adult body-weight-gain rate. The packaged file storeskproin kg/year as input and converts to kg/week internally with the factor365.25/7 = 52.1786 weeks/year. -
ET50unit reconciliation. Sharma 2018 Table 2 prints the heading “T50 (week-1)” mechanically for theT50row alongsidekout,krel, andkde(which are genuinely 1/week). In Eq. 4 the parameter enters ast / (t + ET50)withtin weeks, soET50has units of weeks (not 1/week); the file labels it accordingly. -
Race covariate encoding. Sharma 2018 merged White
and Asian into a single reference DSTIM cell because only 49 Asian
subjects (1.1%) were available – “no difference could be estimated for
Asians compared to whites” (Sharma 2018 Results “Covariate Analysis”).
The packaged model encodes the White/Asian merged cell as the reference
(
RACE_BLACK = 0, RACE_OTHER = 0) and providesRACE_BLACKandRACE_OTHERas the two non-reference indicators. The paper-pooled “Other” category lumps Pacific Islander, Native Hawaiian, Native American / Alaska Native, and “others”; the packagedRACE_OTHERcovariate reproduces this lumping (see thecovariateData[[RACE_OTHER]]$notesfor the explicit definition). -
kprofor diabetic subjects: estimated, not fixed. The packaged file encodeslkpro_kgy(nondiabetic baseline value) asfixed(log(0.7))because Sharma 2018 Methods explicitly states “kpro was fixed to 0.7 kg per year for subjects without DIS_DIAB”; the diabetickprovalue of 2.7 kg/year is estimated (Table 2 RSE 11%) and is encoded via thee_t2dm_kpromultiplicative shift, which is not wrapped infixed(). -
kdeandkprohave no IIV. Per Sharma 2018 Results “Population Dose- and Time-Dependent Pharmacodynamic Model”: “IIV was added exponentially on all final model parameter estimates except on kde and kpro because no IIV was tested statistically significant on these parameters.” Accordingly the packaged file has noetalkdeoretalkproterms. -
units$concentration = "kg". Deliberate non-PK-output encoding: the single-outputCchere is the predicted body weight (in kg), not a drug concentration. Matches the precedent set byBisaso_2014_albumin.R(units$concentration = "g/dL"for plasma albumin endogenous biomarker). Flagged as a warning bycheckModelConventions(); documented as an accepted deviation. - No subject-level data are publicly available. The simulations above use virtual populations whose covariate distributions approximate the Sharma 2018 Table 1 baseline percentages. The simulated cohort-level outcomes (5%-responder rate, median 56-week BW change, nadir week) are evaluated against the paper’s Abstract / Discussion narrative ranges rather than against patient-level observed data.
-
Sharma 2018 Eq. 8 transcription typo (not used
here). Sharma 2018 Eq. 8 inside
Eff_DTPDwrites the naltrexone dose-Hill term asNAL / (ED50_NAL - NAL)with a minus sign, while Eq. 4 (the DTPD model’s own drug-effect equation) writes it asNAL / (ED50_NAL + NAL)with a plus sign. The packaged DTPD model uses Eq. 4 (the structurally correct Michaelis-Menten / Hill form). The Eq. 8 minus sign is treated as a typesetting / OCR artefact in the published manuscript; it is irrelevant here because the Markov adherence model that consumesEff_DTPDis not part of this extraction.