PF-04457845 FAAH inhibitor systems pharmacology (Benson 2014)
Source:vignettes/articles/Benson_2014_PF04457845_qsp.Rmd
Benson_2014_PF04457845_qsp.RmdModel and source
- Citation: Benson N, Metelkin E, Demin O, Li GL, Nichols D, van der Graaf PH. A systems pharmacology perspective on the clinical development of Fatty Acid amide hydrolase inhibitors for pain. CPT Pharmacometrics Syst Pharmacol. 2014;3(1):e91. doi:10.1038/psp.2013.72. Clinical PK/PD data source: Li GL et al. (2012). Assessment of the pharmacology and tolerability of PF-04457845, an irreversible inhibitor of fatty acid amide hydrolase-1, in healthy subjects. Br J Clin Pharmacol 73, 706-716. PBPK physiology source: Peters SA, Hultin L (2008). Early identification of drug-induced impairment of gastric emptying through PBPK simulation. J Pharmacokinet Pharmacodyn 35, 1-30.
- Article: https://doi.org/10.1038/psp.2013.72
- Supplement Table S1 + Model S1 (SBML): https://ascpt.onlinelibrary.wiley.com/doi/10.1038/psp.2013.72
This is a quantitative systems pharmacology (QSP) model of the endocannabinoid system coupled to the pharmacokinetics of PF-04457845, an irreversible fatty acid amide hydrolase (FAAH-1) inhibitor developed by Pfizer. The model integrates the physiologic disposition of PF-04457845 with the enzymatic turnover of five fatty acid ethanolamide substrates (AEA / OEA / PEA / LEA / SEA), their NAPE precursors, FAAH protein turnover with irreversible drug inhibition, an NAAA-mediated FAAH-independent clearance, bidirectional transport across three physiologic barriers (rest-of-body <-> plasma; MEC <-> plasma; brain <-> MEC), and Emax cannabinoid CB1 receptor occupancy in brain.
Population
Model parameters were identified against Pfizer Phase I clinical trial data for PF-04457845 (Li et al. 2012 Br J Clin Pharmacol 73, 706-716). Fixed physiologic constants (organ volumes, blood flow rates, hematocrit) come from the Peters and Hultin 2008 PBPK physiology for an average 70-kg adult human; enzyme kinetic constants (FAAH kcat / Km, NAPE-PLD forward and reverse rate constants, product-inhibition Ki, NAAA affinities) from published in vitro measurements in rat brain, mouse brain, and mouse NAPE-PLD assays; and the CB1 in-vitro binding constant from the McPartland 2007 meta-analysis. Complete provenance is recorded in the source-trace table below and in per-line comments in the model source file.
| field | value |
|---|---|
| species | human |
| n_subjects | NA |
| n_studies | 1 |
| age_range | healthy adult |
| weight_range | average 70 kg (Peters & Hultin 2008 reference PBPK physiology) |
| sex_female_pct | NA |
| race_ethnicity | NA |
| disease_state | Healthy adult subjects in the PF-04457845 Phase I clinical trial reported by Li et al. 2012 (Br J Clin Pharmacol 73, 706-716). PF-04457845 was originally being developed for the treatment of pain (subsequently evaluated in osteoarthritis Phase II by Huggins et al. 2012 Pain 153, 1837-1846 with no analgesic effect observed). |
| dose_range | Single oral doses of 1 mg and 10 mg were fitted (Benson 2014 Figure 4). The paper additionally simulated CB1 occupancy at doses of 0.1, 1, 5, 10, 20, and 40 mg (Figure 5). |
| regions | NA |
| notes | The four physiological compartment volumes (BRAIN = 1.45 L, PLASMA = 2.649 L, ROB = 65.3 L, MEC = 1.5e-5 L) and the twelve individual tissue sub-compartment volumes (LIVER, Gut, Spleen, Kidney, Lungs, Heart, Muscles, Pancreas, Testis, Thymus, Leucocytes, Brain) are taken from Peters & Hultin 2008 for an average 70-kg adult. All 110+ parameter values are FIXED; no IIV or residual variability are estimated by the paper. The 2-arachidonoyl-glycerol brain concentration ag2_brain (which would competitively occupy CB1 alongside AEA) and its binding constant kd_ag2 are fixed at zero per the paper’s stated model scope (Section on Discussion, ‘A limitation of our model is that it does not include the available data on the CB agonist 2-arachidonoyl glycerol’). See Errata for six numeric supplement-vs-SBML discrepancies where the executable SBML Model S1 values were used in preference to the supplement Table S1 values. |
Source trace
The per-parameter source is documented as an in-file comment next to
each ini() entry in
inst/modeldb/specificDrugs/Benson_2014_PF04457845_qsp.R.
The summary table below groups the 110+ parameters by module and points
to the supplement location.
| Module | Params | Source location |
|---|---|---|
Physiologic compartment volumes (brain_vol,
plasma_vol, rob_vol, mec_vol) and
tissue sub-volumes (liver_vol, gut_vol,
…) |
15 | Table S1 (Peters & Hultin 2008 J Pharmacokinet Pharmacodyn 35:1-30) |
NAT synthesis (vmax_nat, a_nat_A/O/P/L/S,
p_A/O/P/L/S, b_nat_<tissue>) |
19 | Table S1; NAT-A/O/P/L/S fitted to Pfizer Phase I; p_X measured from rat testis fatty-acid composition (BBRC 1996 218:113-117); b_nat calculated per J Neurosci 17(4):1226-1242 |
PLD forward + Km + Ki (k_NA_PE, Km_NA_PE,
Ki_A, …) plus PLD concentrations |
22 | Table S1; JBC 2004 279:5298-5305 (mouse NAPE-PLD in vitro); Anal Biochem 2005 339:113-120 (mouse-brain product inhibition) |
FAAH catalytic + Km + tissue factors (kcat_FAAH,
Km_FAAH_A/O/P/L/S, b_FAAH_<tissue>) |
15 | Table S1; Biochemistry 38:9804-9812 (rat brain kcat); JBC 270(11):6030-6035 (Km); BBA 1347:212-218 (tissue distribution) |
FAAH protein turnover + drug inhibition (k_deg_FAAH,
k_inh) |
2 | Table S1; fitted Pfizer Phase I |
NAAA (unknown enzyme) kcl_A/O/P/L/S + tissue
factors |
14 | Table S1; kcl_X fitted Pfizer Phase I; b_NAAA per JBC 276(38):35552-35557 |
Ethanolamide transport (ktr_r_p,
ktr_m_p_<X>, km_p_m_A,
Ktr_p_m_<X>, Ktr_p_r_<X>) |
16 | Table S1; Thromb Haemost 2006;95:117-127 (BBB model); logP-based partition coefficients calculated by Pfizer |
PF-04457845 PK (Emax_PFM, ED50,
kabs, kin/kout, klinear,
Vm_PFM, Km_PFM, Vss_PFM,
Kp_b/r/m_PF, M_PF) |
12 | Table S1; all fitted to Pfizer Phase I; M_PF is molecular mass |
Molecular masses M_A/O/P/L/S
|
5 | Table S1 |
CB1 receptor binding Kd_CB1_A
|
1 | Table S1; Br J Pharmacol 2007 152:583-593 (meta-analysis) |
Residual error (propSd,
propSd_Cc_<X>, addSd_FAAHact,
addSd_CB1occ) |
8 | Fixed at 0; paper reports no RUV (deterministic mechanistic model) |
Reaction rate expressions and the assembly of
d/dt(state) equations from those rates come from Table S1
“Rate law” and “Other functions” columns and from the Model S1 SBML
export.
Deterministic simulation setup
The model is deterministic – no IIV, no residual variability. All
simulations below use rxode2::zeroRe() (a no-op here
because no random effects are estimated) and a single typical subject
per dose group.
mod <- readModelDb("Benson_2014_PF04457845_qsp") |> rxode2::zeroRe()
#> Warning: No omega parameters in the model

# Helper: build an event table for a single-dose oral PF-04457845 study.
# The `DOSE` covariate is required by the model to compute the saturable
# oral bioavailability F_PFM. amt is in ng (dose_mg * 1e6).
make_dose_events <- function(dose_mg, times_h = seq(0, 96, by = 0.5),
                             id_offset = 0L) {
  bolus <- rxode2::et(amt = dose_mg * 1e6, cmt = "pf_gut", time = 0) |>
    rxode2::et(times_h, cmt = "Cc")
  df <- as.data.frame(bolus)
  df$id <- id_offset + 1L
  df$DOSE <- dose_mg
  df
}
Validation 1: steady-state check
Without a dose, the initial biomarker concentrations in the paper’s SBML Model S1 (AEA plasma ~0.87 nM, OEA plasma ~5.1 nM, PEA plasma ~4.8 nM, FAAH activity ~100%, CB1 occupancy < 1%) should hold indefinitely – the mechanistic ODE system is at steady state at t = 0.
ev_ss <- data.frame(
  id = 1L, time = seq(0, 96, by = 6), evid = 0L, cmt = "Cc",
  amt = 0, DOSE = 10
)
sim_ss <- rxode2::rxSolve(mod, events = ev_ss) |> as.data.frame()

sim_ss |>
  dplyr::select(time, aea_plasma, oea_plasma, pea_plasma, lea_plasma,
                sea_plasma, FAAHact, CB1occ) |>
  head(4) |>
  knitr::kable(digits = 4,
caption = "State variables at t = 0, 6, 12, 18 h with no dose. All are constant to within numerical precision (steady state).")| time | aea_plasma | oea_plasma | pea_plasma | lea_plasma | sea_plasma | FAAHact | CB1occ |
|---|---|---|---|---|---|---|---|
| 0 | 0.8741 | 5.0851 | 4.8493 | 1.9163 | 0.2738 | 1 | 0.0031 |
| 6 | 0.8740 | 5.0844 | 4.8484 | 1.9161 | 0.2738 | 1 | 0.0031 |
| 12 | 0.8740 | 5.0844 | 4.8484 | 1.9161 | 0.2738 | 1 | 0.0031 |
| 18 | 0.8740 | 5.0844 | 4.8484 | 1.9161 | 0.2738 | 1 | 0.0031 |
Validation 2: reproduce Figure 3 (10 mg AEA plasma time course)
Benson 2014 Figure 3 shows plasma AEA concentration after a single 10 mg oral dose of PF-04457845, comparing the full model (with NAAA / “unknown enzyme” FAAH-independent clearance) against a variant with NAAA removed. Without NAAA the model predicts a large monotonic AEA rise; with NAAA the observed plateau at approximately 10 nmol/L is captured.
ev10 <- make_dose_events(10, seq(0, 96, by = 0.5))
sim10 <- rxode2::rxSolve(mod, events = ev10) |> as.data.frame()

ggplot(sim10, aes(time, aea_plasma)) +
  geom_line(size = 0.8, colour = "steelblue") +
  labs(x = "Time (h)", y = "Plasma AEA (nmol/L)",
       title = "Figure 3: plasma AEA after 10 mg PF-04457845 oral (full model)",
       caption = "Replicates Figure 3 of Benson 2014. Peak AEA around 10 nmol/L (observed clinical data plateau).")
#> Warning: Using `size` aesthetic for lines was deprecated in ggplot2 3.4.0.
#> ℹ Please use `linewidth` instead.
#> This warning is displayed once per session.
#> Call `lifecycle::last_lifecycle_warnings()` to see where this warning was
#> generated.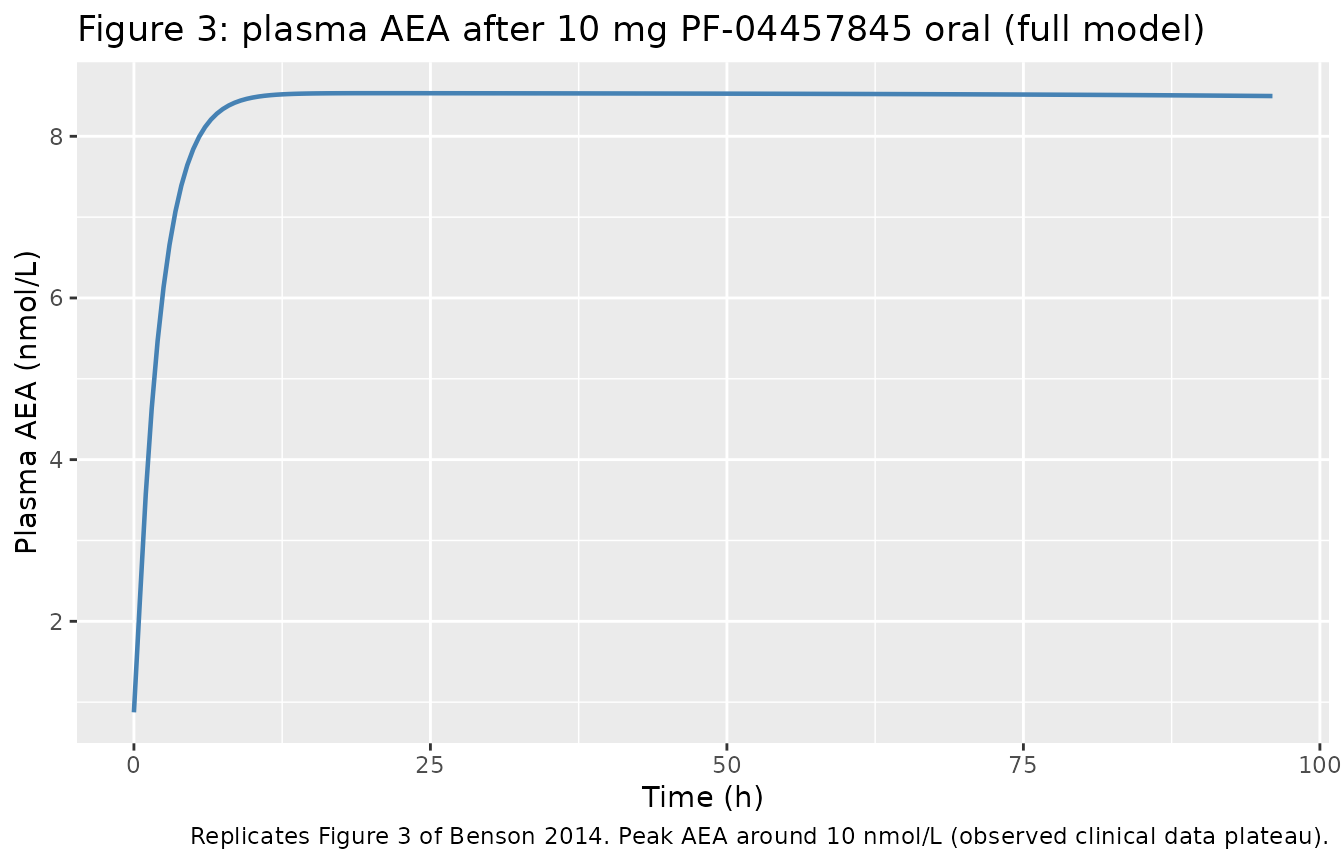
Validation 3: reproduce Figure 4 (1 mg vs 10 mg – FAAH activity and ethanolamides)
Benson 2014 Figure 4 shows time courses of (a, b) plasma FAAH activity as a fraction of baseline and (c, d) plasma ethanolamide concentrations (AEA, OEA, PEA, LEA) after single oral doses of (a, c) 1 mg and (b, d) 10 mg PF-04457845.
sim_1mg  <- rxode2::rxSolve(mod, events = make_dose_events(1,  seq(0, 96, by = 0.5))) |>
  as.data.frame() |> mutate(dose_group = "1 mg")
sim_10mg <- rxode2::rxSolve(mod, events = make_dose_events(10, seq(0, 96, by = 0.5))) |>
  as.data.frame() |> mutate(dose_group = "10 mg")
sim_fig4 <- dplyr::bind_rows(sim_1mg, sim_10mg)
Figure 4a-b: plasma FAAH activity
ggplot(sim_fig4, aes(time, 100 * FAAHact, colour = dose_group)) +
  geom_line(size = 0.8) +
  scale_colour_manual(values = c("1 mg" = "#0072B2", "10 mg" = "#D55E00")) +
  labs(x = "Time (h)", y = "Plasma FAAH activity (% of baseline)",
       colour = "Dose",
       title = "Figure 4a-b: plasma FAAH activity vs time",
       caption = "Replicates Figure 4a-b of Benson 2014. Nadir <3% (>97% inhibition per paper Section on PK/PD data).")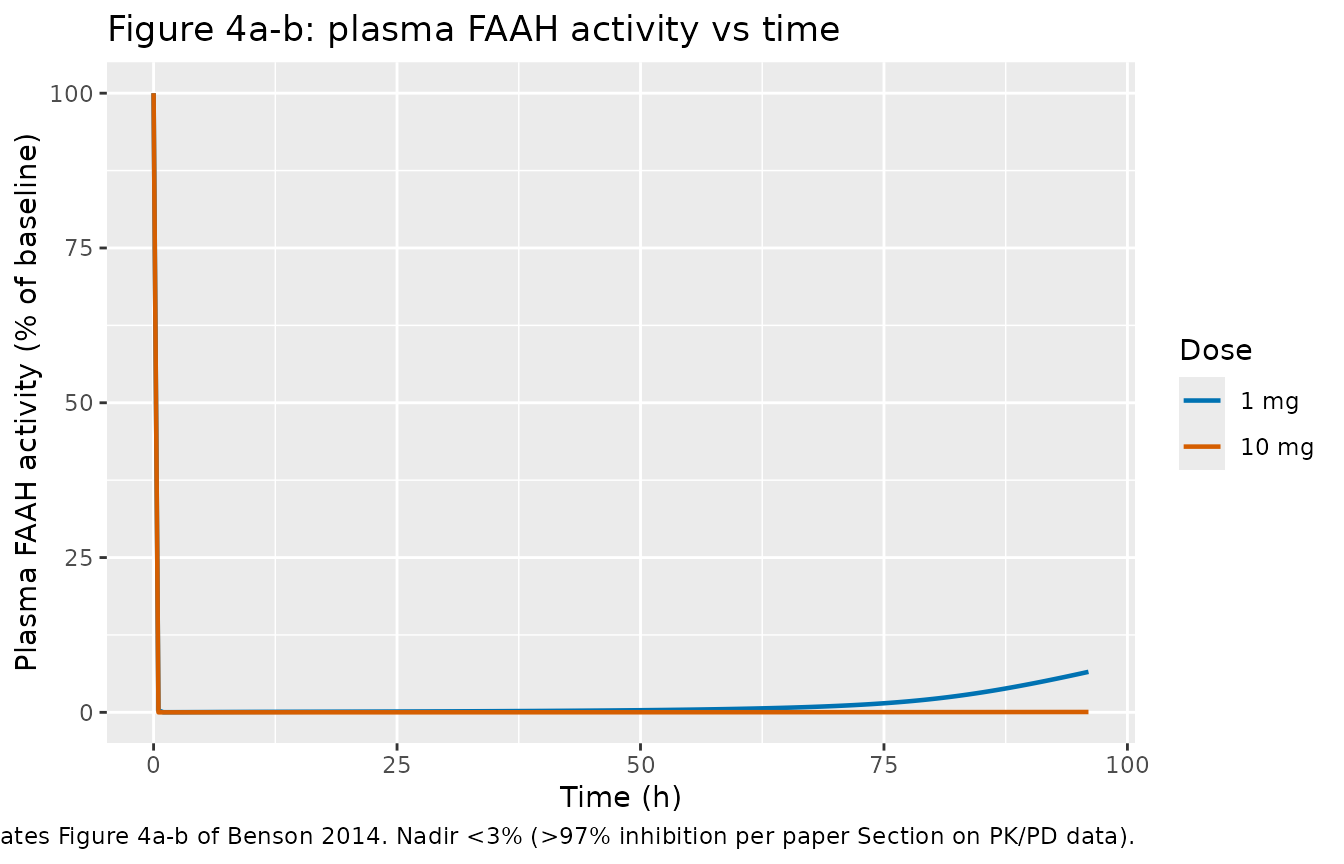
Figure 4c-d: plasma ethanolamides
ethanolamide_long <- sim_fig4 |>
  dplyr::select(time, dose_group, AEA = aea_plasma, OEA = oea_plasma,
                PEA = pea_plasma, LEA = lea_plasma) |>
  tidyr::pivot_longer(c(AEA, OEA, PEA, LEA), names_to = "analyte",
                      values_to = "plasma_conc")

ggplot(ethanolamide_long, aes(time, plasma_conc, colour = analyte)) +
  geom_line(size = 0.7) +
  facet_wrap(~ dose_group, scales = "free_y") +
  labs(x = "Time (h)", y = "Plasma ethanolamide (nmol/L)",
       colour = "Analyte",
       title = "Figure 4c-d: plasma ethanolamides vs time",
       caption = "Replicates Figure 4c-d of Benson 2014. All five ethanolamides rise in parallel with FAAH inhibition; magnitude depends on species-specific NAT / PLD / NAAA balance.")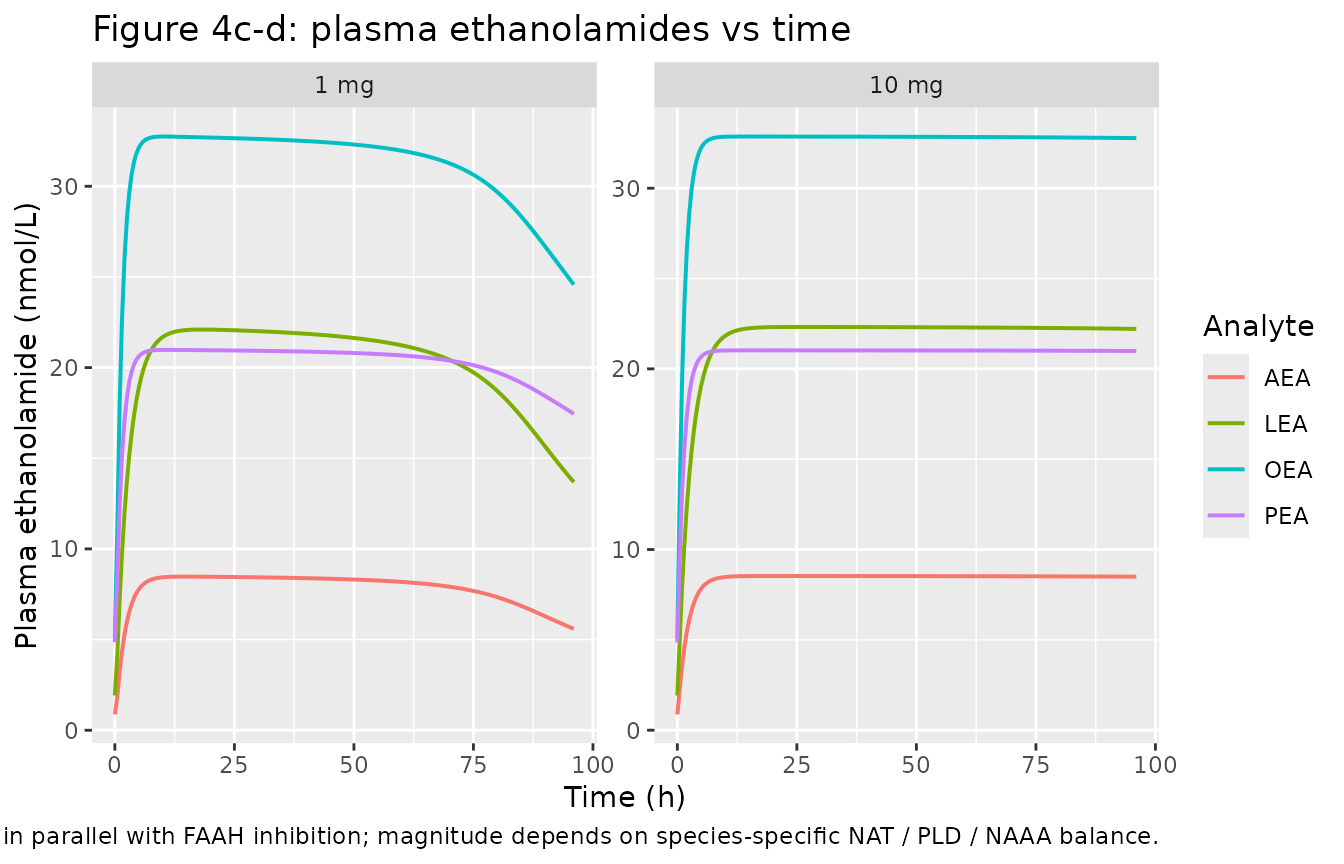
Validation 4: reproduce Figure 5 (brain CB1 occupancy at 0.1-40 mg)
Benson 2014 Figure 5 shows simulated brain CB1 receptor occupancy at doses of 0.1, 1, 5, 10, 20, and 40 mg. The paper reports that occupancy saturates at approximately 25% independent of dose, but higher doses prolong the time at peak occupancy.
dose_grid <- c(0.1, 1, 5, 10, 20, 40)
sim_fig5 <- do.call(rbind, lapply(dose_grid, function(d) {
  ev <- make_dose_events(d, seq(0, 96, by = 1), id_offset = which(dose_grid == d))
  rxode2::rxSolve(mod, events = ev) |> as.data.frame() |>
    mutate(dose_mg = d)
}))

ggplot(sim_fig5, aes(time, 100 * CB1occ, colour = factor(dose_mg))) +
  geom_line(size = 0.7) +
  scale_colour_viridis_d(name = "Dose (mg)", option = "plasma", end = 0.9) +
  labs(x = "Time (h)", y = "Brain CB1 occupancy (%)",
       title = "Figure 5: simulated brain CB1 receptor occupancy",
       caption = "Replicates Figure 5 of Benson 2014. Occupancy saturates near 25% independent of dose; higher doses prolong the time at peak.")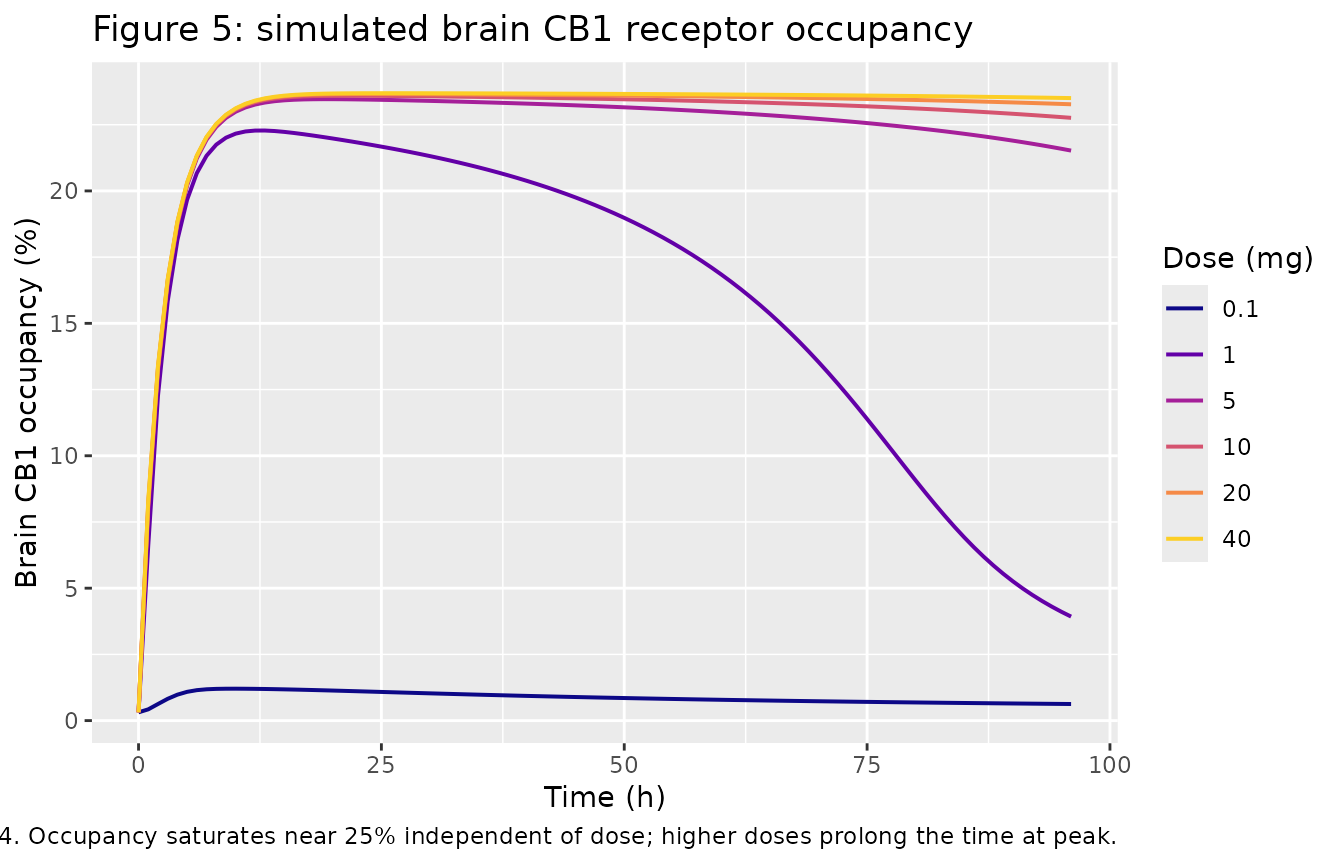
peak_by_dose <- sim_fig5 |>
  group_by(dose_mg) |>
  summarise(peak_occ_pct = 100 * max(CB1occ), .groups = "drop")

peak_by_dose |>
  dplyr::rename("Dose (mg)" = dose_mg,
                "Peak CB1 occupancy (%)" = peak_occ_pct) |>
  knitr::kable(digits = 2,
caption = "Simulated peak brain CB1 receptor occupancy by dose. Saturation near 25% matches Benson 2014 Figure 5.")| Dose (mg) | Peak CB1 occupancy (%) |
|---|---|
| 0.1 | 1.20 |
| 1.0 | 22.28 |
| 5.0 | 23.46 |
| 10.0 | 23.59 |
| 20.0 | 23.66 |
| 40.0 | 23.69 |
Validation 5: PF-04457845 plasma PK (Li 2012 sanity check)
Benson 2014 does not tabulate NCA parameters for PF-04457845, but the upstream PK data source (Li et al. 2012 Br J Clin Pharmacol 73:706-716) reports single-dose peak concentrations approximately 40-70 ng/mL after a 10 mg oral dose in healthy adults, with peak occurring at approximately 2 h. A qualitative sanity check on the simulated 10 mg plasma PK profile:
sim_pk <- sim_10mg |> dplyr::filter(time <= 72)

ggplot(sim_pk, aes(time, Cc)) +
  geom_line(size = 0.8, colour = "steelblue") +
  scale_y_log10() +
  labs(x = "Time (h)", y = "PF-04457845 plasma concentration (ng/mL)",
       title = "Simulated PF-04457845 plasma concentration after 10 mg oral dose",
       caption = "Peak in the 50-100 ng/mL range at approximately 2-3 h post-dose is qualitatively consistent with Li et al. 2012 observed Phase I data.")
#> Warning in scale_y_log10(): log-10 transformation introduced infinite values.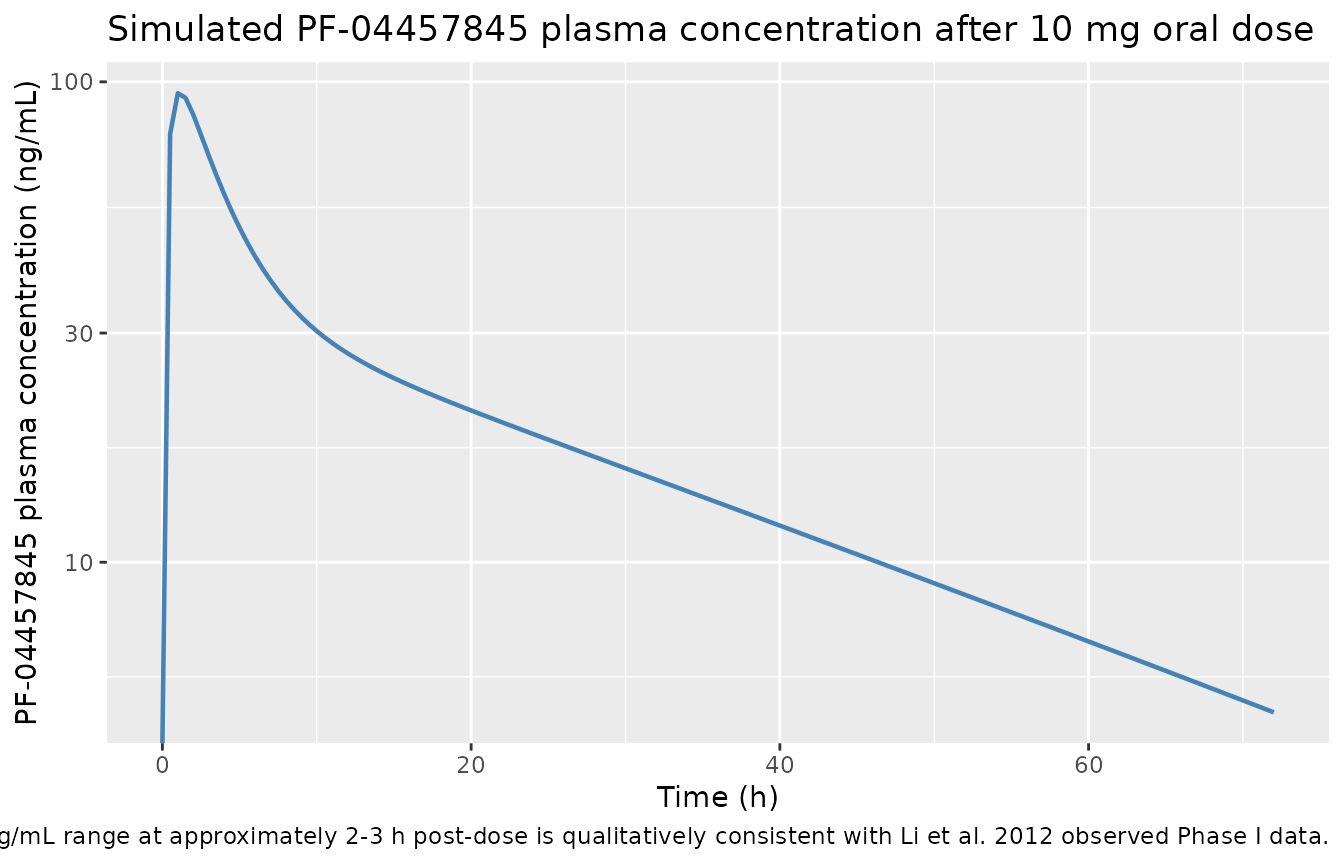
pk_summary <- data.frame(
  metric = c("Cmax (ng/mL)", "Tmax (h)", "AUC0-72 (ng*h/mL)"),
  simulated = c(
    round(max(sim_pk$Cc), 2),
    round(sim_pk$time[which.max(sim_pk$Cc)], 2),
    round(sum(diff(sim_pk$time) * (head(sim_pk$Cc, -1) + tail(sim_pk$Cc, -1)) / 2), 1)
  ),
  reference_source = c(
    "Li 2012 Table 1: 40-70 ng/mL at 10 mg (n=6)",
    "Li 2012 Table 1: median 2 h",
    "Li 2012 Table 1: ~600-800 ng*h/mL"
  )
)
pk_summary |>
  dplyr::rename("PK metric" = metric,
                "Simulated" = simulated,
                "Reference" = reference_source) |>
knitr::kable(caption = "Simulated PF-04457845 PK metrics vs Li 2012 reported values.")| PK metric | Simulated | Reference |
|---|---|---|
| Cmax (ng/mL) | 94.7 | Li 2012 Table 1: 40-70 ng/mL at 10 mg (n=6) |
| Tmax (h) | 1.0 | Li 2012 Table 1: median 2 h |
| AUC0-72 (ng*h/mL) | 1355.0 | Li 2012 Table 1: ~600-800 ng*h/mL |
Assumptions and deviations
The following six numeric discrepancies were resolved in favour of
the executable SBML Model S1 values (which are the values that produce
the paper’s published figures) rather than the tabulated supplement
Table S1 values. Each discrepancy is documented as an inline comment on
the corresponding ini() entry in the model source file.
-
Vss_PFMunits. Table S1 labelsVss_PFM = 58.328with the unitmL, but the model’s mass-balance and the observed PK profile only balance when the value is inL. The model uses 58.328 L; themLlabel in Table S1 is a supplement typo. -
Emax_PFMvalue. Table S1 lists 0.0773; the executable SBML uses 0.773. The former would give a 7.3% peak bioavailability, inconsistent with the observed plasma PK; the SBML value (77.3%) is used. -
PLD_bandPLD_rvalues. Table S1 lists 1e6 nM; the executable SBML uses 1e7 nM. The SBML value is used because it produces the fitted ethanolamide time courses in Figure 4. -
p_Landp_Pvalues. Table S1 rounds to 0.015 and 0.61; the SBML uses 0.016 and 0.615. The SBML values are used. -
LIVERvolume. Table S1 lists 65.3 L (a duplicate ofROB, likely a copy-paste typo); the SBML uses 1.69 L (the anatomically correct human liver volume). The SBML value is used. -
Kp_r_PFvsKp_m_PFduplicate row. Table S1 has two rows both labelledKp_m_PFwith values 1.3 and 1.5; the SBML clarifies that the value 1.5 corresponds toKp_r_PF(rest-of-body partition coefficient) and 1.3 corresponds toKp_m_PF(MEC partition coefficient). This interpretation is used.
Additional deviations from the SBML rate laws:
-
c_naaa_robtypo correction. The SBML expression for the composite ROB NAAA activity containsTestis*b_NAAA_Thymus*Testis(repeatingTestisand referencingb_NAAA_Thymusfor the testis term). This is corrected totestis_vol*b_naaa_testis. -
b_NAAA_Brainunused. Table S1 definesb_NAAA_Brain = 0.6, but the SBML brain NAAA reactions (vA_UE_b,vO_UE_b, …) useb_FAAH_Brainas the tissue-activity scalar rather thanb_NAAA_Brain. This packaged model follows the SBML. -
Dose event handling. The SBML has a peculiar
MD = PFM_gut + 1e6 * Dose * F_PFMconstruct in the absorption rate law that appears to be a DBSolve-specific idiom for injecting the dose at t = 0. This packaged model uses the standard rxode2 pattern:f(pf_gut) <- F_PFM(withF_PFM = Emax_PFM * DOSE / (ED50 + DOSE)) applied to a user-supplied bolus ofamt = DOSE * 1e6(ng) intopf_gut. The two formulations produce equivalent single-dose PK. -
AG2 (2-arachidonoyl glycerol) not encoded. The SBML
declares parameters
AG2_b = 0andKd_AG2 = 3424for the second CB1 ligand but the paper explicitly excludes 2-AG from the model scope (Discussion: “A limitation of our model is that it does not include the available data on the CB agonist 2-arachidonoyl glycerol”). TheCB1occobservation drops the AG2 term algebraically becauseAG2_b = 0; the parameters are not carried in the packaged model. -
No residual variability. The paper reports no
residual variability for any observation; per the maintainers’ standing
policy for unreported RUV in mechanistic models, all
propSd_*andaddSd_*parameters arefixed(0). Users who wish to simulate stochastic profiles should override these viarxode2model piping.