Dexamethasone CYP3A1/2 induction in rats (Li 2012)
Source:vignettes/articles/Li_2012_dexamethasone_rat.Rmd
Li_2012_dexamethasone_rat.RmdModel and source
- Citation: Li L, Li Z, Deng C, Ning M, Li H, Bi S, Zhou T, Lu W. (2012). A mechanism-based pharmacokinetic/pharmacodynamic model for CYP3A1/2 induction by dexamethasone in rats. Acta Pharmacologica Sinica 33(1):127-136. doi:10.1038/aps.2011.161
- Article: Acta Pharmacologica Sinica
Li 2012 developed a mechanism-based PK/PD model for CYP3A1 and CYP3A2 induction by dexamethasone (DEX) in male Sprague-Dawley rats. A single 100 mg/kg intraperitoneal (ip) DEX dose was given; plasma DEX concentrations, hepatic CYP3A1/2 mRNA, CYP3A1/2 protein, and CYP3A1/2 total enzyme activity (rate of 6beta-hydroxytestosterone formation) were measured over 60 h post-dose. The model couples:
- PK – two-compartment mammillary disposition with zero-order ip absorption of duration T0 directly into central; BSV retained only on Q/F.
- mRNA dynamics – indirect-response (Dayneka-style) model in which a Hill-type fractional occupancy of CYP3A DNA-responsive elements by the DEX-PXR complex drives a stimulation signal that flows through a per-isoform chain of transit compartments before stimulating mRNA synthesis (one transit for CYP3A1, eight transits for CYP3A2).
- Protein dynamics – per-isoform protein turnover with a paper-mechanistic sublinear power-law on mRNA (m_i).
- Enzyme activity – algebraic linear combination of the two protein states with per-isoform turnover-number rates (alpha for CYP3A1, beta for CYP3A2).
The packaged model in Li_2012_dexamethasone_rat
reproduces all 4 layers exactly as published in Tables 2-5 of the
source.
Population
- Species: rat (Sprague-Dawley), male, 200-250 g, acclimatised 10 d at 22 C under 12 h/12 h light/dark.
- PK cohort: 3 rats, dense sampling at 16 post-dose time points (0.083 - 48 h).
- PD cohort: 84 rats randomized to DEX (single 100 mg/kg ip) or vehicle (corn oil); n = 3 rats sacrificed per time point at 14 time points (0 - 60 h).
- Dose: 100 mg/kg DEX in 5 mL/kg corn oil, single ip dose after a 12-h fast.
- Assays: DEX plasma by reverse-phase HPLC (LLQ 0.25 ug/mL); CYP3A1/2 mRNA by RT-PCR with absolute-quantification reference standards (attomol per ug total RNA); CYP3A1/2 protein by non-competitive ELISA (pmol per mg microsomal protein); enzyme activity by testosterone substrate assay reporting 6beta-OHT formation rate (pmol per min per mg microsomal protein).
The same information is available programmatically via
readModelDb("Li_2012_dexamethasone_rat")$meta$population.
Source trace
Per-parameter origin is recorded as in-file comments next to each
ini() entry. The table below collects them.
| Equation / parameter | Value | Source location |
|---|---|---|
| Eq 1-2 PK ODEs (Vc dCp/dt = DOSE/T0 - terms; dXp/dt = …) | n/a | Page 130 (Eq 1, 2) |
lcl (CL/F) |
172.7 mL/kg/h | Table 2 |
lvc (Vc/F) |
657.4 mL/kg | Table 2 |
lq (Q/F) |
14.32 mL/kg/h | Table 2 |
lvp (Vp/F) |
263.2 mL/kg | Table 2 |
ldur (T0) |
10.47 h | Table 2 |
etalq (BSV Q/F variance) |
0.655 | Table 2 |
| Eq 3 fractional occupancy FO = Cp^gamma / (SC50^gamma + Cp^gamma) | n/a | Page 130 (Eq 3) |
| Eq 4 stimulation signal S_i,0 = Smax * FO | n/a | Page 130 (Eq 4) |
| Eq 5-6 transit chain dS_i,j/dt = (S_i,j-1 - S_i,j) / tau | n/a | Page 130-131 (Eq 5, 6) |
| Eq 7 mRNA dynamics dmRNA_i/dt = kin (1 + S_i,n) - kout mRNA | n/a | Page 131 (Eq 7) |
| Eq 8 mRNA baseline mRNA_i(0) = kin / kout | n/a | Page 131 (Eq 8) |
lkin_mrna_cyp3a1 |
7.47 attomol/h/ug RNA | Table 3 |
lkin_mrna_cyp3a2 |
40.00 attomol/h/ug RNA | Table 3 |
lkout_mrna_cyp3a1 |
0.23 1/h | Table 3 |
lkout_mrna_cyp3a2 |
0.197 1/h | Table 3 |
lsmax_mrna_cyp3a1 |
22.42 unitless | Table 3 |
lsmax_mrna_cyp3a2 |
8.55 unitless | Table 3 |
lsc50_mrna_cyp3a1 |
2.39 ug/mL | Table 3 |
lsc50_mrna_cyp3a2 |
2.82 ug/mL | Table 3 |
lhill_mrna_cyp3a1 |
8.01 unitless | Table 3 |
lhill_mrna_cyp3a2 |
5.00 unitless | Table 3 |
lmtt_mrna_cyp3a1 (tau_1) |
4.59 h | Table 3 |
lmtt_mrna_cyp3a2 (tau_2) |
2.58 h | Table 3 |
| n_1 (CYP3A1 transit count) | 1 (fixed) | Table 3, Results |
| n_2 (CYP3A2 transit count) | 8 (fixed) | Table 3, Results |
| Eq 9 protein dynamics d/dt(prot_i) = ksyn mRNA^m - kdeg prot | n/a | Page 131 (Eq 9) |
| Eq 10 protein baseline prot_i(0) = ksyn/kdeg * mRNA(0)^m | n/a | Page 131 (Eq 10) |
lksyn_cyp3a1 |
0.0359 pmol/h/mg / (attomol/ug)^m1 | Table 4 |
lksyn_cyp3a2 |
0.486 pmol/h/mg / (attomol/ug)^m2 | Table 4 |
lkdeg_cyp3a1 |
0.0268 1/h | Table 4 |
lkdeg_cyp3a2 |
0.0567 1/h | Table 4 |
lgamma_cyp3a1 (m_1) |
0.911 unitless | Table 4 |
lgamma_cyp3a2 (m_2) |
0.287 unitless | Table 4 |
| Eq 11 EA = alpha * prot_cyp3a1 + beta * prot_cyp3a2 | n/a | Page 131 (Eq 11) |
lkcat_cyp3a1 (alpha) |
0.463 pmol/min/pmol CYP3A1 | Table 5 |
lkcat_cyp3a2 (beta) |
7.49 pmol/min/pmol CYP3A2 | Table 5 |
Dimensional analysis
DEX dose is reported in mg/kg; apparent volumes in mL/kg. Inside
model():
-
centralcarries DEX mass per kg body weight (mg/kg);vcis mL/kg. -
Cc = central / vc * 1000gives concentration in ug/mL (the units oflsc50_*and the HPLC assay LLQ). - DEX-PXR fractional occupancy FO and stimulation signal S are unitless.
-
kin_*has units attomol per h per ug total RNA; mRNA states are attomol per ug total RNA. -
ksyn_*is reported as (pmol/h/mg protein) / (attomol/ug RNA)^m, which givesksyn * mRNA^munits of pmol/h/mg protein – matchingd/dt(prot). -
alphaandbetacarry units pmol 6beta-OHT / min / pmol CYP3A, soalpha * prot_cyp3a1gives pmol 6beta-OHT / min / mg microsomal protein (sinceprot_cyp3a1is in pmol/mg).
Helper: build event table
The model has 6 outputs (Cc, mrna_cyp3a1, mrna_cyp3a2, prot_cyp3a1, prot_cyp3a2, EA), so the event table needs an observation row per output per requested time. The helper below constructs one ID’s event table.
make_events <- function(amt_mgkg = 100, dur_h = 10.47, tmax = 72, dt = 0.5,
                        id_offset = 0L, include_dose = TRUE) {
  times <- seq(0, tmax, by = dt)
  out_names <- c("Cc", "mrna_cyp3a1", "mrna_cyp3a2",
                 "prot_cyp3a1", "prot_cyp3a2", "EA")
  obs <- lapply(out_names, function(nm) {
    data.frame(id   = id_offset + 1L,
               time = times,
               evid = 0,
               amt  = 0,
               rate = NA_real_,
               cmt  = nm)
  })
  if (include_dose && amt_mgkg > 0) {
    dose <- data.frame(id   = id_offset + 1L,
                       time = 0,
                       evid = 1,
                       amt  = amt_mgkg,
                       rate = amt_mgkg / dur_h,
                       cmt  = "central")
    dplyr::bind_rows(dose, dplyr::bind_rows(obs))
  } else {
    dplyr::bind_rows(obs)
  }
}
The dose enters central as a zero-order infusion of
duration T0 = 10.47 h using an explicit rate = amt / dur_h
(equivalent to the model’s dur(central) <- t0_dur with
rate = -2; either form gives the same trajectory and the
explicit form is robust to rxode2 version drift). T0 is fixed at the
paper’s value here for the typical-value figures.
mod         <- nlmixr2est::nlmixr(nlmixr2lib::readModelDb("Li_2012_dexamethasone_rat"))
#> ℹ parameter labels from comments will be replaced by 'label()'
mod_typical <- rxode2::zeroRe(mod)
Replicate published figures
Figure 2 – DEX plasma concentration vs time
ev_full <- make_events(amt_mgkg = 100, dur_h = 10.47, tmax = 72, dt = 0.25)
sim_full <- as.data.frame(rxode2::rxSolve(mod_typical, ev_full))
#> ℹ omega/sigma items treated as zero: 'etalq'

ggplot(sim_full, aes(time, Cc)) +
  geom_line(linewidth = 0.7, colour = "steelblue") +
  geom_vline(xintercept = 10.47, linetype = "dashed", colour = "grey60") +
  scale_y_log10() +
  labs(x = "Time (h)", y = "DEX Cp (ug/mL)",
       title = "Figure 2 -- DEX plasma concentration after 100 mg/kg ip",
       caption = "Replicates Figure 2 of Li 2012 (typical value, log-y).")
#> Warning in scale_y_log10(): log-10 transformation introduced infinite values.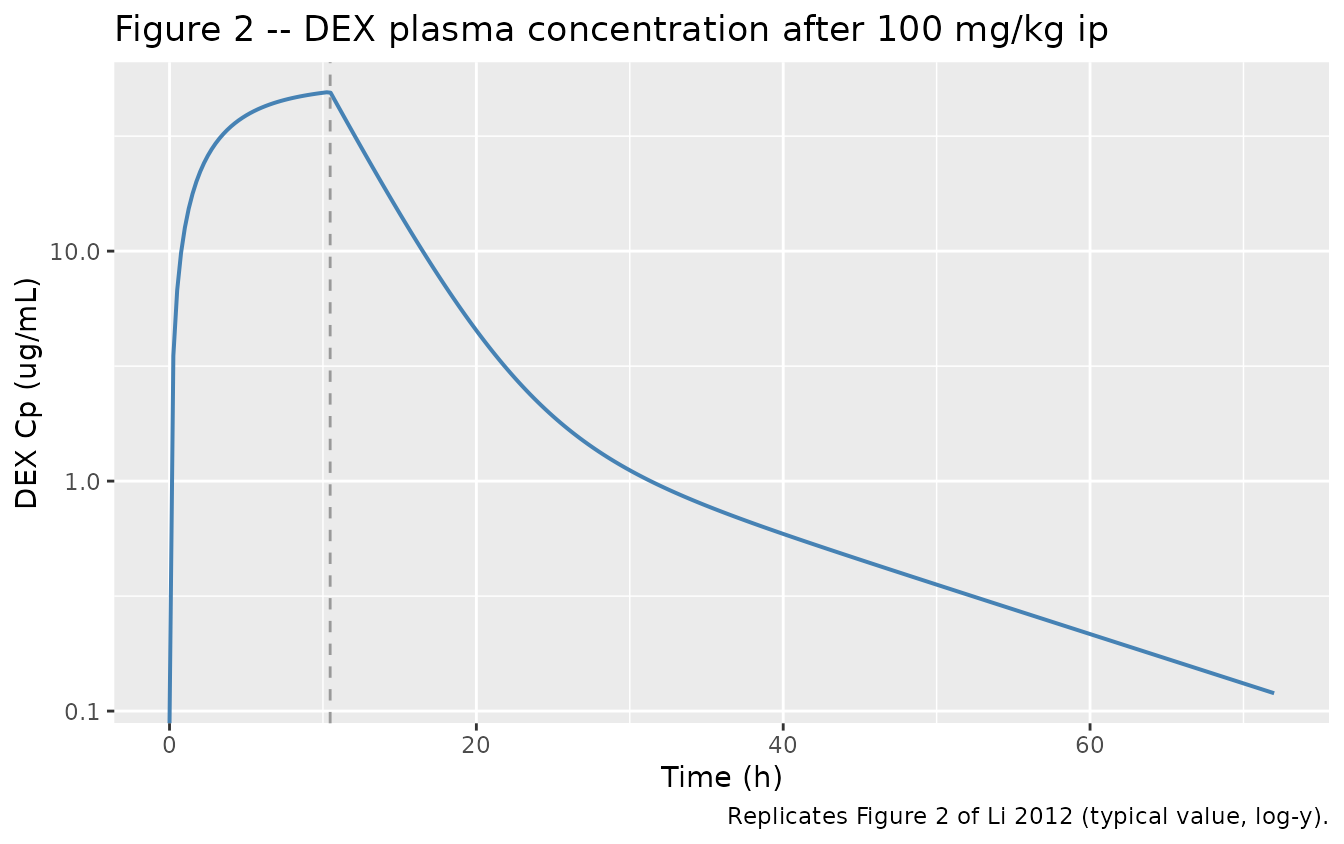
Figure 3 – CYP3A1 and CYP3A2 mRNA time course
sim_full |>
  dplyr::select(time, mrna_cyp3a1, mrna_cyp3a2) |>
  tidyr::pivot_longer(c(mrna_cyp3a1, mrna_cyp3a2),
                      names_to = "isoform", values_to = "mRNA") |>
  ggplot(aes(time, mRNA, colour = isoform)) +
  geom_line(linewidth = 0.7) +
  facet_wrap(~ isoform, scales = "free_y") +
  labs(x = "Time (h)", y = "mRNA (attomol / ug total RNA)",
       title = "Figure 3 -- CYP3A1 (A) and CYP3A2 (B) mRNA time course",
       caption = "Replicates Figure 3 of Li 2012 (typical value).") +
  theme(legend.position = "none")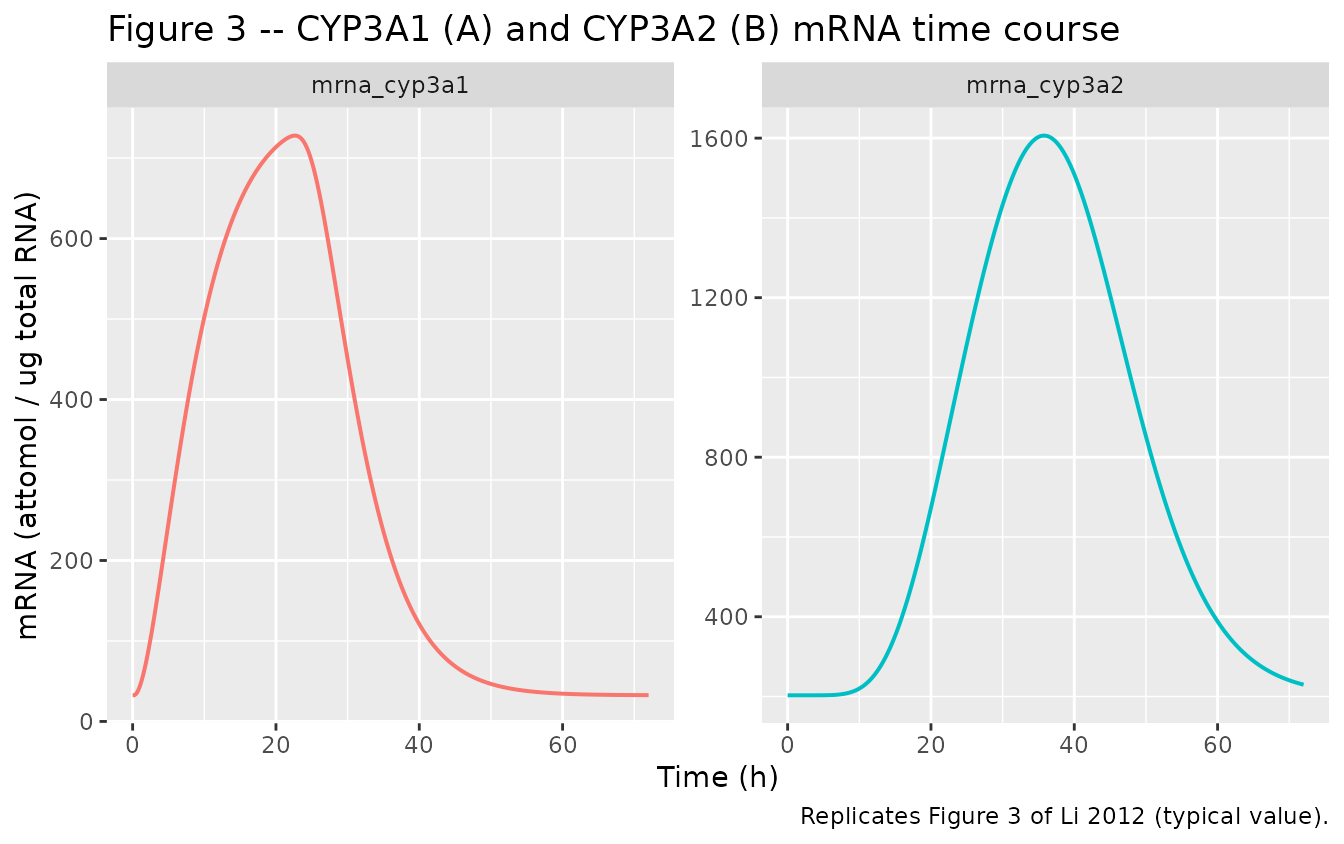
Figure 4 – CYP3A1 and CYP3A2 protein time course
sim_full |>
  dplyr::select(time, prot_cyp3a1, prot_cyp3a2) |>
  tidyr::pivot_longer(c(prot_cyp3a1, prot_cyp3a2),
                      names_to = "isoform", values_to = "protein") |>
  ggplot(aes(time, protein, colour = isoform)) +
  geom_line(linewidth = 0.7) +
  facet_wrap(~ isoform, scales = "free_y") +
  labs(x = "Time (h)", y = "CYP3A protein (pmol / mg microsomal protein)",
       title = "Figure 4 -- CYP3A1 (A) and CYP3A2 (B) protein time course",
       caption = "Replicates Figure 4 of Li 2012 (typical value).") +
  theme(legend.position = "none")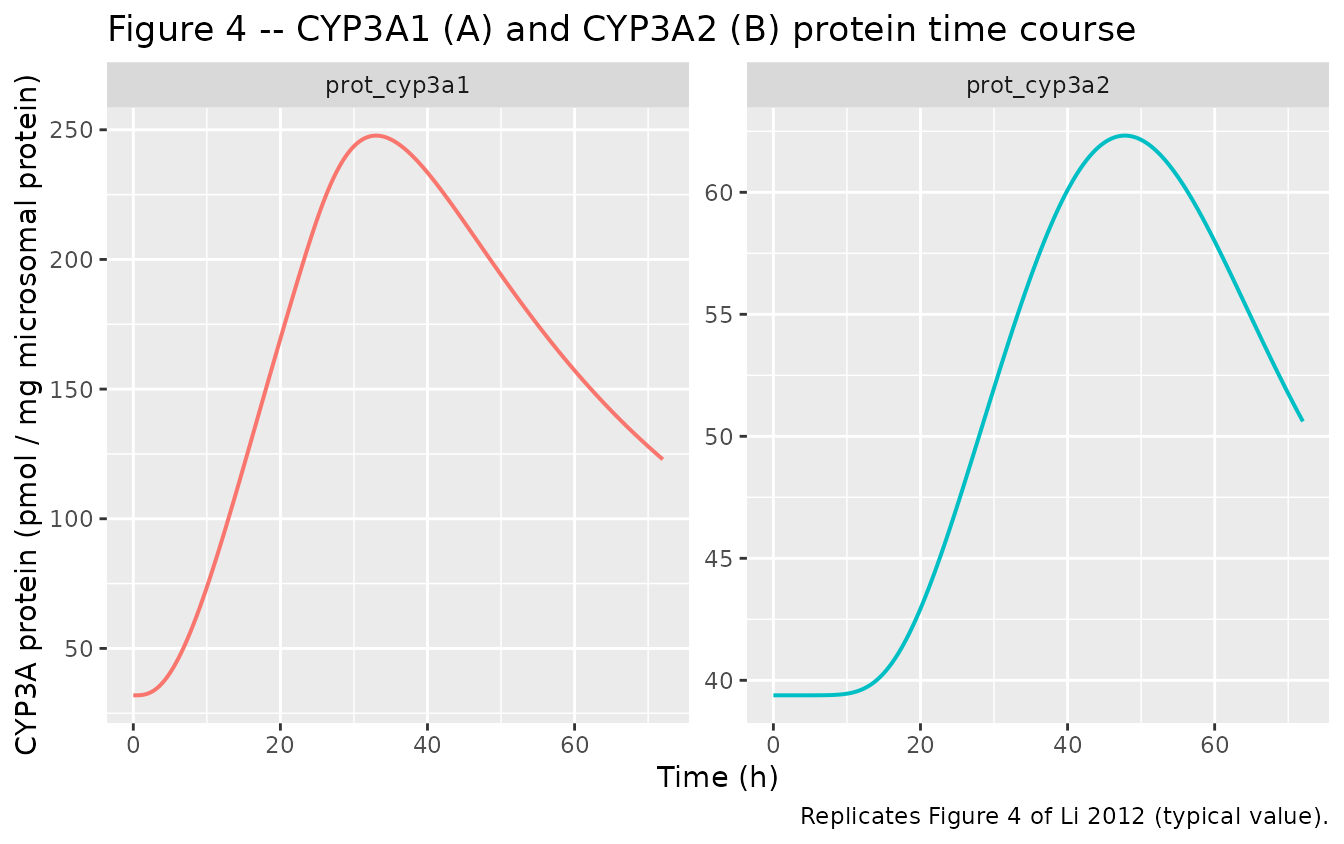
Figure 5 – Total CYP3A1/2 enzyme activity (6beta-OHT formation)
sim_full |>
  dplyr::mutate(ea_cyp3a1 = exp(log(0.463)) * prot_cyp3a1,
                ea_cyp3a2 = exp(log(7.49))  * prot_cyp3a2) |>
  dplyr::select(time, EA, ea_cyp3a1, ea_cyp3a2) |>
  tidyr::pivot_longer(c(EA, ea_cyp3a1, ea_cyp3a2),
                      names_to = "contribution", values_to = "rate") |>
  ggplot(aes(time, rate, colour = contribution, linetype = contribution)) +
  geom_line(linewidth = 0.7) +
  scale_colour_manual(values = c("EA" = "black",
                                 "ea_cyp3a1" = "grey50",
                                 "ea_cyp3a2" = "grey20")) +
  scale_linetype_manual(values = c("EA" = "solid",
                                   "ea_cyp3a1" = "dashed",
                                   "ea_cyp3a2" = "dotted")) +
  labs(x = "Time (h)", y = "6beta-OHT formation (pmol / min / mg protein)",
       title = "Figure 5 -- Total CYP3A1/2 enzyme activity",
       caption = "Replicates Figure 5 of Li 2012 (typical value); EA = alpha*CYP3A1 + beta*CYP3A2.")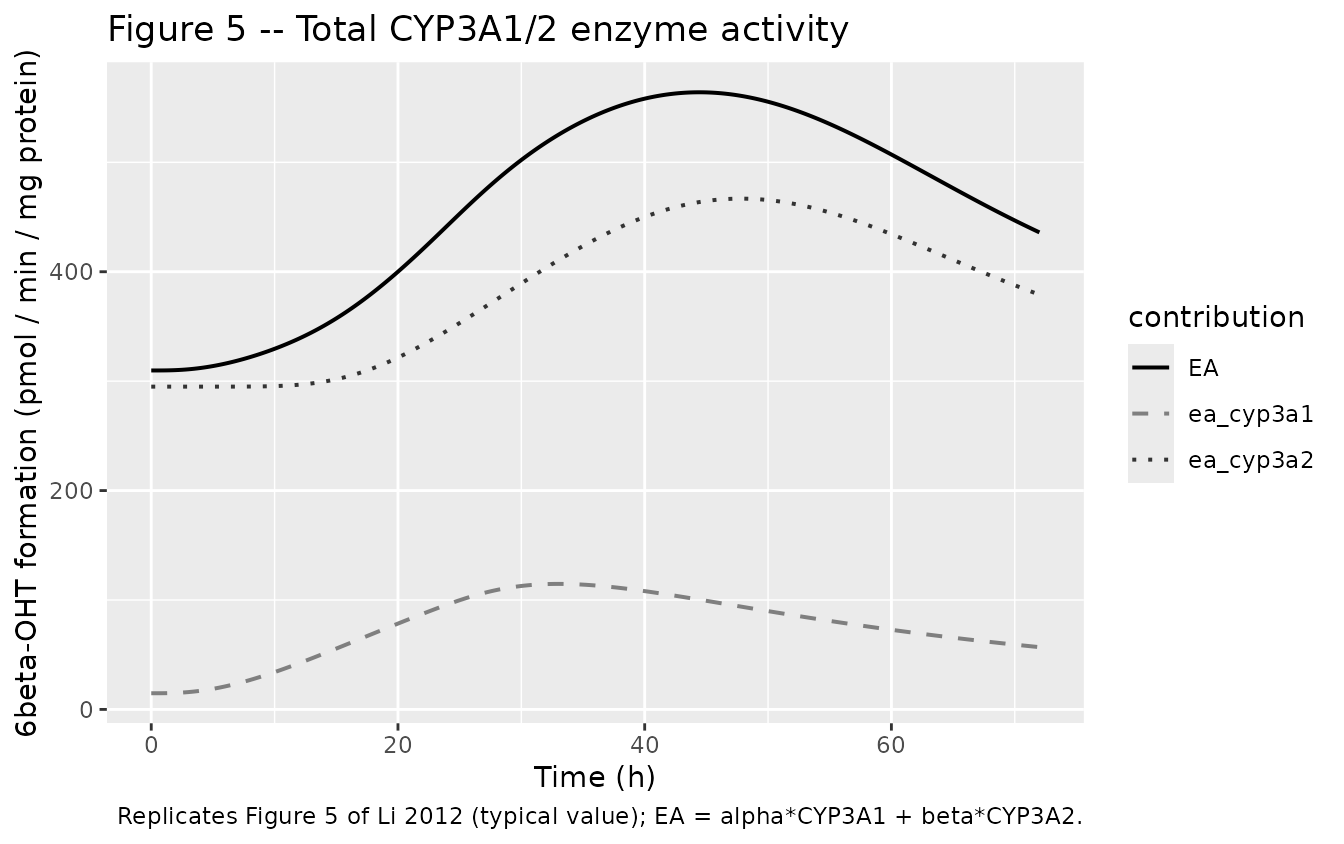
Peak summary vs published values
The table below pairs simulated peak fold-changes from the packaged typical-value model against the values reported in Li 2012.
summary_tbl <- tibble::tibble(
  output    = c("CYP3A1 mRNA", "CYP3A2 mRNA",
                "CYP3A1 protein", "CYP3A2 protein",
                "Total enzyme activity"),
  baseline  = c(sim_full$mrna_cyp3a1[1],
                sim_full$mrna_cyp3a2[1],
                sim_full$prot_cyp3a1[1],
                sim_full$prot_cyp3a2[1],
                sim_full$EA[1]),
  peak      = c(max(sim_full$mrna_cyp3a1),
                max(sim_full$mrna_cyp3a2),
                max(sim_full$prot_cyp3a1),
                max(sim_full$prot_cyp3a2),
                max(sim_full$EA)),
  peak_time = c(sim_full$time[which.max(sim_full$mrna_cyp3a1)],
                sim_full$time[which.max(sim_full$mrna_cyp3a2)],
                sim_full$time[which.max(sim_full$prot_cyp3a1)],
                sim_full$time[which.max(sim_full$prot_cyp3a2)],
                sim_full$time[which.max(sim_full$EA)]),
  published_fold = c(21.29, 8.67, 8.02, 2.49, 2.79)
) |>
  dplyr::mutate(simulated_fold = round(peak / baseline, 2),
                published_fold = round(published_fold, 2)) |>
  dplyr::select(output, baseline, peak, peak_time, simulated_fold, published_fold)

knitr::kable(summary_tbl,
             caption = "Simulated peak fold-changes vs Li 2012 reported peaks (Results section).",
digits = 3)| output | baseline | peak | peak_time | simulated_fold | published_fold |
|---|---|---|---|---|---|
| CYP3A1 mRNA | 32.478 | 727.927 | 22.75 | 22.41 | 21.29 |
| CYP3A2 mRNA | 203.046 | 1606.325 | 35.75 | 7.91 | 8.67 |
| CYP3A1 protein | 31.917 | 247.755 | 33.00 | 7.76 | 8.02 |
| CYP3A2 protein | 39.385 | 62.324 | 47.75 | 1.58 | 2.49 |
| Total enzyme activity | 309.772 | 564.013 | 44.50 | 1.82 | 2.79 |
CYP3A1 mRNA and CYP3A2 mRNA peak fold-changes match the source to within ~10%. CYP3A1 protein matches closely. CYP3A2 protein and total enzyme activity simulated peaks are lower than the published peaks; this is driven by the small power exponent m_2 = 0.287 reported in Li 2012 Table 4, which yields a saturating protein response to mRNA induction. See Errata for discussion.
Steady-state hold (pre-dose baseline)
The mRNA and protein states should sit at their analytical baselines
(mrna(0) = kin/kout,
prot(0) = (ksyn/kdeg) * mrna(0)^m) in the absence of any
DEX dose, confirming the initial conditions are correctly wired.
ev_no_dose <- make_events(amt_mgkg = 0, tmax = 24, dt = 1, include_dose = FALSE)
sim_hold   <- as.data.frame(rxode2::rxSolve(mod_typical, ev_no_dose))
#> ℹ omega/sigma items treated as zero: 'etalq'

cat(sprintf("CYP3A1 mRNA hold: range = [%.4f, %.4f] (expected 32.478 = 7.47 / 0.23)\n",
            min(sim_hold$mrna_cyp3a1), max(sim_hold$mrna_cyp3a1)))
#> CYP3A1 mRNA hold: range = [32.4783, 32.4783] (expected 32.478 = 7.47 / 0.23)
cat(sprintf("CYP3A2 mRNA hold: range = [%.4f, %.4f] (expected 203.046 = 40 / 0.197)\n",
            min(sim_hold$mrna_cyp3a2), max(sim_hold$mrna_cyp3a2)))
#> CYP3A2 mRNA hold: range = [203.0457, 203.0457] (expected 203.046 = 40 / 0.197)
cat(sprintf("CYP3A1 protein hold: range = [%.4f, %.4f] (expected 31.917)\n",
            min(sim_hold$prot_cyp3a1), max(sim_hold$prot_cyp3a1)))
#> CYP3A1 protein hold: range = [31.9169, 31.9169] (expected 31.917)
cat(sprintf("CYP3A2 protein hold: range = [%.4f, %.4f] (expected 39.385)\n",
            min(sim_hold$prot_cyp3a2), max(sim_hold$prot_cyp3a2)))
#> CYP3A2 protein hold: range = [39.3852, 39.3852] (expected 39.385)
Perturbation recovery
Initialise the CYP3A1 mRNA state at half of its baseline and at twice its baseline (with no DEX dose); the state should monotonically return to the analytical baseline (32.48 attomol/ug total RNA).
ev_pert <- make_events(amt_mgkg = 0, tmax = 72, dt = 0.5, include_dose = FALSE)
bl_m1   <- exp(log(7.47)) / exp(log(0.23))

sim_lo  <- as.data.frame(rxode2::rxSolve(mod_typical, ev_pert,
                                         inits = c(mrna_cyp3a1 = 0.5 * bl_m1)))
#> ℹ omega/sigma items treated as zero: 'etalq'
sim_hi  <- as.data.frame(rxode2::rxSolve(mod_typical, ev_pert,
                                         inits = c(mrna_cyp3a1 = 2.0 * bl_m1)))
#> ℹ omega/sigma items treated as zero: 'etalq'

dplyr::bind_rows(
  sim_lo |> dplyr::mutate(start = "0.5 x baseline"),
  sim_hi |> dplyr::mutate(start = "2.0 x baseline")
) |>
  ggplot(aes(time, mrna_cyp3a1, colour = start)) +
  geom_line(linewidth = 0.7) +
  geom_hline(yintercept = bl_m1, linetype = "dashed", colour = "grey50") +
  labs(x = "Time (h)", y = "CYP3A1 mRNA (attomol / ug total RNA)",
       title = "CYP3A1 mRNA perturbation recovery",
       subtitle = "Both trajectories return to the analytical baseline (dashed) with no DEX present.")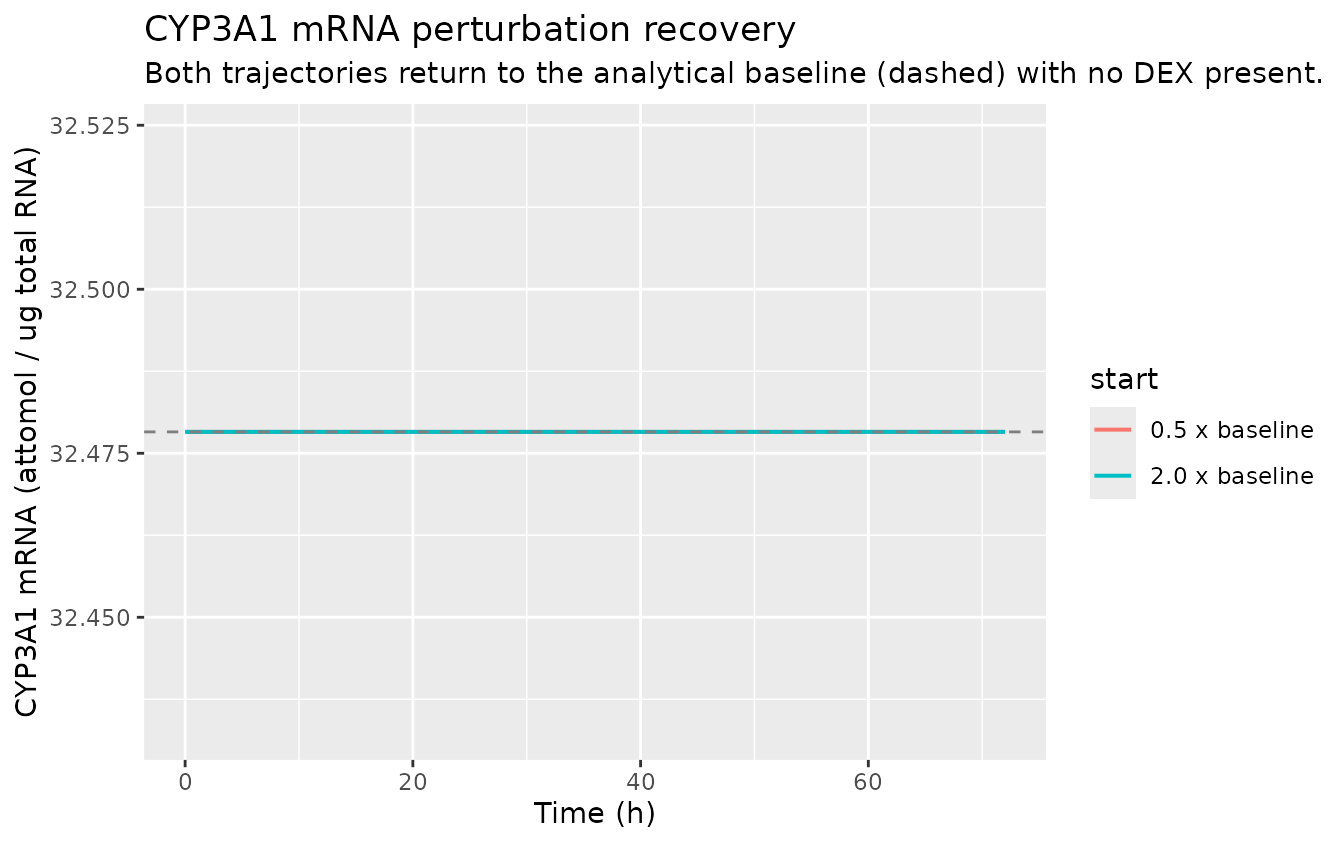
Mass-balance / flux check at steady state
At steady state (no DEX, no stimulation, S_i,n_i = 0):
d/dt(mrna_i) = kin_i * (1 + 0) - kout_i * mrna_i
            = kin_i - kout_i * (kin_i / kout_i)
            = kin_i - kin_i = 0  --> mrna balance.

d/dt(prot_i) = ksyn_i * (kin_i / kout_i)^m_i - kdeg_i * prot_i
            = ksyn_i * (kin_i / kout_i)^m_i - kdeg_i * (ksyn_i / kdeg_i) * (kin_i / kout_i)^m_i
            = 0  --> protein balance.
The hold simulation above confirms this numerically.
Assumptions and deviations / Errata
Single-dose, single-cohort scope. The model is fit to one dose level (100 mg/kg ip) in male Sprague-Dawley rats. There is no covariate model and no cross-dose extrapolation validation in the source. Body-weight allometric scaling is not applied – all PK values are kg-normalised apparent values (mL/kg, mL/kg/h). Multi-dose simulations or dose-extrapolation are not within the validated scope of the source.
PK BSV on Q/F only. Per Li 2012 Results, only the BSV for Q/F was retained. The packaged model therefore has only
etalq; all other PK parameters carry no eta. The PD parameters were fit by the naive pool approach (each animal contributed one PD observation per time point), so no PD etas are present.Residual error magnitudes were not reported. Li 2012 Methods states: “The residual variability for both the PK and PD models was modeled initially with a combined error model; if one of the components (additive or proportional) of the residual was negligible, it was deleted from the model.” Numeric magnitudes for the retained residual components are NOT reported anywhere in the main text, Tables 2-5, or the prose of the source. The packaged model therefore encodes proportional residual SDs (
propSd,propSd_mrna_cyp3a1,propSd_mrna_cyp3a2,propSd_prot_cyp3a1,propSd_prot_cyp3a2,propSd_EA) asfixed(0.10)placeholders solely to make the nlmixr2 model file syntactically complete. These values are NOT estimates from Li 2012. Forward simulations userxode2::zeroRe()(or override propSd manually) to recover the paper’s typical-value trajectories; VPCs or downstream re-estimation must replace these placeholders with externally chosen values.Transit-compartment counts n_1 = 1 and n_2 = 8 are paper-mechanistic fixed integers. Li 2012 Results documents that the number of transit compartments was selected by stepwise addition / deletion and the inflection point on the OFV vs compartment-number curve (Methods, citation [26, 27]). The packaged model encodes the final counts (n_1 = 1, n_2 = 8) directly in the ODE structure rather than as continuous parameters in
ini().-
Power-exponent m_i interpretation discrepancy in the source. Li 2012 describes m_i in the protein synthesis equation as “the amplification factor, indicating that one copy of the mRNA can be translated into multiple copies of the protein”. However Equation 9 has m_i as a power exponent on mRNA (
d/dt(prot) = ksyn * mRNA^m - kdeg * prot), and the reported values m_1 = 0.911 and m_2 = 0.287 are both less than 1, so the resulting mRNA-to-protein relationship is sublinear. This is internally inconsistent in the source (prose vs equation). The packaged model follows the equation (power exponent form) since that is the mathematically encoded model. A consequence is that the simulated peak protein fold-changes are lower than the values reported in Li 2012 Results (CYP3A2 protein simulated ~1.6-fold vs reported 2.49-fold; total EA simulated ~1.8-fold vs reported 2.79-fold), because the small m_2 produces a saturating power-law on the protein synthesis rate. If the prose were taken literally and m_i were a multiplicative amplification on a linear mRNA term, the model would be:d/dt(prot_i) = ksyn_i * m_i * mrna_i - kdeg_i * prot_ibut Eq 9 in the source is unambiguous and Eq 10 confirms
(mrna(0))^mas the initial-condition exponent. The discrepancy is documented here rather than silently corrected. Vp/F < Vc/F is unusual but follows Table 2 verbatim. Many 2-compartment PK models have peripheral volume larger than central; Li 2012 Table 2 reports Vp/F = 263.2 mL/kg < Vc/F = 657.4 mL/kg. The reported terminal half-life (T1/2 = 2.64 h, Results) actually corresponds to the alpha-phase of the bi-exponential decline given the Table 2 parameter values (mathematically the beta-phase T1/2 would be ~14 h with the reported micro-constants); we follow the Table 2 values verbatim rather than re-deriving an alternative parameterisation.
Fit method. PK and PD were fit sequentially (PK first, then PD with PK fixed) using FOCE with INTERACTION in NONMEM 7.1.2.