Rilotumumab (Zhang 2016)
Source:vignettes/articles/Zhang_2016_rilotumumab.Rmd
Zhang_2016_rilotumumab.RmdModel and source
- Citation: Zhang Y, Kondragunta V, Han T-H, Dimopoulos M, Padval M, Klempner SJ, Wagner AD, Kallinteris NL, Doi T, Ohtsu A, et al. Assessment of pharmacokinetic interaction between rilotumumab and epirubicin, cisplatin and capecitabine (ECX) in a Phase 3 study in gastric cancer. Br J Clin Pharmacol. 2017;83(5):1048-1055. doi:[10.1111/bcp.13179](https://doi.org/10.1111/bcp.13179).
- Upstream popPK source (parameters inherited from): Zhu M, Doshi S, Gisleskog PO, Oliner KS, Perez Ruixo JJ, Loh E, Perez-Ruixo JJ. Population pharmacokinetics of rilotumumab, a fully human monoclonal antibody against hepatocyte growth factor, in cancer patients. J Pharm Sci. 2014;103(1):328-336. doi:[10.1002/jps.23763](https://doi.org/10.1002/jps.23763).
- Modality: Fully human IgG2 monoclonal antibody against hepatocyte growth factor (HGF). IV infusion.
Rilotumumab neutralises HGF and thereby blocks its binding to the MET
receptor (Zhang 2016, Introduction). Zhang 2016 is a Phase 3
(NCT00719550) DDI assessment that pairs rilotumumab with the epirubicin
/ cisplatin / capecitabine (ECX) regimen in MET-positive gastric / GEJ
adenocarcinoma and uses the previously developed Zhu 2014 popPK model to
perform an external prediction-corrected visual predictive check on
rilotumumab serum concentrations from the Phase 3 cohort. The conclusion
was no ECX-rilotumumab PK interaction. Zhang 2016 reports the
Zhu 2014 final- model typical-value point estimates and IIV %CV verbatim
but does not reproduce the covariate equations or the residual error
model – those live in Zhu 2014. The Zhang 2016 model file
therefore encodes only the structural two-compartment skeleton and the
four IIV terms; the upstream Zhu_2014_rilotumumab
extraction (ingestion task 127) will carry the full covariate model and
residual error specification.
Structure: linear two-compartment IV model with first-order
elimination from the central compartment, parameterised by
CL, Vc, Q, and Vp
(Zhang 2016, Methods page 1050).
Population
The Phase 3 cohort that informed the rilotumumab serum concentrations used for the external VPC (Zhang 2016, Results page 1050):
- N = 279 patients with measured rilotumumab concentrations (53 with intensive PK sampling, 226 with sparse PK sampling).
- 1460 serum concentration records included in the population PK evaluation (34 excluded as outliers or below quantitation).
- Age 19-85 years (median 59).
- Body weight 39-120 kg (median 69 kg).
- Disease: unresectable, locally advanced or metastatic MET-positive gastric or GEJ adenocarcinoma (tumour membrane staining >= 25% by central immunohistochemistry).
- Treatment: rilotumumab 15 mg/kg IV every 3 weeks in combination with epirubicin 50 mg/m^2 IV bolus Q3W, cisplatin 60 mg/m^2 IV infusion Q3W, and capecitabine 625 mg/m^2 orally twice daily.
The Zhu 2014 estimation dataset (the source of the structural parameter values themselves) pooled seven Phase 1 and Phase 2 studies; the Phase 3 ranges above fall within the Zhu 2014 covariate ranges (Zhang 2016, Results page 1050).
The same metadata is available programmatically via
readModelDb("Zhang_2016_rilotumumab")()$meta$population.
Source trace
The per-parameter origin is recorded as an in-file comment next to
each ini() entry in
inst/modeldb/specificDrugs/Zhang_2016_rilotumumab.R. The
table below collects them in one place for review.
| Parameter / equation | Value | Source |
|---|---|---|
| Structural model | 2-compartment IV | Zhang 2016 Methods, p1050 (“base model was a two-compartment model”) |
lcl (CL, L/day) |
log(0.184) | Zhang 2016 Results, p1053 (CL 0.184 L/day, RSE 2.5%) |
lvc (Vc, L) |
log(3.56) | Zhang 2016 Results, p1053 (V1 = Vc 3.56 L, RSE 1.5%) |
lq (Q, L/day) |
log(0.833) | Zhang 2016 Results, p1053 (Q 0.833 L/day, RSE 12.3%) |
lvp (Vp, L) |
log(2.50) | Zhang 2016 Results, p1053 (Vp 2.50 L, RSE 6.8%) |
etalcl (omega^2) |
0.0851 | Zhang 2016 Results, p1053 (CL CV 29.8%; omega^2 = log(1 + CV^2)) |
etalvc (omega^2) |
0.0385 | Zhang 2016 Results, p1053 (Vc CV 19.8%) |
etalq (omega^2) |
0.4082 | Zhang 2016 Results, p1053 (Q CV 71.0%) |
etalvp (omega^2) |
0.1303 | Zhang 2016 Results, p1053 (Vp CV 37.3%; the source labels this V2) |
| Covariates: WT, AGE | not encoded | Zhang 2016 Results, p1053 (“Body weight and age are the significant covariates … and were included in the final model”); coefficients not reported in Zhang 2016 |
| Residual error | not encoded | Zhang 2016 does not report the residual error model |
ODEs: standard 2-compartment IV
(dC1/dt = -kel * C1 - k12 * C1 + k21 * C2,
dC2/dt = k12 * C1 - k21 * C2) with
kel = CL/Vc, k12 = Q/Vc,
k21 = Q/Vp (Zhang 2016 Methods, page 1050).
Virtual cohort
Original observed data are not publicly available. The simulations below use a virtual cohort whose body-weight distribution approximates the Phase 3 cohort summary (median 69 kg, range 39-120 kg; Zhang 2016 page 1050). Body weight enters the simulation only through the per- subject mg/kg dose computation, since the model file does not encode the Zhu 2014 weight covariate effect on CL or Vc.
set.seed(2016)
n_subj <- 200

cohort <- tibble(
  ID = seq_len(n_subj),
  WT = pmin(pmax(rlnorm(n_subj, log(69), 0.21), 39), 120)
)

summary(cohort$WT)
#>    Min. 1st Qu.  Median    Mean 3rd Qu.    Max.
#>   39.00   59.72   68.83   70.92   79.90  120.00
The Q3W rilotumumab dosing regimen (15 mg/kg IV) is simulated over six cycles (~3.5 months), spanning the cycles 1-7 PK sampling window of the study (Zhang 2016, Methods page 1050).
infusion_h    <- 1            # not stated in Zhang 2016; see Assumptions
dose_interval_d <- 21
n_doses         <- 6
dose_times_d    <- seq(0, by = dose_interval_d, length.out = n_doses)
obs_times_d     <- sort(unique(c(
  dose_times_d,
  dose_times_d + infusion_h / 24,                          # end-of-infusion
  dose_times_d + 2 / 24,                                   # 2h post-start (cycle 1 IPK)
  dose_times_d + 24 / 24,                                  # 24h post-start (cycle 1 IPK)
  seq(0, dose_interval_d * n_doses, by = 0.25)             # dense grid for plots
)))

events <- cohort |>
  dplyr::mutate(amt_mg = WT * 15) |>
  tidyr::crossing(TIME = dose_times_d) |>
  dplyr::mutate(EVID = 1, CMT = "central", DUR = infusion_h / 24,
                AMT = amt_mg, DV = NA_real_) |>
  dplyr::bind_rows(
    cohort |>
      tidyr::crossing(TIME = obs_times_d) |>
      dplyr::mutate(EVID = 0, CMT = "central", DUR = NA_real_,
                    AMT = NA_real_, DV = NA_real_)
  ) |>
  dplyr::arrange(ID, TIME, dplyr::desc(EVID)) |>
  dplyr::rename(id = ID) |>
  as.data.frame()
Simulation
mod <- readModelDb("Zhang_2016_rilotumumab")
sim <- rxode2::rxSolve(mod, events = events, returnType = "data.frame")
Concentration-time profile and VPC-style summary
Zhang 2016 Figure 5 shows observed rilotumumab concentrations overlaid with the 95% prediction interval and median from the Zhu 2014 model. The figure below reproduces the median and 5-95% prediction interval from the packaged model at the Phase 3 cohort’s typical body weight, analogous to the shaded bands of the paper’s prediction-corrected VPC.
sim_summary <- sim |>
  dplyr::filter(time > 0, !is.na(Cc)) |>
  dplyr::group_by(time) |>
  dplyr::summarise(
    median = stats::median(Cc, na.rm = TRUE),
    lo     = stats::quantile(Cc, 0.05, na.rm = TRUE),
    hi     = stats::quantile(Cc, 0.95, na.rm = TRUE),
    .groups = "drop"
  )

ggplot(sim_summary, aes(time, median)) +
  geom_ribbon(aes(ymin = lo, ymax = hi), alpha = 0.25, fill = "steelblue") +
  geom_line(linewidth = 1, colour = "steelblue") +
  scale_y_log10() +
  labs(
    x = "Time since first dose (days)",
    y = "Rilotumumab serum concentration (ug/mL, log scale)",
    title = "Simulated rilotumumab PK: 15 mg/kg Q3W IV infusion",
    subtitle = paste0("Median and 90% prediction interval (N = ", n_subj,
                      " virtual patients)."),
    caption = "Replicates the prediction interval shape of Zhang 2016 Figure 5."
  ) +
  theme_bw()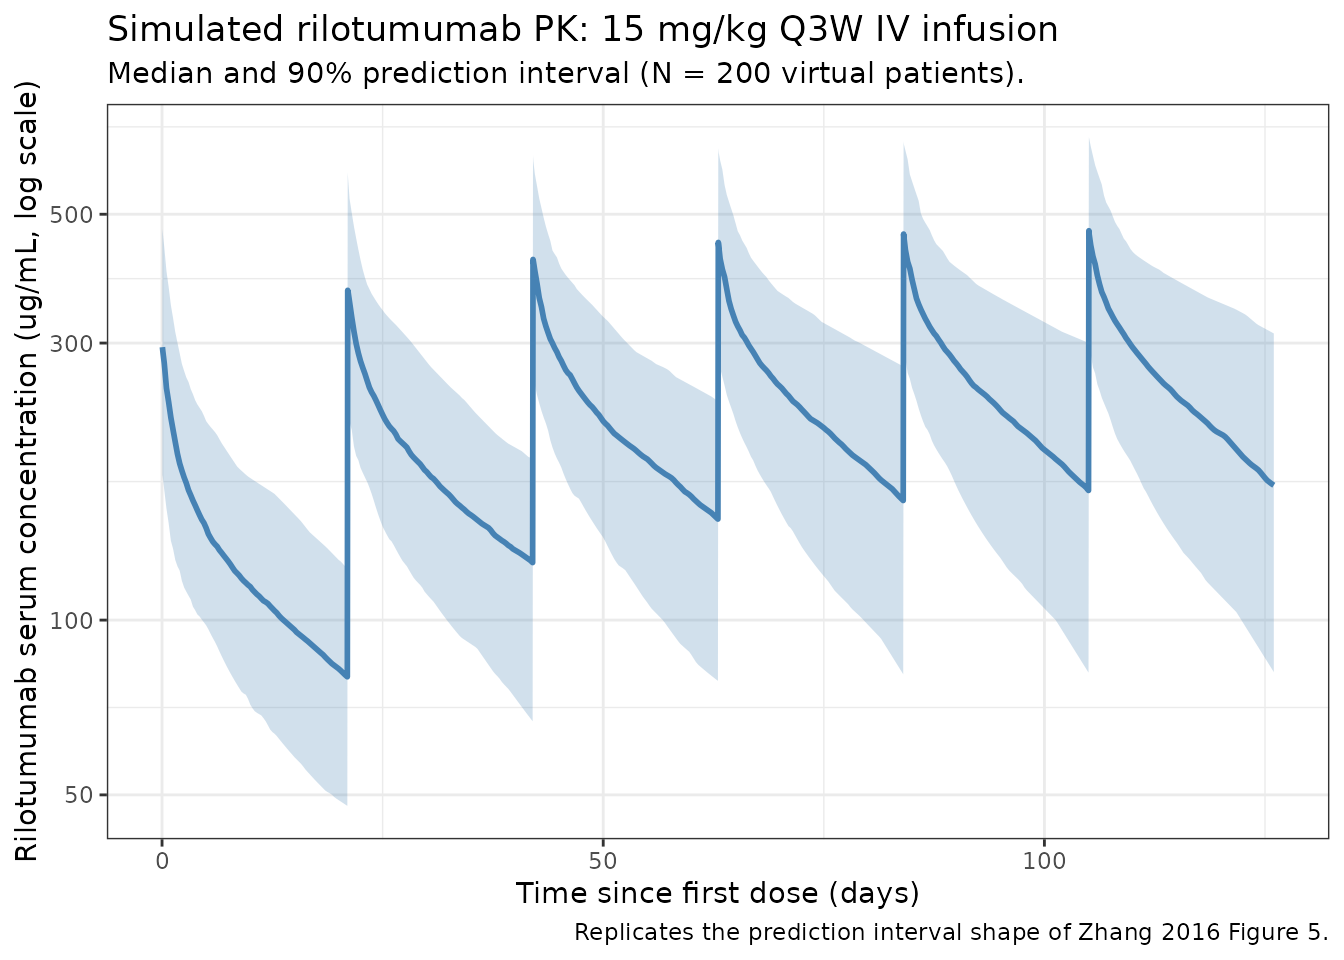
PKNCA validation
Zhang 2016 does not report tabulated NCA parameters for rilotumumab
(only ECX NCA metrics, which are out of scope for this rilotumumab
model). The PKNCA block below therefore runs a within-simulation
consistency check rather than a side-by-side comparison: it
confirms that the packaged model produces the expected steady-state
behaviour for a Q3W IV mAb (terminal half-life consistent with
0.693 * Vp / Q ~ 2 d and 0.693 / (CL/(Vc+Vp))
~ 23 d two-phase decay, accumulation factor at steady state ~ 1 / (1 -
exp(-kel_eff * tau))).
# Use the 6th (final) dosing interval as the steady-state approximation.
interval_start <- dose_times_d[n_doses]
interval_end   <- interval_start + dose_interval_d

sim_nca <- sim |>
  dplyr::filter(!is.na(Cc),
                time >= interval_start,
                time <= interval_end) |>
  dplyr::mutate(time_rel = time - interval_start,
                treatment = "15 mg/kg Q3W") |>
  dplyr::select(id, treatment, time_rel, Cc)

conc_obj <- PKNCA::PKNCAconc(sim_nca, Cc ~ time_rel | treatment + id)

dose_df <- events |>
  dplyr::filter(EVID == 1, TIME == interval_start) |>
  dplyr::transmute(
    id = id,
    treatment = "15 mg/kg Q3W",
    time_rel = 0,
    amt = AMT
  )

dose_obj <- PKNCA::PKNCAdose(dose_df, amt ~ time_rel | treatment + id)

intervals <- data.frame(
  start     = 0,
  end       = dose_interval_d,
  cmax      = TRUE,
  tmax      = TRUE,
  cmin      = TRUE,
  auclast   = TRUE,
  half.life = TRUE
)

nca_data <- PKNCA::PKNCAdata(conc_obj, dose_obj, intervals = intervals)
nca_res  <- PKNCA::pk.nca(nca_data)
knitr::kable(
  summary(nca_res),
  caption = "Simulated rilotumumab NCA parameters over the 6th (steady-state) dosing interval at 15 mg/kg Q3W."
)| start | end | treatment | N | auclast | cmax | cmin | tmax | half.life |
|---|---|---|---|---|---|---|---|---|
| 0 | 21 | 15 mg/kg Q3W | 200 | 5450 [34.8] | 472 [28.0] | 170 [44.3] | 0.0417 [0.0417, 0.0417] | 24.8 [7.91] |
Assumptions and deviations
- Body weight covariate effect on CL and Vc is not encoded. Zhang 2016 names body weight as a retained covariate in the Zhu 2014 final model but does not publish the covariate equation or the exponent estimates. The model file therefore produces CL and Vc predictions identical to the typical Zhu 2014 reference subject; the body weight column in the virtual cohort is used only to compute the per-subject mg/kg dose. The full covariate model lives in the upstream Zhu 2014 extraction (ingestion task 127).
- Age covariate effect is not encoded. Same rationale as for weight.
- Residual error model is not encoded. Zhang 2016 does not report the form (additive / proportional / combined) or magnitude of the rilotumumab residual error. Population predictions in Zhang 2016 Figure 5 were generated with the Zhu 2014 residual error; that value belongs in the Zhu_2014_rilotumumab extraction.
- Off-diagonal IIV correlations are not encoded. Zhang 2016 reports the four IIVs as %CV without an off-diagonal covariance matrix; the etas are therefore treated as independent. Any CL-Vc correlation block reported by Zhu 2014 should be added when that extraction is built.
- Infusion duration assumed 1 hour for the validation simulation. Zhang 2016 confirms an IV infusion regimen (PK samples were collected at “pre-dose, end of infusion (EOI), 2, 24, 168 and 336 h after start of infusion at cycle 1”) but does not state the infusion duration in the on-disk source. A 1-hour infusion is used here for the validation plot; the typical infusion duration for rilotumumab in Phase 1 / 2 / 3 trials should be verified against Zhu 2014 (or the protocol) when that extraction is built. The choice affects only the shape of the earliest post-infusion samples; AUC and steady-state Cmin / Cmax are unaffected.
Errata
The following minor notation slips were observed in the Zhang 2016 source while extracting the model. They do not change any numeric value but are recorded here so a reader inspecting the paper alongside this model file is not surprised.
- The Zhang 2016 Results section “Population PK results of rilotumumab” (page 1053) describes the structural model as > “parameterized by systemic clearance (CL), central volume of > distribution (V1), intercompartmental clearance (Q) and peripheral > volume of distribution (Vp)” and immediately afterward writes > “interindividual variabilities were 29.8%, 19.8%, 71.0% and 37.3% > for the model parameters CL, Vc, Q and V2, respectively.” The central volume is therefore called both V1 (in the typical-value list) and Vc (in the IIV list), and the peripheral volume is called both Vp (typical-value list) and V2 (IIV list). The four typical values and the four %CVs map unambiguously by position to CL, Vc, Q, and Vp.
- No published erratum or corrigendum was located on the journal landing page or via PubMed for this paper as of extraction (PMID 27966237).
Notes on use
This packaged model reproduces the structural two-compartment skeleton and the four IIV terms reported in Zhang 2016 verbatim. It is suitable for:
- Simulating typical-subject rilotumumab serum concentration profiles under Q3W IV dosing.
- Sampling random etas to generate VPC-style prediction intervals comparable to Zhang 2016 Figure 5.
It is not suitable for:
- Refitting against new data (no residual error model encoded).
- Covariate-stratified predictions by body weight or age (covariate equations not encoded; use the Zhu 2014 extraction when available).
The Zhu_2014_rilotumumab extraction (ingestion task 127) is the canonical source for the full popPK model including covariates and residual error.