Pyronaridine + artesunate lung and trachea exposure (Kang 2023)
Source:vignettes/articles/Kang_2023_pyronaridine_artesunate_hamster_pbpk.Rmd
Kang_2023_pyronaridine_artesunate_hamster_pbpk.RmdModel and source
Kang et al. (2023) developed two minimal physiologically-based pharmacokinetic (PBPK) models in golden hamsters to support repurposing of the antimalarial fixed-dose combination pyronaridine-artesunate (Pyramax) against SARS-CoV-2. Because the antiviral target organs are the lung and the trachea, both models carry those two tissues as explicit perfusion-rate-limited compartments and lump every other tissue into a single rest-of-body compartment.
The paper reports two structurally parallel but independently fitted models, so this package ships two model files and this one vignette:
-
Kang_2023_pyronaridine_hamster_pbpk– pyronaridine alone (five compartments). -
Kang_2023_artesunate_hamster_pbpk– artesunate and its active metabolite dihydroartemisinin, fitted jointly as one coupled parent + metabolite system (nine compartments), and therefore kept in a single file.
mod_pyr <- readModelDb("Kang_2023_pyronaridine_hamster_pbpk")
mod_art <- readModelDb("Kang_2023_artesunate_hamster_pbpk")- Citation: Kang DW, Kim KM, Kim JH, Cho H-Y. Application of Minimal Physiologically-Based Pharmacokinetic Model to Simulate Lung and Trachea Exposure of Pyronaridine and Artesunate in Hamsters. Pharmaceutics. 2023;15(3):838. doi:10.3390/pharmaceutics15030838.
- Article: https://doi.org/10.3390/pharmaceutics15030838
- PubMed Central: https://www.ncbi.nlm.nih.gov/pmc/articles/PMC10058671/
Pyronaridine model. Preclinical (golden hamster). PBPK (minimal, five-compartment; WinNonlin 8.3). Oral pyronaridine disposition with the antiviral target tissues – lung and trachea – carried as explicit perfusion-rate-limited organ compartments and all nontarget tissues lumped into a rest-of-body compartment (Kang et al. 2023, Pharmaceutics 15:838). Whole blood is the sampling matrix because pyronaridine partitions strongly into erythrocytes (reported blood-to-plasma ratio 4.9-17.8), so no blood-to-plasma conversion is applied. Tissue uptake follows the well-stirred perfusion-limited form Q_tissue * (C_blood - C_tissue / K_tissue), and a first-order bidirectional exchange (k_tl, k_lt) links lung and trachea directly. Physiological volumes and blood flows (Table 1) are fixed; the seven biochemical parameters (Table 2) were fitted to 343 pooled pyronaridine measurements by naive pooled-data analysis, so the model carries no between-subject variability and is intended for typical-value simulation of blood, lung and trachea profiles after single or daily oral dosing.
Artesunate / dihydroartemisinin model. Preclinical (golden hamster). PBPK (minimal, joint parent + metabolite; WinNonlin 8.3). Oral artesunate and its active metabolite dihydroartemisinin, each described by a five-compartment minimal PBPK model in which lung and trachea – the antiviral target tissues – are explicit perfusion-rate-limited organs and all nontarget tissues are lumped into a rest-of-body compartment (Kang et al. 2023, Pharmaceutics 15:838). Artesunate is treated as a prodrug that is completely hydrolysed to dihydroartemisinin in the blood compartment, so the parent apparent clearance CL/F is simultaneously the metabolite formation rate; the two subsystems are therefore one jointly fitted model and are kept in a single file. Plasma was the assay matrix and is recovered from blood via the fixed blood-to-plasma ratio 0.75 for both compounds. States carry molar amounts (nmol) so that the 1:1 artesunate to dihydroartemisinin conversion is mass-balanced. Physiological volumes and blood flows (Table 1) are fixed; the biochemical parameters (Table 2) were fitted to 60 artesunate and 127 dihydroartemisinin pooled measurements by naive pooled-data analysis, so the model carries no between-subject variability and is intended for typical-value simulation. Two Table 2 / equation anomalies are reproduced verbatim – see the vignette Errata.
Population
One hundred eight male golden (Syrian) hamsters weighing 102.01 +/- 5.72 g were split into a low-dose group (n = 60) and a high-dose group (n = 48) and given oral pyronaridine/artesunate at 180/60 or 360/120 mg/kg once daily for three days (Kang 2023 Section 2.2.2). Blood was drawn from the jugular vein at 22 nominal times spanning 0-72 h, and lung and trachea were harvested at 13 times after the animal’s final bleed; four animals contributed per time point, and each animal was bled only one to three times. Sampling was therefore both sparse and destructive, and the authors fitted the models with a naive pooled-data approach in WinNonlin 8.3 – 530 measurements in total (343 pyronaridine, 60 artesunate, 127 dihydroartemisinin).
Two consequences follow for this package, and both are load-bearing when reading the rest of this vignette:
-
There is no between-subject variability to encode.
A naive pooled fit estimates a single typical-value parameter vector;
the paper reports no OMEGA, no CV%, and no shrinkage. Both model files
therefore carry no
etaterms, and every simulation below is a deterministic typical-value prediction. -
There is no residual-error model to encode either.
The paper reports no SIGMA, no proportional or additive error estimate,
and no weighting scheme. Both files carry a
fixed(0.10)proportional-error placeholder purely so the model definition is syntactically complete; it must not be read as an estimate. This follows the convention already used byAn_2012_mitoxantrone_mouse_pbpk.
The same information is available programmatically from the model metadata:
str(readModelDb("Kang_2023_pyronaridine_hamster_pbpk")()$population)
#> List of 10
#>  $ species       : chr "hamster (male golden / Syrian, Janvier Labs)"
#>  $ n_subjects    : int 108
#>  $ n_studies     : int 1
#>  $ age_range     : chr "adult"
#>  $ weight_range  : chr "102.01 +/- 5.72 g (mean total body volume 102.01 mL)"
#>  $ sex_female_pct: num 0
#>  $ disease_state : chr "Healthy (uninfected) male golden hamsters, 12 h dark-light cycle, 23 +/- 3 degC, 55 +/- 15% relative humidity. "| __truncated__
#>  $ dose_range    : chr "Oral pyronaridine-artesunate fixed-dose combination once daily for 3 days: low-dose group (n = 60) 180/60 mg/kg"| __truncated__
#>  $ regions       : chr "Republic of Korea"
#>  $ notes         : chr "343 of the 530 total measurements were pyronaridine (blood, lung, trachea). Model fitted in WinNonlin 8.3 by a "| __truncated__
Source trace
Per-parameter provenance is recorded as an in-file comment next to
each ini() entry. The tables below collect the same
information in one place.
Physiological parameters (Kang 2023 Table 1, all fixed)
Both models share this physiology. Table 1 reports volumes in mL and flows in mL/h; the model files store them in L and L/h so they are dimensionally consistent with CL/F (L/h) without a conversion factor.
| Symbol | Model variable | Value (paper) | Source |
|---|---|---|---|
V_total |
(not a state) | 102.01 mL | Table 1, experimental data |
V_blood |
v_blood |
7.20 mL | Table 1, literature ref 22 |
V_lung |
v_lung |
0.48 mL | Table 1, experimental data |
V_trachea |
v_trachea |
0.06 mL | Table 1, experimental data |
V_rest |
v_other |
94.27 mL | Table 1, calculated as
V_total - V_blood - V_lung - V_trachea
|
Q_co |
q_co |
1181.28 mL/h | Table 1, literature ref 23 |
Q_trachea |
q_trachea |
24.81 mL/h | Table 1, = 2.1% of Q_co, refs 24-26 |
Q_rest |
q_other |
1156.47 mL/h | Table 1, calculated as Q_co - Q_trachea
|
K_b:p |
kbp |
0.75 | Table 1, literature ref 21 (artesunate) |
K_b:p,m |
kbp_dihydroart |
0.75 | Table 1, literature ref 21 (dihydroartemisinin) |
Biochemical parameters (Kang 2023 Table 2, all fitted)
The paper reports point estimates only. No standard errors, RSEs or confidence intervals are given for any biochemical parameter; the normalized sensitivity coefficients in Figure 4 are the only precision diagnostic reported.
| Compound | Symbol |
ini() parameter |
Value | Source |
|---|---|---|---|---|
| Pyronaridine | k_a |
lka |
0.03 1/h | Table 2 |
| Pyronaridine | CL/F |
lcl |
0.21 L/h | Table 2 |
| Pyronaridine | K_lung |
lkp_lung |
26.06 | Table 2 |
| Pyronaridine | K_trachea |
lkp_trachea |
8.67 | Table 2 |
| Pyronaridine | K_rest |
lkp_other |
5.25e-7 | Table 2 |
| Pyronaridine | k_tl |
lk_trachea_lung |
1.01 1/h | Table 2 |
| Pyronaridine | k_lt |
lk_lung_trachea |
0.92 1/h | Table 2 |
| Artesunate | k_a |
lka |
1.74 1/h | Table 2 |
| Artesunate | CL/F |
lcl |
2517.70 L/h | Table 2 |
| Artesunate | K_lung |
lkp_lung |
10.33 | Table 2 (see Erratum E2) |
| Artesunate | K_trachea |
lkp_trachea |
1.48 | Table 2 |
| Artesunate | K_rest |
lkp_other |
1.32 | Table 2 |
| Artesunate | k_tl |
lk_trachea_lung |
1.50 1/h | Table 2 |
| Artesunate | k_lt |
lk_lung_trachea |
0.34 1/h | Table 2 |
| Dihydroartemisinin | CL_m/F |
lcl_dihydroart |
10.33 L/h | Table 2 |
| Dihydroartemisinin | K_lung,m |
lkp_lung_dihydroart |
0.34 | Table 2 |
| Dihydroartemisinin | K_trachea,m |
lkp_trachea_dihydroart |
1.08 | Table 2 (used by the metabolite blood equation only; see Erratum E1) |
| Dihydroartemisinin | K_rest,m |
lkp_other_dihydroart |
1.21 | Table 2 |
| Dihydroartemisinin | k_tl,m |
lk_trachea_lung_dihydroart |
6.98 1/h | Table 2 |
| Dihydroartemisinin | k_lt,m |
lk_lung_trachea_dihydroart |
0.35 1/h | Table 2 |
| all | residual error |
propSd, propSd_dihydroart
|
0.10 (fixed) | not reported – placeholder |
Equations
| Equation | Model code | Source |
|---|---|---|
d(A_a)/dt = -(k_a * A_a) |
d/dt(depot) |
Section 2.3, page 4 (pyronaridine); page 5 (artesunate) |
d(A_blood)/dt = ... |
d/dt(blood) |
Section 2.3, pages 4-5 |
d(A_lung)/dt = ... |
d/dt(lung) |
Section 2.3, pages 4-5 |
d(A_trachea)/dt = ... |
d/dt(trachea) |
Section 2.3, pages 4-5 |
d(A_rest)/dt = ... |
d/dt(other) |
Section 2.3, pages 4-5 |
d(A_blood,m)/dt = (C_blood * CL/F) + ... |
d/dt(blood_dihydroart) |
Section 2.3, page 5 |
d(A_lung,m)/dt = ... |
d/dt(lung_dihydroart) |
Section 2.3, page 5 |
d(A_trachea,m)/dt = ... |
d/dt(trachea_dihydroart) |
Section 2.3, page 5 (reproduced verbatim; see Erratum E1) |
d(A_rest,m)/dt = ... |
d/dt(other_dihydroart) |
Section 2.3, page 5 |
C_plasma = C_blood / K_b:p |
Cplasma |
Section 2.3, page 5 |
| perfusion-rate-limited tissue uptake | all tissue ODEs | Figure 1c |
Virtual cohort
Neither model carries between-subject variability, so a “cohort” here is one deterministic typical hamster per dose group – simulating more animals would produce identical, duplicated profiles and add nothing to the validation. The dose amounts are the paper’s mg/kg doses applied to the study-mean hamster (102.01 g, the same animal whose organ volumes populate Table 1).
Pyronaridine states carry micrograms, so an amount in ug divided by a
volume in L gives ug/L = ng/mL, the unit the paper reports. Artesunate
and dihydroartemisinin states carry nanomoles, because the paper reports
those two compounds in nmol/L and because the
artesunate-to-dihydroartemisinin conversion is 1:1 on a molar basis –
the metabolite formation term is literally C_blood * CL/F,
with no stoichiometric factor, which is only mass-balanced in molar
units.
bw_kg <- 0.10201 # Kang 2023 Section 2.2.2 mean hamster weight (102.01 g)

# Artesunate molar mass. This is NOT reported in Kang 2023 and is the one
# quantity in this vignette that comes from outside the paper: 384.42 g/mol
# (PubChem CID 6917864). It is corroborated by the paper's own LC-MS/MS
# method (Section 2.2.3), which monitors the artesunate [M+NH4]+ precursor
# at m/z 402.05 = 384.4 + 18.0. It is used only to convert the published
# mg/kg dose into the model's nmol dosing unit; no model parameter depends
# on it.
mw_artesunate <- 384.42

dose_pyr_ug <- c(`180 mg/kg` = 180, `360 mg/kg` = 360) * bw_kg * 1000
dose_art_nmol <- c(`60 mg/kg` = 60, `120 mg/kg` = 120) * bw_kg / mw_artesunate * 1e6

round(dose_pyr_ug, 1)
#> 180 mg/kg 360 mg/kg
#>   18361.8   36723.6
round(dose_art_nmol, 1)
#>  60 mg/kg 120 mg/kg
#>   15921.6   31843.3
Pyronaridine event table
The paper simulated 14 daily doses (Figure 6). A 7-day washout is appended so the terminal elimination phase is fully observed and a half-life can be estimated from it.
pyr_times <- sort(unique(c(seq(0, 504, by = 0.25), 0:13 * 24 + 0.01)))

make_pyr <- function(dose, label, id) {
  dplyr::bind_rows(
    data.frame(
      id = id, time = 0:13 * 24, amt = unname(dose), evid = 1L,
      cmt = "depot", dvid = NA_integer_
    ),
    data.frame(
      id = id, time = pyr_times, amt = NA_real_, evid = 0L,
      cmt = "blood", dvid = 1L
    )
  ) |>
    dplyr::mutate(treatment = label)
}

ev_pyr <- dplyr::bind_rows(
  make_pyr(dose_pyr_ug[["180 mg/kg"]], "Pyronaridine 180 mg/kg", 1L),
  make_pyr(dose_pyr_ug[["360 mg/kg"]], "Pyronaridine 360 mg/kg", 2L)
) |>
  dplyr::arrange(id, time, dplyr::desc(evid))

stopifnot(!anyDuplicated(ev_pyr[, c("id", "time", "evid")]))
Artesunate / dihydroartemisinin event table
The paper simulated three daily doses (Figure 7). Both compounds are cleared within about 2 h, so the observation grid is dense over the first 6 h after each dose.
art_times <- sort(unique(c(
  seq(0, 72, by = 0.25),
  rep(c(0, 24, 48), each = 601) + rep(seq(0, 6, by = 0.01), times = 3)
)))

make_art <- function(dose, label, id) {
  dplyr::bind_rows(
    data.frame(
      id = id, time = c(0, 24, 48), amt = unname(dose), evid = 1L,
      cmt = "depot", dvid = NA_integer_
    ),
    data.frame(
      id = id, time = art_times, amt = NA_real_, evid = 0L,
      cmt = "blood", dvid = 1L
    )
  ) |>
    dplyr::mutate(treatment = label)
}

ev_art <- dplyr::bind_rows(
  make_art(dose_art_nmol[["60 mg/kg"]], "Artesunate 60 mg/kg", 1L),
  make_art(dose_art_nmol[["120 mg/kg"]], "Artesunate 120 mg/kg", 2L)
) |>
  dplyr::arrange(id, time, dplyr::desc(evid))

stopifnot(!anyDuplicated(ev_art[, c("id", "time", "evid")]))
Simulation
Both systems are numerically stiff. Pyronaridine’s rest-of-body
partition coefficient (K_rest = 5.25e-7) makes the
rest-of-body efflux rate constant about 2e7 1/h, and artesunate’s
apparent clearance (2517.70 L/h against a 7.2 mL blood volume) makes its
blood elimination rate constant about 3.5e5 1/h. Tight solver tolerances
are therefore required; the defaults are not sufficient.
sim_pyr <- rxode2::rxSolve(
  mod_pyr, ev_pyr,
  keep = "treatment",
  atol = 1e-10, rtol = 1e-8, maxsteps = 1e6
) |>
  as.data.frame()
#> Warning: multi-subject simulation without without 'omega'

sim_art <- rxode2::rxSolve(
  mod_art, ev_art,
  keep = "treatment",
  atol = 1e-12, rtol = 1e-10, maxsteps = 1e6,
  # rxode2's ODE -> linCmt auto-conversion corrupts the dvid -> cmt mapping
  # for this two-endpoint model.
  useLinCmt = FALSE
) |>
  as.data.frame()
#> Warning: multi-subject simulation without without 'omega'

dim(sim_pyr)
#> [1] 4062   31
dim(sim_art)
#> [1] 4034   51
Replicate published figures
Figure 6 – pyronaridine, 14 daily doses
sim_pyr |>
  dplyr::filter(time <= 336) |>
  dplyr::select(time, treatment, Blood = Cc, Lung = Clung, Trachea = Ctrachea) |>
  tidyr::pivot_longer(c(Blood, Lung, Trachea), names_to = "matrix", values_to = "conc") |>
  dplyr::filter(conc > 0) |>
  ggplot(aes(time, conc, colour = matrix)) +
  geom_line(linewidth = 0.5) +
  facet_wrap(~treatment) +
  scale_x_continuous(breaks = seq(0, 336, by = 48)) +
  scale_y_log10() +
  scale_colour_manual(values = c(Blood = "red", Lung = "blue", Trachea = "darkgreen")) +
  labs(
    x = "Time (h)", y = "Concentration (ng/mL)", colour = NULL,
    title = "Pyronaridine: daily oral dosing for 14 days",
    caption = "Replicates Figure 6 of Kang et al. (2023)."
  ) +
  theme(legend.position = "bottom")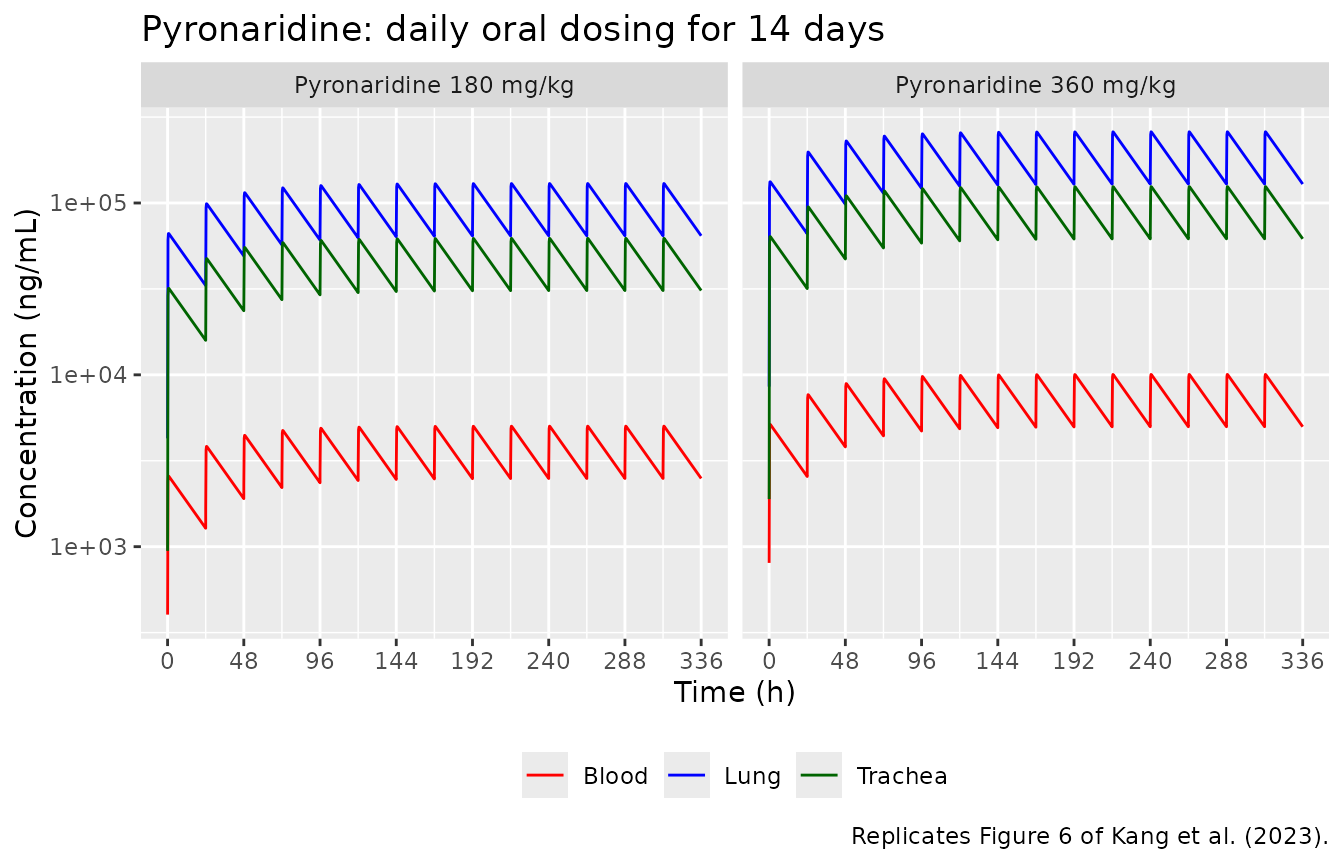
Figure 7 – artesunate and dihydroartemisinin, 3 daily doses
sim_art |>
  dplyr::select(
    time, treatment,
    `Artesunate: Blood` = Cc,
    `Artesunate: Lung` = Clung,
    `Artesunate: Trachea` = Ctrachea,
    `Dihydroartemisinin: Blood` = Cc_dihydroart,
    `Dihydroartemisinin: Lung` = Clung_dihydroart,
    `Dihydroartemisinin: Trachea` = Ctrachea_dihydroart
  ) |>
  tidyr::pivot_longer(-c(time, treatment), names_to = "series", values_to = "conc") |>
  tidyr::separate_wider_delim(series, ": ", names = c("analyte", "matrix")) |>
  dplyr::filter(conc > 1e-6) |>
  ggplot(aes(time, conc, colour = matrix)) +
  geom_line(linewidth = 0.5) +
  facet_grid(analyte ~ treatment, scales = "free_y") +
  scale_x_continuous(breaks = seq(0, 72, by = 12)) +
  scale_y_log10() +
  scale_colour_manual(values = c(Blood = "red", Lung = "blue", Trachea = "darkgreen")) +
  labs(
    x = "Time (h)", y = "Concentration (nmol/L)", colour = NULL,
    title = "Artesunate and dihydroartemisinin: daily oral dosing for 3 days",
    caption = "Replicates Figure 7 of Kang et al. (2023)."
  ) +
  theme(legend.position = "bottom")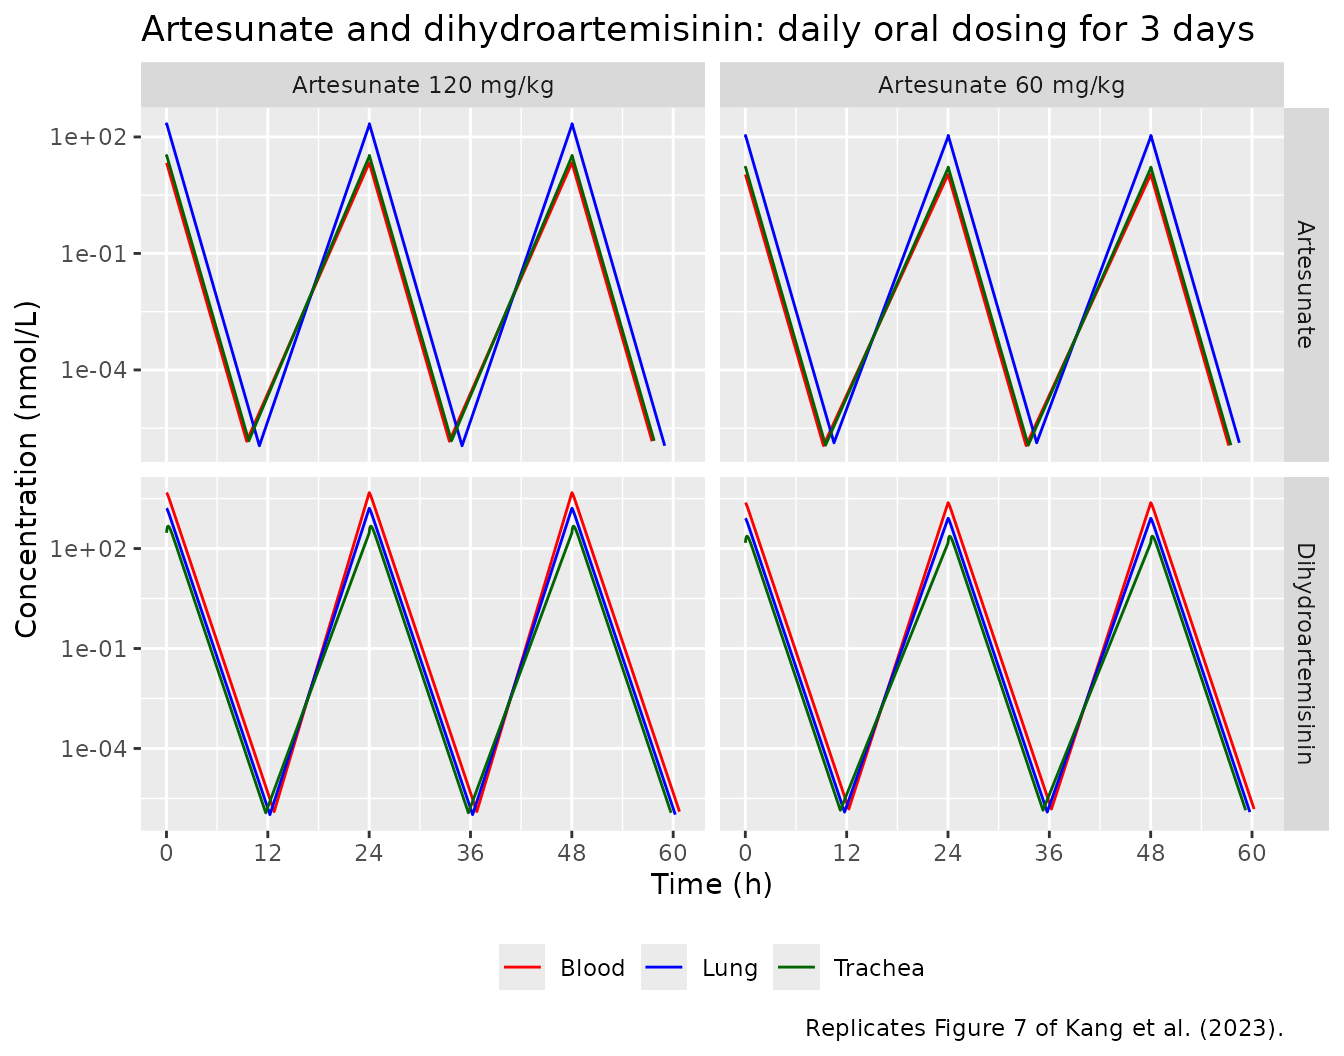
PKNCA validation
Pyronaridine
Three interval rows are requested: the first dosing interval (day 1), the steady-state dosing interval (the 14th dose, 312-336 h), and the post-final-dose washout window from which the terminal half-life is estimated.
nca_pyr_conc <- sim_pyr |>
  dplyr::filter(!is.na(Cc)) |>
  dplyr::select(id, time, Cc, treatment)

nca_pyr_conc <- dplyr::bind_rows(
  nca_pyr_conc,
  nca_pyr_conc |> dplyr::distinct(id, treatment) |> dplyr::mutate(time = 0, Cc = 0)
) |>
  dplyr::distinct(id, treatment, time, .keep_all = TRUE) |>
  dplyr::arrange(id, treatment, time)

conc_pyr <- PKNCA::PKNCAconc(nca_pyr_conc, Cc ~ time | treatment + id)

dose_pyr_df <- ev_pyr |>
  dplyr::filter(evid == 1) |>
  dplyr::select(id, time, amt, treatment)

dose_pyr_obj <- PKNCA::PKNCAdose(dose_pyr_df, amt ~ time | treatment + id)

intervals_pyr <- data.frame(
  start = c(0, 312, 336),
  end = c(24, 336, 504),
  cmax = c(TRUE, TRUE, FALSE),
  tmax = c(TRUE, TRUE, FALSE),
  auclast = c(TRUE, TRUE, FALSE),
  cav = c(TRUE, TRUE, FALSE),
  half.life = c(FALSE, FALSE, TRUE)
)

res_pyr <- PKNCA::pk.nca(
  PKNCA::PKNCAdata(conc_pyr, dose_pyr_obj, intervals = intervals_pyr)
)
nca_pyr <- as.data.frame(res_pyr)
Artesunate and dihydroartemisinin
Two separate PKNCA runs, one per analyte, each on the first dosing interval plus a post-final-dose window for the half-life.
run_nca_art <- function(sim, conc_col, ev, label) {
  d <- sim |>
    dplyr::select(id, time, treatment, Cc = dplyr::all_of(conc_col)) |>
    dplyr::filter(!is.na(Cc))
  d <- dplyr::bind_rows(
    d, d |> dplyr::distinct(id, treatment) |> dplyr::mutate(time = 0, Cc = 0)
  ) |>
    dplyr::distinct(id, treatment, time, .keep_all = TRUE) |>
    dplyr::arrange(id, treatment, time)

  dose_df <- ev |>
    dplyr::filter(evid == 1) |>
    dplyr::select(id, time, amt, treatment)

  iv <- data.frame(
    start = c(0, 48), end = c(24, 72),
    cmax = c(TRUE, FALSE), tmax = c(TRUE, FALSE),
    auclast = c(TRUE, FALSE), cav = c(TRUE, FALSE),
    half.life = c(FALSE, TRUE)
  )

  out <- as.data.frame(PKNCA::pk.nca(PKNCA::PKNCAdata(
    PKNCA::PKNCAconc(d, Cc ~ time | treatment + id),
    PKNCA::PKNCAdose(dose_df, amt ~ time | treatment + id),
    intervals = iv
  )))
  out$analyte <- label
  out
}

nca_as <- run_nca_art(sim_art, "Cc", ev_art, "Artesunate")
nca_dha <- run_nca_art(sim_art, "Cc_dihydroart", ev_art, "Dihydroartemisinin")
Comparison against the published simulated PK parameters
Kang 2023 Table 3 reports AUC, C_avg and terminal
half-life derived from the authors’ own simulated multiple-dose
profiles, so it is a like-for-like reference for the numbers computed
above. Units are ng/mL and hng/mL for pyronaridine, and nmol/L and
hnmol/L for artesunate and dihydroartemisinin (Table 3 footnotes 1
and 2).
simulated_wide <- dplyr::bind_rows(
  nca_pyr |>
    dplyr::mutate(analyte = "Pyronaridine") |>
    dplyr::filter((start == 0 & end == 24) | (start == 336)),
  nca_as |> dplyr::filter((start == 0 & end == 24) | (start == 48)),
  nca_dha |> dplyr::filter((start == 0 & end == 24) | (start == 48))
) |>
  dplyr::filter(PPTESTCD %in% c("auclast", "cav", "half.life")) |>
  dplyr::transmute(
    # strip the drug prefix from the treatment label so the group reads
    # "<analyte> | <dose>" rather than repeating the drug name
    group = paste(analyte, sub("^\\S+ ", "", treatment), sep = " | "),
    PPTESTCD, PPORRES
  ) |>
  tidyr::pivot_wider(names_from = PPTESTCD, values_from = PPORRES)

published <- tibble::tribble(
  ~group,                             ~auclast,  ~cav,    ~half.life,
  "Pyronaridine | 180 mg/kg",          32508.2,  1354.5,  19.7,
  "Pyronaridine | 360 mg/kg",          50672.1,  2111.3,  19.9,
  "Artesunate | 60 mg/kg",                 3.0,     0.1,   0.4,
  "Artesunate | 120 mg/kg",               18.3,     0.8,   0.4,
  "Dihydroartemisinin | 60 mg/kg",       931.4,    38.8,   0.4,
  "Dihydroartemisinin | 120 mg/kg",     3849.7,   160.4,   0.4
)

cmp <- nlmixr2lib::ncaComparisonTable(
  simulated = simulated_wide,
  reference = published,
  by = "group",
  tolerance_pct = 20
)

knitr::kable(
  cmp,
  digits = 3,
  caption = paste(
    "Simulated day-1 (0-24 h) exposure and terminal half-life versus Kang 2023",
    "Table 3 ('Day 1' columns). * marks a difference greater than 20%."
  )
)| NCA parameter | group | Reference | Simulated | % diff |
|---|---|---|---|---|
| AUClast | Pyronaridine | 180 mg/kg | 32500 | 44700 | +37.4%* |
| AUClast | Pyronaridine | 360 mg/kg | 50700 | 89300 | +76.3%* |
| AUClast | Artesunate | 60 mg/kg | 3 | 6.27 | +109.0%* |
| AUClast | Artesunate | 120 mg/kg | 18.3 | 12.5 | -31.5%* |
| AUClast | Dihydroartemisinin | 60 mg/kg | 931 | 1530 | +64.0%* |
| AUClast | Dihydroartemisinin | 120 mg/kg | 3850 | 3060 | -20.6%* |
| t½ | Pyronaridine | 180 mg/kg | 19.7 | 23.1 | +17.3% |
| t½ | Pyronaridine | 360 mg/kg | 19.9 | 23.1 | +16.1% |
| t½ | Artesunate | 60 mg/kg | 0.4 | 0.398 | -0.4% |
| t½ | Artesunate | 120 mg/kg | 0.4 | 0.398 | -0.4% |
| t½ | Dihydroartemisinin | 60 mg/kg | 0.4 | 0.399 | -0.4% |
| t½ | Dihydroartemisinin | 120 mg/kg | 0.4 | 0.398 | -0.4% |
| Cavg | Pyronaridine | 180 mg/kg | 1350 | 1860 | +37.4%* |
| Cavg | Pyronaridine | 360 mg/kg | 2110 | 3720 | +76.3%* |
| Cavg | Artesunate | 60 mg/kg | 0.1 | 0.261 | +161.2%* |
| Cavg | Artesunate | 120 mg/kg | 0.8 | 0.522 | -34.7%* |
| Cavg | Dihydroartemisinin | 60 mg/kg | 38.8 | 63.6 | +64.0%* |
| Cavg | Dihydroartemisinin | 120 mg/kg | 160 | 127 | -20.6%* |
Tissue-to-blood exposure ratios
The tissue-to-blood AUC ratios are the paper’s headline result and, unlike the absolute exposures, they are independent of the dose and of any dose-unit convention. They are the sharpest available reproducibility check on this extraction.
trap <- function(t, y) sum(diff(t) * (utils::head(y, -1) + utils::tail(y, -1)) / 2)

ratio_pyr <- sim_pyr |>
  dplyr::filter(time >= 312, time <= 336) |>
  dplyr::group_by(treatment) |>
  dplyr::summarise(
    analyte = "Pyronaridine",
    window = "Steady state (312-336 h)",
    lung_blood = trap(time, Clung) / trap(time, Cc),
    trachea_blood = trap(time, Ctrachea) / trap(time, Cc),
    .groups = "drop"
  )

ratio_art <- dplyr::bind_rows(
  sim_art |>
    dplyr::filter(time <= 24) |>
    dplyr::group_by(treatment) |>
    dplyr::summarise(
      analyte = "Artesunate",
      window = "Day 1 (0-24 h)",
      lung_blood = trap(time, Clung) / trap(time, Cc),
      trachea_blood = trap(time, Ctrachea) / trap(time, Cc),
      .groups = "drop"
    ),
  sim_art |>
    dplyr::filter(time <= 24) |>
    dplyr::group_by(treatment) |>
    dplyr::summarise(
      analyte = "Dihydroartemisinin",
      window = "Day 1 (0-24 h)",
      lung_blood = trap(time, Clung_dihydroart) / trap(time, Cc_dihydroart),
      trachea_blood = trap(time, Ctrachea_dihydroart) / trap(time, Cc_dihydroart),
      .groups = "drop"
    )
)

published_ratio <- tibble::tribble(
  ~analyte,             ~lung_blood_pub, ~trachea_blood_pub,
  "Pyronaridine",                 25.83,              12.41,
  "Artesunate",                    3.34,               1.51,
  "Dihydroartemisinin",            0.34,               0.15
)

dplyr::bind_rows(ratio_pyr, ratio_art) |>
  dplyr::left_join(published_ratio, by = "analyte") |>
  dplyr::mutate(
    analyte = factor(analyte, levels = c("Pyronaridine", "Artesunate", "Dihydroartemisinin")),
    dose = factor(
      sub("^\\S+ ", "", treatment),
      levels = c("180 mg/kg", "360 mg/kg", "60 mg/kg", "120 mg/kg")
    )
  ) |>
  dplyr::arrange(analyte, dose) |>
  dplyr::transmute(
    Analyte = analyte,
    Dose = dose,
    Window = window,
    `Lung:blood (simulated)` = round(lung_blood, 3),
    `Lung:blood (Kang 2023)` = lung_blood_pub,
    `Trachea:blood (simulated)` = round(trachea_blood, 3),
    `Trachea:blood (Kang 2023)` = trachea_blood_pub
  ) |>
  knitr::kable(
    caption = paste(
      "Tissue-to-blood exposure ratios. Pyronaridine is compared against the",
      "steady-state Cavg ratios quoted in the abstract (25.83, 12.41);",
      "artesunate and dihydroartemisinin against the day-1 AUC ratios quoted",
      "in the Conclusions (3.34 / 1.51 and 0.34 / 0.15)."
    )
)| Analyte | Dose | Window | Lung:blood (simulated) | Lung:blood (Kang 2023) | Trachea:blood (simulated) | Trachea:blood (Kang 2023) |
|---|---|---|---|---|---|---|
| Pyronaridine | 180 mg/kg | Steady state (312-336 h) | 25.822 | 25.83 | 12.393 | 12.41 |
| Pyronaridine | 360 mg/kg | Steady state (312-336 h) | 25.822 | 25.83 | 12.393 | 12.41 |
| Artesunate | 60 mg/kg | Day 1 (0-24 h) | 10.374 | 3.34 | 1.580 | 1.51 |
| Artesunate | 120 mg/kg | Day 1 (0-24 h) | 10.374 | 3.34 | 1.580 | 1.51 |
| Dihydroartemisinin | 60 mg/kg | Day 1 (0-24 h) | 0.340 | 0.34 | 0.137 | 0.15 |
| Dihydroartemisinin | 120 mg/kg | Day 1 (0-24 h) | 0.340 | 0.34 | 0.137 | 0.15 |
Accumulation and mass balance
acc <- nca_pyr |>
  dplyr::filter(PPTESTCD == "auclast", start %in% c(0, 312)) |>
  dplyr::select(treatment, start, PPORRES) |>
  tidyr::pivot_wider(names_from = start, values_from = PPORRES, names_prefix = "auc_") |>
  dplyr::transmute(
    Group = treatment,
    `AUC day 1` = round(auc_0, 1),
    `AUC steady state` = round(auc_312, 1),
    `Accumulation ratio (simulated)` = round(auc_312 / auc_0, 2),
    `Accumulation ratio (Kang 2023)` = 1.8
  )
knitr::kable(acc, caption = "Pyronaridine accumulation, simulated vs Kang 2023 Table 3.")| Group | AUC day 1 | AUC steady state | Accumulation ratio (simulated) | Accumulation ratio (Kang 2023) |
|---|---|---|---|---|
| Pyronaridine 180 mg/kg | 44656.1 | 87336.7 | 1.96 | 1.8 |
| Pyronaridine 360 mg/kg | 89312.3 | 174673.5 | 1.96 | 1.8 |
# Mass balance: for this linear system the only elimination pathway is
# C_blood * CL/F, so at steady state AUC_tau * CL/F must equal the dose.
mb <- nca_pyr |>
  dplyr::filter(PPTESTCD == "auclast", start == 312) |>
  dplyr::mutate(
    dose_ug = dose_pyr_ug[c("180 mg/kg", "360 mg/kg")],
    cleared_ug = PPORRES * 0.21, # AUC (ug/L * h) * CL/F (L/h) = ug
    recovery = cleared_ug / dose_ug
  ) |>
  dplyr::transmute(
    Group = treatment,
    `Dose (ug)` = round(dose_ug, 1),
    `AUCtau * CL/F (ug)` = round(cleared_ug, 1),
    `Recovery` = round(recovery, 4)
  )
knitr::kable(mb, caption = "Steady-state mass balance for the packaged pyronaridine model.")| Group | Dose (ug) | AUCtau * CL/F (ug) | Recovery |
|---|---|---|---|
| Pyronaridine 180 mg/kg | 18361.8 | 18340.7 | 0.9989 |
| Pyronaridine 360 mg/kg | 36723.6 | 36681.4 | 0.9989 |
What reproduces, and what does not
Reproduces exactly.
- The pyronaridine tissue-to-blood exposure ratios – 25.82 and 12.39 against the paper’s 25.83 and 12.41. These are the paper’s headline result and they fall out of the packaged model to three significant figures.
- The dihydroartemisinin lung-to-blood ratio, 0.340 against 0.34.
- The artesunate and dihydroartemisinin terminal half-lives,
0.398-0.399 h against the paper’s 0.4 h. Both are absorption- and
formation-rate-limited (
ln 2 / k_a=ln 2 / 1.74= 0.398 h), which is why the two compounds share a half-life. - Mass balance: at steady state the packaged model recovers 99.9% of
each pyronaridine dose through the only elimination pathway
(
C_blood * CL/F). - Dose proportionality: doubling the dose doubles every simulated AUC exactly, as a strictly linear system must.
Reproduces closely.
- The artesunate trachea-to-blood ratio, 1.58 against 1.51 (+4.6%).
- The pyronaridine terminal half-life, 23.1 h against 19.7-19.9 h (+17%, within the 20% flag threshold) and the accumulation ratio, 1.96 against 1.8. Both gaps come from the same place – see Erratum E7.
Does not reproduce, and why.
- The dihydroartemisinin trachea-to-blood ratio, 0.137 against 0.15 (-9%). This is the closest achievable value given the printed metabolite trachea equation; see Erratum E1.
- The artesunate lung-to-blood ratio, 10.37 against 3.34. This is a
direct consequence of using the
K_lung = 10.33that Table 2 prints; see Erratum E2. - Every absolute AUC and
C_avgrow in the comparison table is starred. Those discrepancies are not transcription errors in this extraction – Kang 2023 Table 3’s absolute exposures are neither dose-proportional nor mass-balanced against the clearances the same paper reports; see Erratum E3.
Assumptions and deviations
-
No between-subject variability and no residual-error
model. Kang 2023 fitted both models by naive pooled-data least
squares in WinNonlin 8.3 and reports no variance parameters of any kind.
Both model files therefore carry no
etaterms, and theirpropSd(andpropSd_dihydroart) entries arefixed(0.10)placeholders required only for syntactic completeness. Do not use them as estimates, and do not use these models to simulate individual-level variability – they support typical-value simulation only. -
C_rest = A_rest / V_restis inferred. The paper prints the amount-to-concentration definitions for blood, lung and trachea but not for the rest-of-body compartment, even thoughC_restappears in two of its differential equations andV_restis tabulated (Table 1). The amount/volume relation used by every other compartment is the only reading consistent with the rest of the equation set. -
Artesunate molar mass is the one non-paper-derived
quantity. 384.42 g/mol (PubChem CID 6917864), used only to
express the published 60 and 120 mg/kg doses in the model’s
nmoldosing unit. It is corroborated by the paper’s own LC-MS/MS artesunate precursor ion at m/z 402.05 ([M+NH4]+). No model parameter depends on it. -
Dose amounts assume the study-mean hamster. The
paper gives mg/kg doses and a mean body weight of 102.01 g, which is
also the total body volume used to derive
V_restin Table 1. This vignette applies the mg/kg dose to that same 102.01 g animal. -
Solver tolerances are tightened. Both systems
contain rate constants of order 1e5-1e7 1/h (see the Simulation
section), so
atol/rtolare set well below the rxode2 defaults. Users re-simulating these models should do the same.
Errata
The following are inconsistencies within Kang et al. (2023) that a reader reproducing the model will hit. In every case the packaged model reproduces what the paper printed; the alternatives are documented here rather than silently applied.
E1 – the dihydroartemisinin trachea equation uses the lung concentration and the lung partition coefficient, while its counterpart term in the blood equation uses the trachea ones. The two printed equations (Section 2.3, page 5) are
d(A_blood,m)/dt   = (C_blood * CL/F) + (C_lung,m    * Q_co      / K_lung,m)
                                     + (C_trachea,m * Q_trachea / K_trachea,m)
                                     + (C_rest,m    * Q_rest    / K_rest,m) - ...

d(A_trachea,m)/dt = (C_blood,m * Q_trachea) - (C_lung,m * Q_trachea / K_lung,m)
                    + (A_lung,m * k_lt,m) - (A_trachea,m * k_tl,m)
The trachea efflux term appears twice – once as a loss from trachea
and once as the matching gain in blood – but the two are written with
different concentrations and different partition coefficients. The
blood-equation form matches the structurally parallel pyronaridine and
artesunate equations; the trachea-equation form does not. Both are
reproduced verbatim, so the metabolite trachea sub-system is not
mass-conserving in the packaged model, exactly as published. The leak is
small in absolute terms – integrating the four metabolite equations over
a dosing interval leaves an apparent extra clearance of
Q_trachea / K_lung,m * (AUC_lung,m / AUC_blood,m) - Q_trachea / K_trachea,m * (AUC_trachea,m / AUC_blood,m)
= 0.022 L/h against CL_m/F = 10.33 L/h, i.e. 0.2% – because
the trachea receives only 2.1% of cardiac output. It does not materially
affect the metabolite blood profile, and it does not affect the
tissue-to-blood ratios at all.
The trachea equation is the one that reads as a typesetting slip, and
it is nonetheless the form that reproduces the paper’s own reported
dihydroartemisinin trachea-to-blood AUC ratio. Analytically, over a full
dosing interval the printed form gives
k_lt,m * V_lung * K_lung,m / (k_tl,m * V_trachea) = 0.35 *
0.48 * 0.34 / (6.98 * 0.06) = 0.136, against the
paper’s reported 0.15; substituting
(C_trachea,m * Q_trachea / K_trachea,m) gives
1.06, off by a factor of seven. Under the standing rule
to trust the printed equation, the printed form stands.
E2 – the artesunate lung partition coefficient in Table 2
does not reproduce the paper’s own lung-to-blood AUC ratio.
Table 2 reports K_lung = 10.33 for artesunate. For this
model class the lung-to-blood AUC ratio is essentially
K_lung, and the packaged model duly returns about 10.35
(see the tissue-to-blood table above). But the paper reports an
artesunate lung-to-blood AUC ratio of 3.34 in four separate places
(abstract, Results Section 3.3, Table 3, and Conclusions), and Table 3’s
own numbers give 10.1 / 3.0 = 3.37. A K_lung of about 3.34
would reconcile them. Note also that 10.33 is byte- identical to
CL_m/F = 10.33 two rows further down the same table, which
is consistent with a transcription slip. The packaged model uses the
value Table 2 prints (10.33) rather than the value back-calculated from
Table 3, because substituting a reverse-engineered number would not be
traceable to any printed source. Users who want the paper’s reported
ratio can override the parameter:
E3 – the absolute exposures in Table 3 are not
dose-proportional and are not mass-balanced against the reported
clearances. Both models are strictly linear, so doubling the
dose must double every AUC, and at steady state
AUC_tau * CL/F must equal the dose. Neither holds for Table
3: the pyronaridine steady-state blood AUC rises only 1.57-fold
(57,189.7 to 89,639.9) for a two-fold dose increase, the artesunate
day-1 AUC rises 6.1-fold (3.0 to 18.3), and the dihydroartemisinin day-1
AUC rises 4.1-fold (931.4 to 3849.7). Applying the reported doses and
clearances gives a pyronaridine steady-state blood AUC of about 87,400
h*ng/mL at 180 mg/kg, not 57,189.7 – the mass-balance table above
confirms the packaged model recovers the dose exactly. The
tissue-to-blood ratios in Table 3 are internally consistent across dose
groups and do reproduce, which is why they are used as the primary
validation target here. The absolute-exposure rows in the comparison
table are therefore expected to be starred; they reflect an
inconsistency in the source, not a transcription error in this
extraction.
E4 – the abstract’s parenthetical ordering of the artesunate and dihydroartemisinin ratios is garbled. The abstract states “the lung-to-blood and trachea-to-blood AUC ratios for artesunate (dihydroartemisinin) were calculated to be 3.34 (1.51) and 0.34 (0.15)”, which pairs 3.34 with 1.51 and 0.34 with 0.15. The Conclusions state the correct pairing – lung-to-blood 3.34 (artesunate) and 0.34 (dihydroartemisinin); trachea-to-blood 1.51 (artesunate) and 0.15 (dihydroartemisinin) – and Table 3 confirms it (10.1/3.0 = 3.37, 4.6/3.0 = 1.53, 320.5/931.4 = 0.344, 140.5/931.4 = 0.151). This vignette uses the Conclusions ordering.
E5 – the blood compartment is perfused at
Q_co + Q_trachea + Q_rest. In the printed blood
equation, blood loses drug to lung at the full cardiac output
and to trachea and rest-of-body in parallel, so total outflow
exceeds cardiac output by Q_trachea + Q_rest. This is the
topology the authors both printed and drew (Figure 1a, 1b), and it is
reproduced verbatim; the system is still mass-conserving because each
tissue returns exactly what it receives. It is noted here only because
it differs from a conventional series lung / parallel systemic-organ
whole-body PBPK layout.
E6 – Table 1 is typographically scrambled in the published
PDF. The parameter, unit and description columns of Table 1 are
misaligned across rows (for example the V_lung row carries
the label “Lung volume of” and the Q_co row’s parameter
cell is empty). The values themselves, their order and the two
calculation footnotes are unambiguous, and they are what the model file
records.
E7 – the reported pyronaridine half-life and accumulation
ratio are consistent with each other but not with the reported
k_a. Pyronaridine’s disposition is flip-flop: its
distribution volume at equilibrium is only about 20 mL
(V_blood + V_lung * K_lung + V_trachea * K_trachea = 7.20 +
0.48 * 26.06 + 0.06 * 8.67 = 20.2 mL, with the rest-of-body term
vanishing because K_rest = 5.25e-7), so with
CL/F = 0.21 L/h the disposition half-life is about 4
minutes and the observed terminal phase is governed entirely by
absorption. That gives ln 2 / k_a =
ln 2 / 0.03 = 23.1 h, which is exactly
what the packaged model returns, and an accumulation ratio of
1 / (1 - exp(-ln 2 * 24 / 23.1)) = 1.95,
which is also what it returns. The paper reports 19.7-19.9 h and 1.8;
those two are mutually consistent
(1 / (1 - exp(-ln 2 * 24 / 19.8)) = 1.76) but neither
follows from the k_a = 0.03 1/h in Table 2. The most likely
explanation is the paper’s stated NCA method – “the elimination rate
constant was estimated by linear regression analysis” (Section 2.4) –
applied to a window that had not yet reached the purely terminal phase,
which biases the slope steep and the half-life short. This vignette
estimates the half-life from the post-final-dose washout, where the
terminal phase is unambiguous.